

Long-term variation in influenza A virus prevalence and subtype diversity in migratory mallards in northern Europe
- PMID: 24573857
- PMCID: PMC3953854
- DOI: 10.1098/rspb.2014.0098
Long-term variation in influenza A virus prevalence and subtype diversity in migratory mallards in northern Europe
Abstract
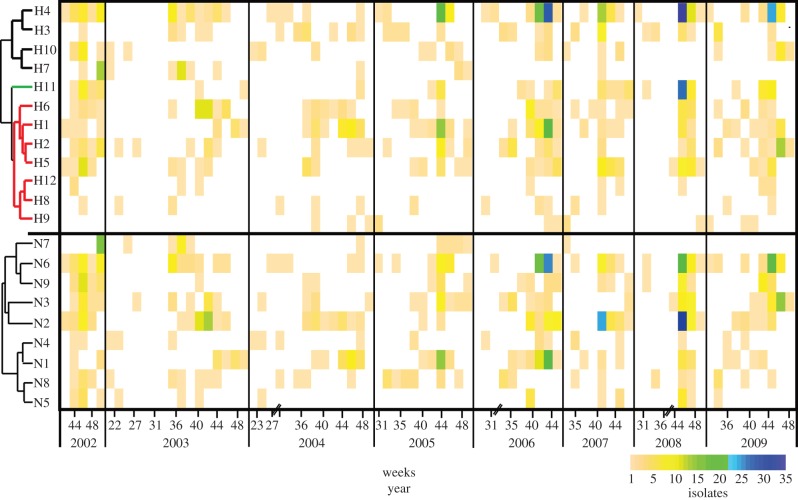
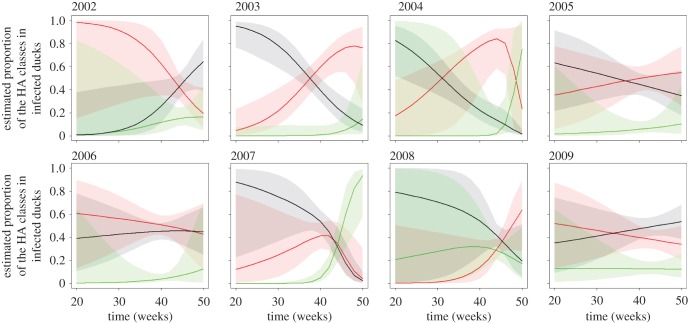
Data on long-term circulation of pathogens in wildlife populations are seldom collected, and hence understanding of spatial-temporal variation in prevalence and genotypes is limited. Here, we analysed a long-term surveillance series on influenza A virus (IAV) in mallards collected at an important migratory stopover site from 2002 to 2010, and characterized seasonal dynamics in virus prevalence and subtype diversity. Prevalence dynamics were influenced by year, but retained a common pattern for all years whereby prevalence was low in spring and summer, but increased in early autumn with a first peak in August, and a second more pronounced peak during October-November. A total of 74 haemagglutinin (HA)/neuraminidase (NA) combinations were isolated, including all NA and most HA (H1-H12) subtypes. The most common subtype combinations were H4N6, H1N1, H2N3, H5N2, H6N2 and H11N9, and showed a clear linkage between specific HA and NA subtypes. Furthermore, there was a temporal structuring of subtypes within seasons based on HA phylogenetic relatedness. Dissimilar HA subtypes tended to have different temporal occurrence within seasons, where the subtypes that dominated in early autumn were rare in late autumn, and vice versa. This suggests that build-up of herd immunity affected IAV dynamics in this system.
Keywords: disease dynamics; diversity; host–pathogen interactions; influenza A virus; mallards; prevalence.
Figures

References
-
- Olsen B, Munster VJ, Wallensten A, Waldenstrom J, Osterhaus ADME, Fouchier RAM. 2006. Global patterns of influenza A virus in wild birds. Science 312, 384–388 (doi:10.1126/science.1122438) - DOI - PubMed
-
- Alexander DJ, Capua I. 2008. Avian influenza in poultry. World Poultry Sci. J. 64, 513–531 (doi:10.1017/S0043933908000184) - DOI
-
- Fouchier RA, Munster V, Wallensten A, Bestebroer TM, Herfst S, Smith D, Rimmelzwaan GF, Olsen B, Osterhaus AD. 2005. Characterization of a novel influenza A virus hemagglutinin subtype (H16) obtained from black-headed gulls. J. Virol. 79, 2814–2822 (doi:10.1128/JVI.79.5.2814-2822.2005) - DOI - PMC - PubMed
-
- Easterday BC, Trainer DO, Tumova B, Pereira HG. 1968. Evidence of infection with influenza viruses in migratory waterfowl. Nature 219, 523–524 (doi:10.1038/219523a0) - DOI - PubMed
Publication types
MeSH terms
LinkOut - more resources
Full Text Sources
Other Literature Sources
Medical
