. 2014 Apr;141(7):1492-502.
doi: 10.1242/dev.098954. Epub 2014 Feb 26.

Hox proteins drive cell segregation and non-autonomous apical remodelling during hindbrain segmentation

Affiliations

Hox proteins drive cell segregation and non-autonomous apical remodelling during hindbrain segmentation

Fabrice Prin et al. Development. 2014 Apr.

Abstract

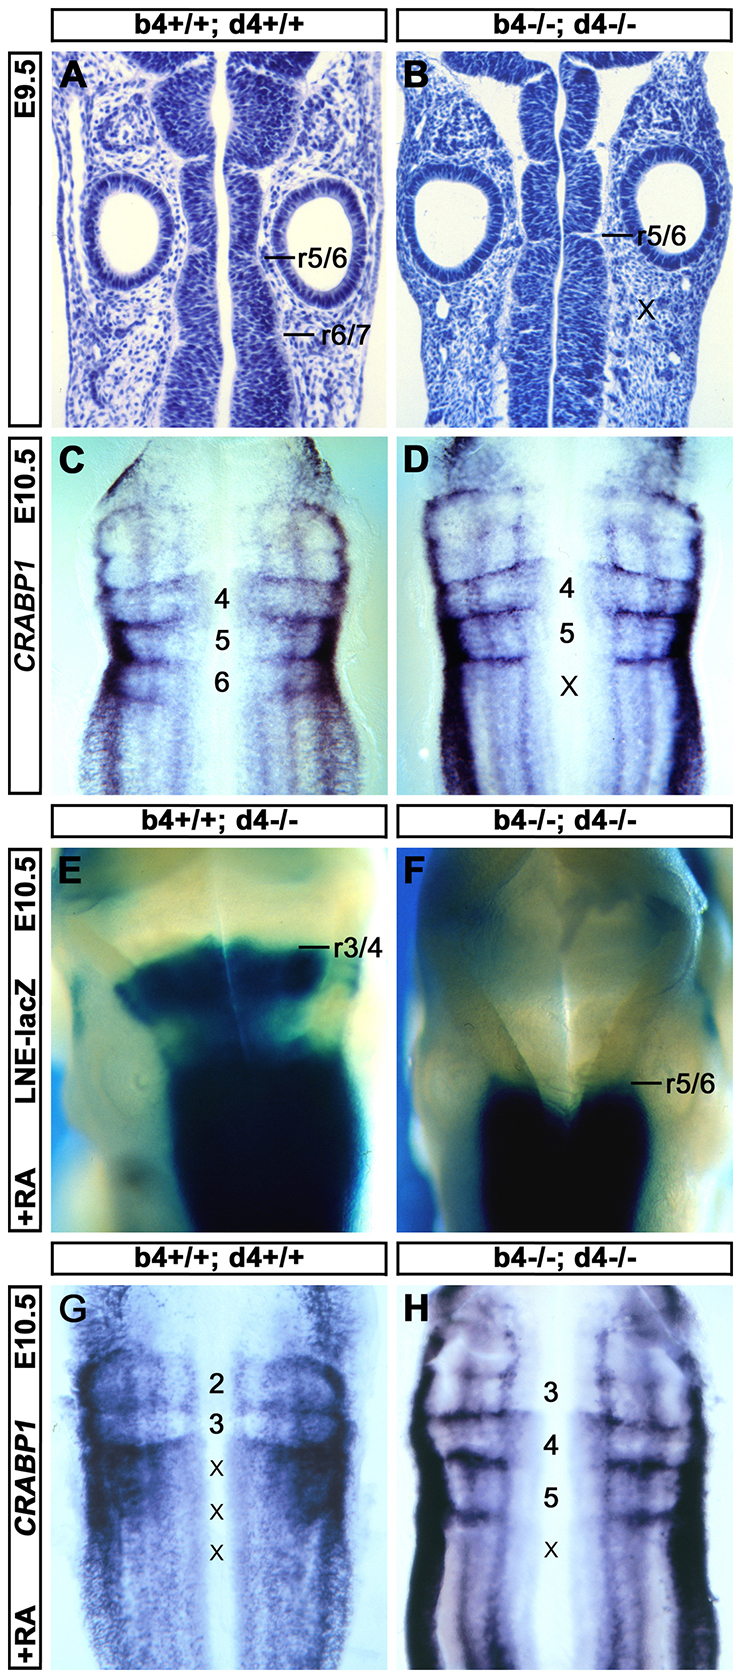
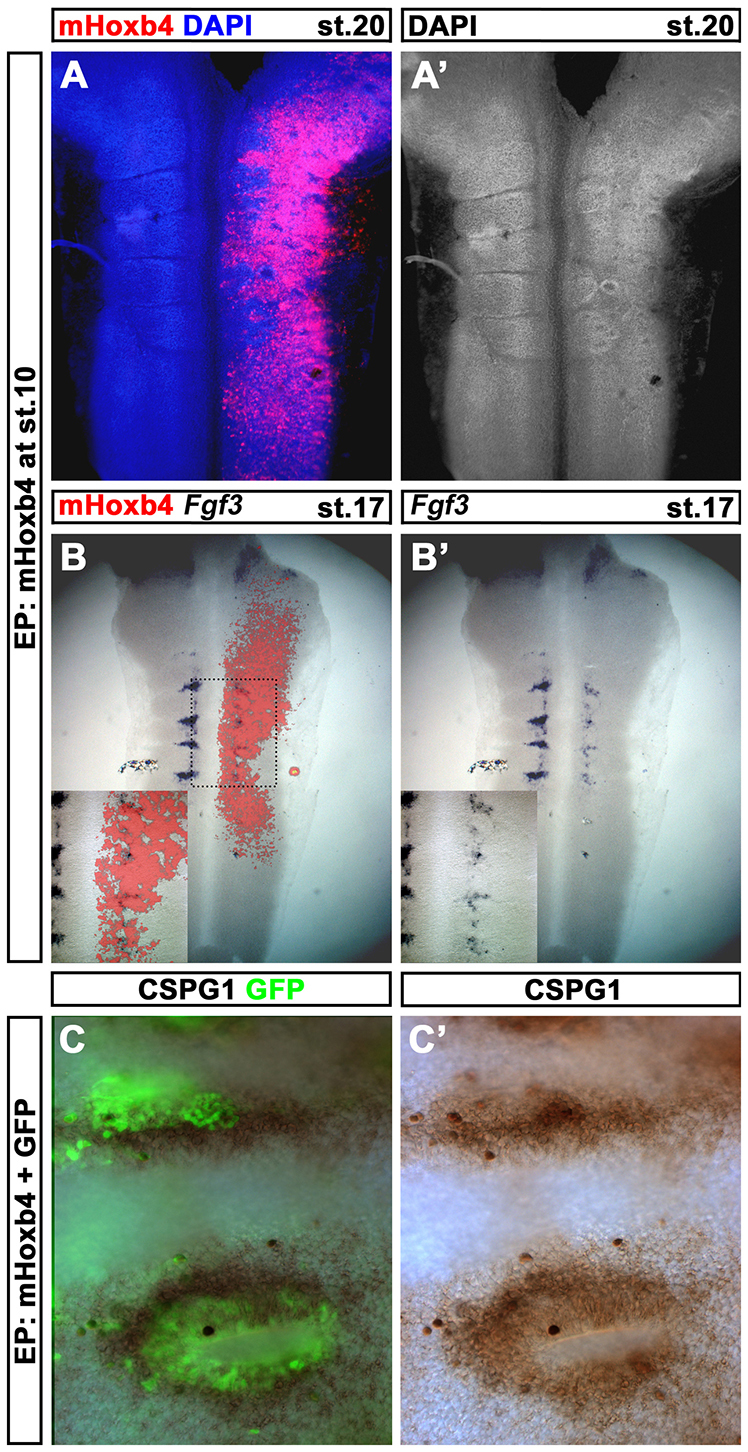
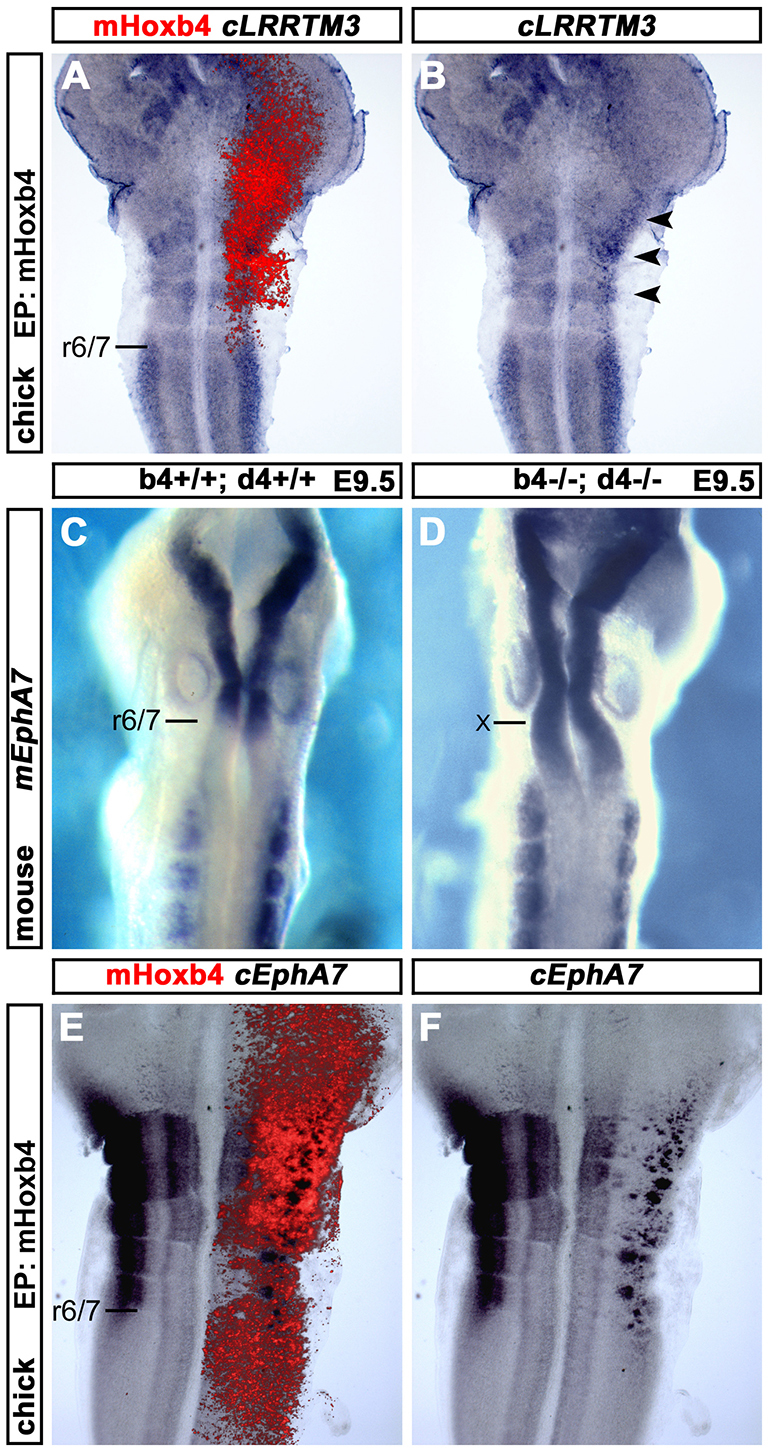
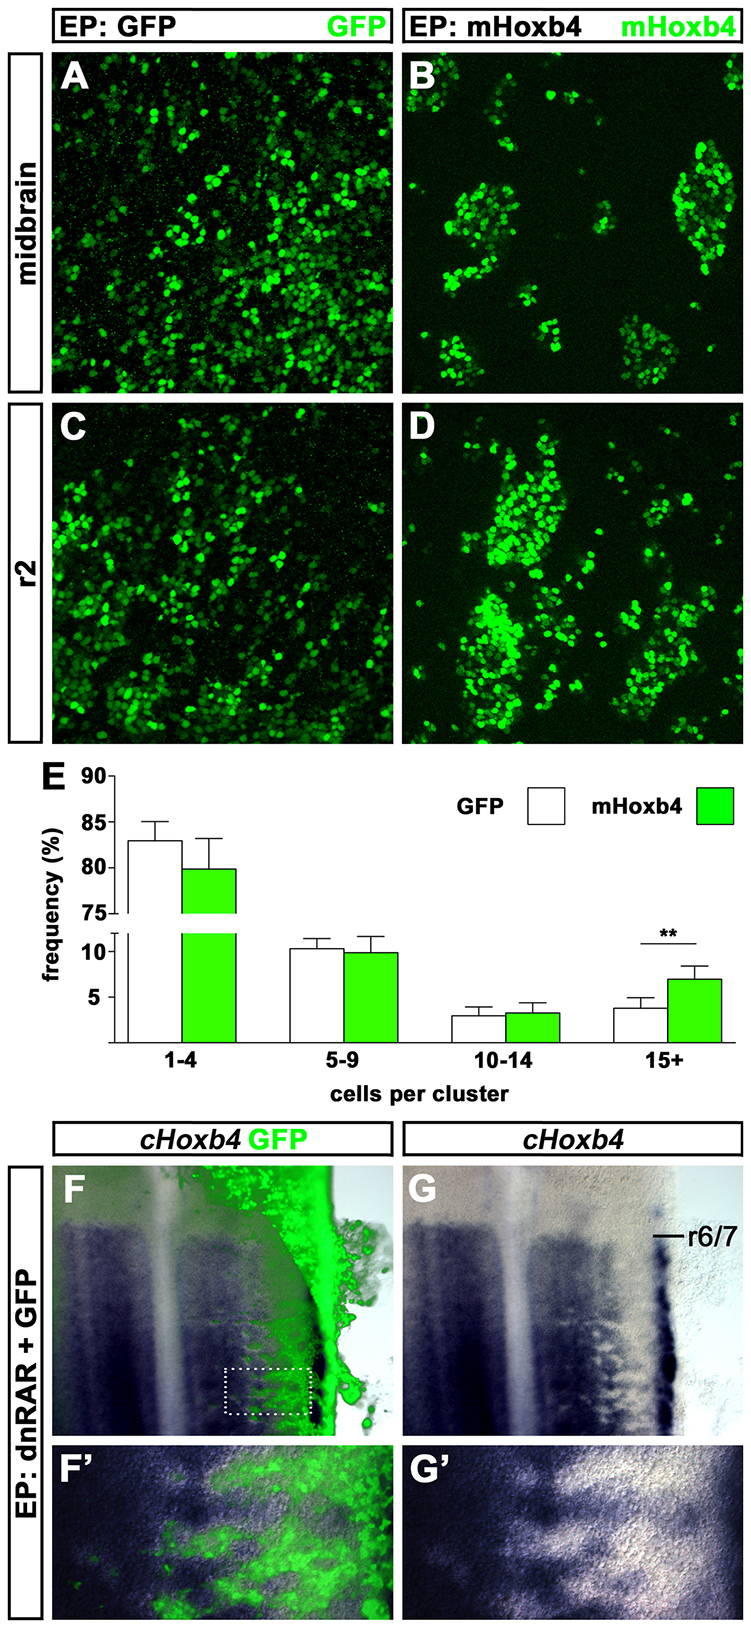
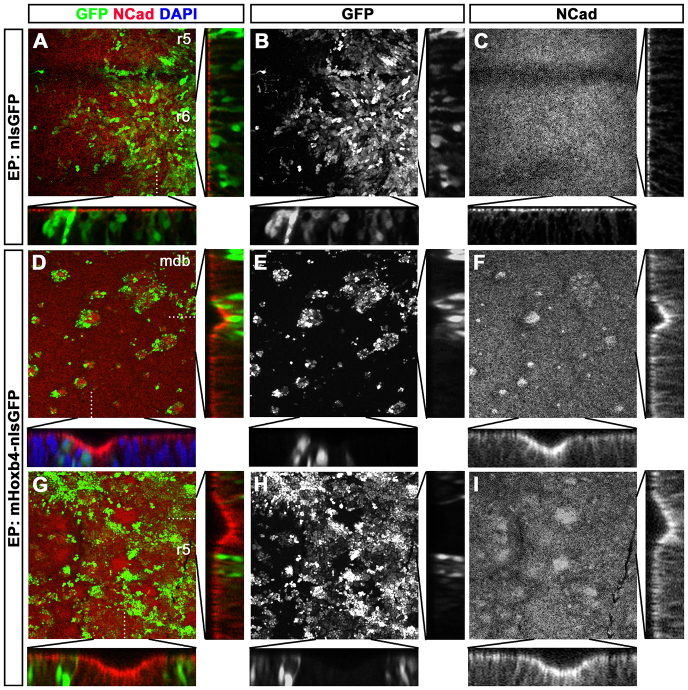
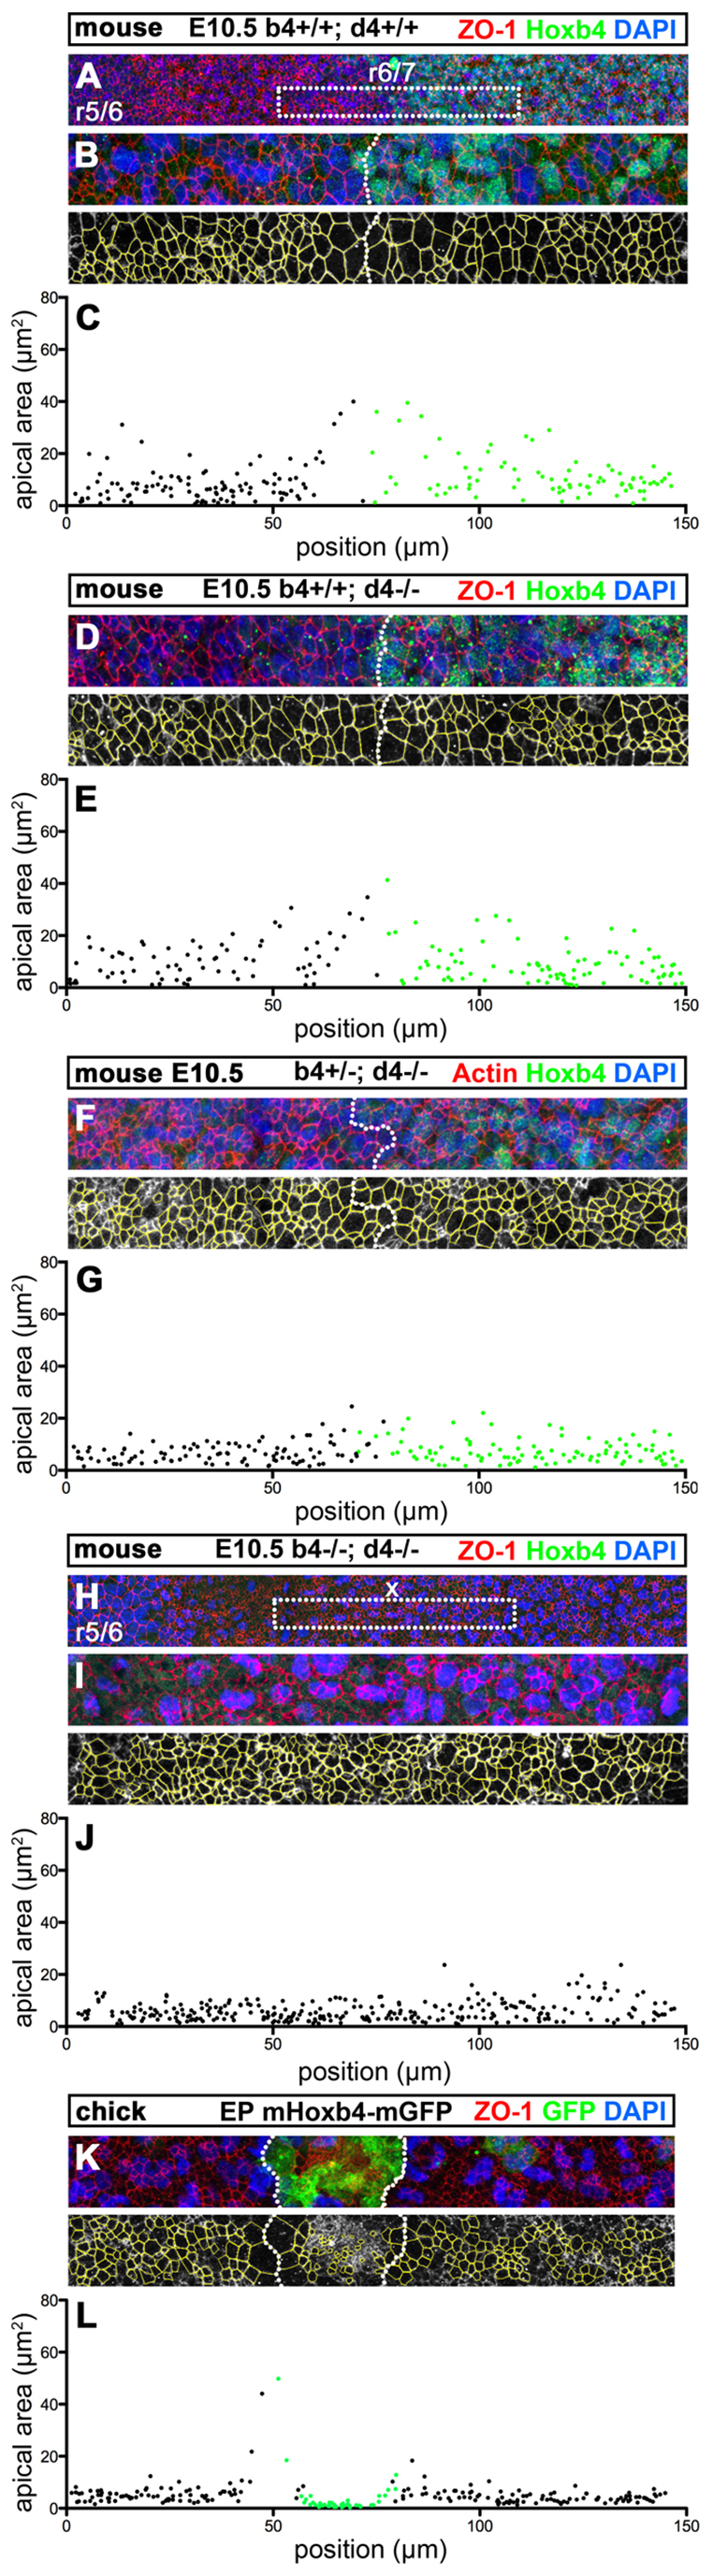
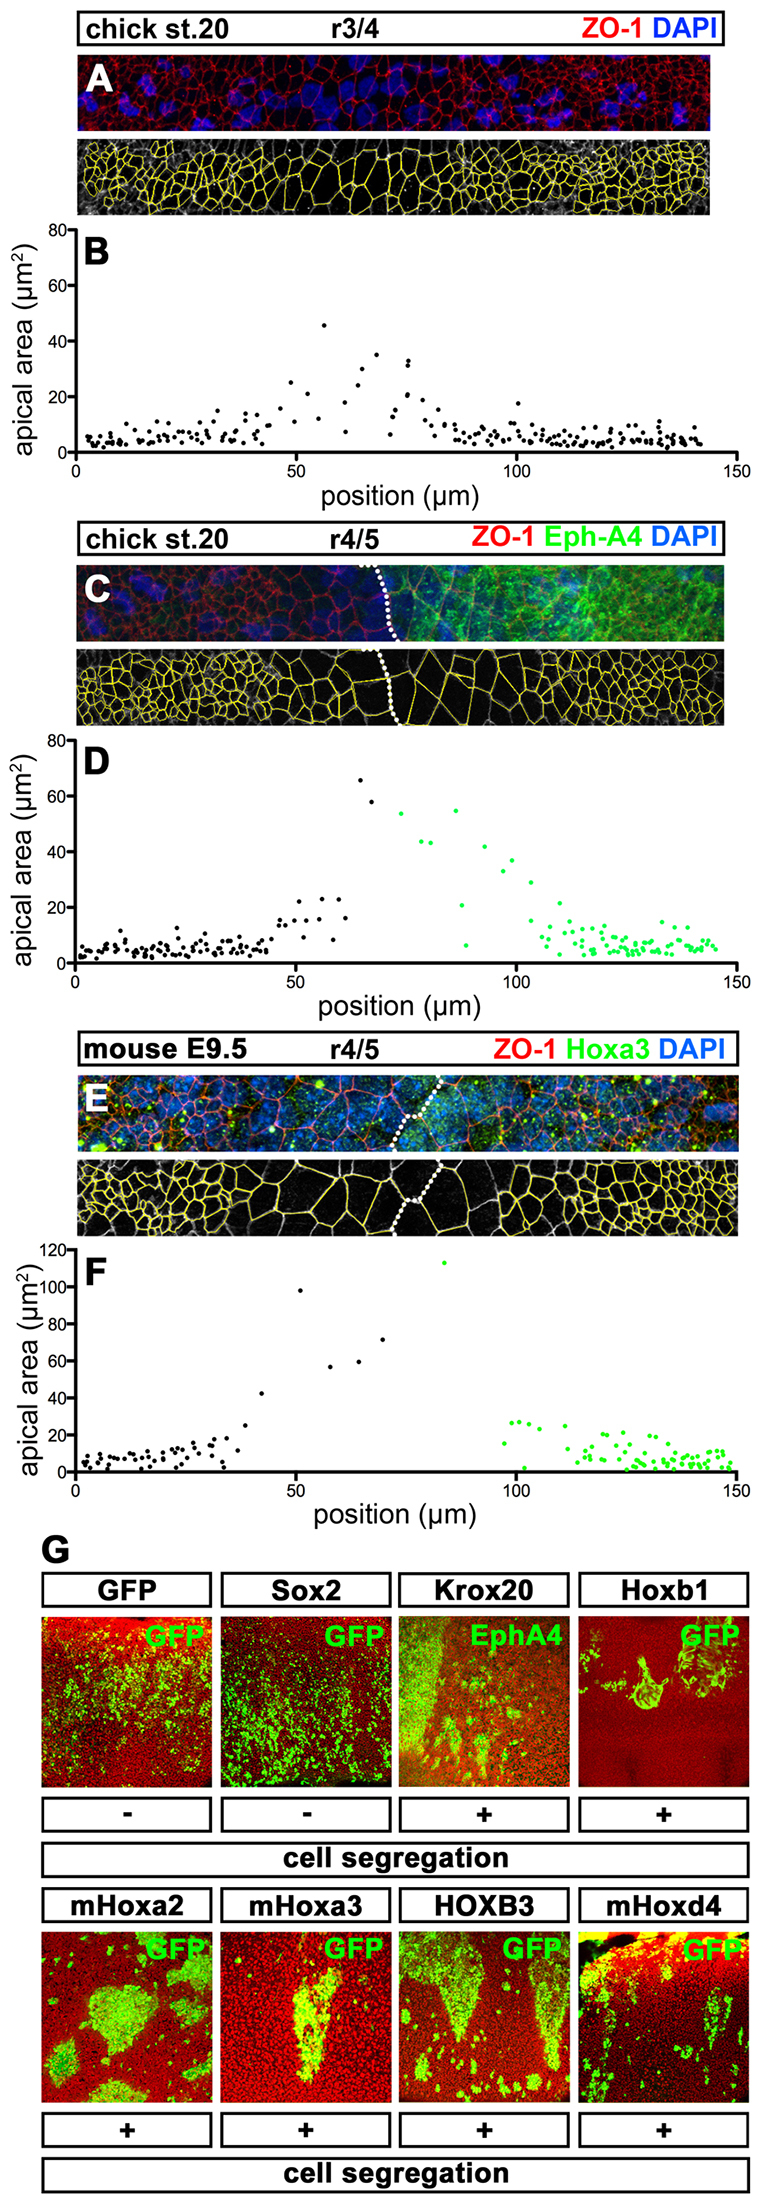
Hox genes encode a conserved family of homeodomain transcription factors regulating development along the major body axis. During embryogenesis, Hox proteins are expressed in segment-specific patterns and control numerous different segment-specific cell fates. It has been unclear, however, whether Hox proteins drive the epithelial cell segregation mechanism that is thought to initiate the segmentation process. Here, we investigate the role of vertebrate Hox proteins during the partitioning of the developing hindbrain into lineage-restricted units called rhombomeres. Loss-of-function mutants and ectopic expression assays reveal that Hoxb4 and its paralogue Hoxd4 are necessary and sufficient for cell segregation, and for the most caudal rhombomere boundary (r6/r7). Hox4 proteins regulate Eph/ephrins and other cell-surface proteins, and can function in a non-cell-autonomous manner to induce apical cell enlargement on both sides of their expression border. Similarly, other Hox proteins expressed at more rostral rhombomere interfaces can also regulate Eph/ephrins, induce apical remodelling and drive cell segregation in ectopic expression assays. However, Krox20, a key segmentation factor expressed in odd rhombomeres (r3 and r5), can largely override Hox proteins at the level of regulation of a cell surface target, Epha4. This study suggests that most, if not all, Hox proteins share a common potential to induce cell segregation but in some contexts this is masked or modulated by other transcription factors.

Keywords: Apical polarity; Cell affinities; Cell segregation; Cell sorting; Cell tension; Chick; Hindbrain; Hox; Mouse; Rhombomeres; Segmentation.


Figures

Fig. 1.
Fig. 1.
Hox4 genes are required for the mouse r6/r7 boundary. (A,B) Hematoxylin-stained coronal sections of E9.5 mouse hindbrains showing a visible r6/r7 boundary in wild-type (A) but not in Hoxb4-/-; Hoxd4-/- (B) embryos. Positions of posterior rhombomere boundaries (r5/r6, r6/r7) and the presumptive missing r6/r7 boundary (x) are indicated. (C,D) Flat-mounted E10.5 mouse hindbrains showing enrichment of Crabp1 mRNA at rhombomere boundaries in wild-type (C) and in Hoxb4-/-; Hoxd4-/- (D) embryos. The positions of rhombomeres and mispecified r7 (x) are indicated. (E,F) Dorsal views of the hindbrains of E10.5 mouse embryos expressing an LNE-LacZ reporter (blue staining) in a Hoxb4+/+; Hoxd4-/- (E) or Hoxb4-/-; Hoxd4-/- (F) genetic background after RA treatment at E9.25. The rhombomere boundaries corresponding to the anterior limit of LacZ staining (indicating the anterior limit of posterior Hox gene misexpression) are indicated. (G,H) Flat-mounted E10.5 mouse hindbrains showing Crabp1 mRNA after RA treatment at E9.25 in wild-type (G) and in Hoxb4-/-; Hoxd4-/- (H) embryos. Rhombomeres retaining clearly discernible Crabp1 boundary expression are numbered and those with disrupted boundary expression are indicated with a cross.
Fig. 2.
Fig. 2.
Widespread mouse Hoxb4 misexpression suppresses chick rhombomere boundaries. (A-B′) Flat-mounted chick hindbrains electroporated with mouse Hoxb4. Ectopic mouse Hoxb4 expression (red) on the electroporated (right) side is indicated in A,B. (A,A′) DAPI staining reveals that ectopic Hoxb4 has disrupted morphological segmentation. (B,B′) Expression of Fgf3 mRNA 1 day after electroporation in rhombomere boundaries is reduced or absent on the electroporated side. Residual Fgf3+ cells are displaced by the mouse Hoxb4+ electroporated cells (insets). (C,C′) Flat-mounted chick hindbrains co-electroporated with separate mouse Hoxb4 and GFP plasmids. GFP+ electroporated cells (green) and the distribution of Cspg1 are shown. Cspg1 highlights rhombomere boundaries and is also detected around groups of mouse Hoxb4 electroporated cells.
Fig. 3.
Fig. 3.
Hox4 genes activate Lrrtm3 and repress Epha7 expression. (A,B) Chick Lrrtm3 mRNA expression in a stage 18 flat-mounted chick hindbrain, following electroporation with mouse Hoxb4 at stage 10. Cells ectopically expressing mouse Hoxb4 (red) and upregulating chick Lrrtm3 mRNA (arrowheads) are indicated. (C,D) Dorsal views of E9.5 mouse embryos showing mouse Epha7 mRNA expression in wild-type (C) and Hox4 double mutant (D) embryos. In the absence of Hoxb4 and Hoxd4, mouse Epha7 expression is derepressed posteriorwards. X indicates position of the presumptive r6/r7 boundary (E,F) Flat-mounted chick hindbrains, electroporated with mouse Hoxb4 showing that Hoxb4-expressing cells (red) are associated with a downregulation of chick Epha7 mRNA expression.
Fig. 4.
Fig. 4.
Mosaic Hoxb4 expression induces chick neuroepithelial cell segregation. (A-D) Confocal z-projections of flat-mount hindbrains electroporated with an nlsGFP control plasmid (A,C) or a mouse Hoxb4-ires-nlsGFP plasmid (B,D). Electroporated cells are detected by GFP or mouse Hoxb4 immunostaining (green) as indicated. The region of the CNS shown is indicated on the left (r2 or midbrain). (E) Frequency distribution of cell cluster sizes in nlsGFP electroporated (white columns, n=19 independent fields from six embryos) and mouse Hoxb4 electroporated (green columns, n=22 independent fields from eight embryos) hindbrains. Clusters of 15+ cells are found more frequently in mouse Hoxb4 electroporated hindbrains. Error bars indicate 95% confidence interval (**P=0.0062, Mann-Whitney test). (F-G′) Flat-mount chick hindbrains after co-electroporation of separate dnRAR and GFP plasmids. Electroporated GFP-expressing cells (green) form cell clusters and are associated with strong downregulation of chick Hoxb4 mRNA expression in r7 and more posterior CNS regions. (F′,G′) are higher magnifications of the area indicated by the dotted box.
Fig. 5.
Fig. 5.
Mosaic mouse Hoxb4 induces non-cell-autonomous redistribution of cadherins and apical constriction. (A-I) Flat-mounted chick hindbrains after electroporation with an nlsGFP control plasmid (A-C) or a bicistronic mouse Hoxb4-ires-nlsGFP plasmid (D-I). GFP (green) and N-cadherin (red) expression are shown in confocal z-projections of 29 μm encompassing the apical surface and subapical zone. Magnified YZ and XZ orthogonal projections are shown on the right and bottom of each panel. Black lines indicate the magnified region and white dotted lines the projection coordinates. (A-C) Projection from the r6 region showing uniform N-cadherin staining in GFP expressing and non-expressing cells. (D-F) Projection from the posterior midbrain/anterior hindbrain area showing that N-cadherin staining is increased in mouse Hoxb4/GFP-expressing cell clusters. Orthogonal projections reveal that increased N-cadherin staining in mouse Hoxb4+ cells is associated with shallow invaginations that remain contiguous with the neuroepithelium. (G-I) Projection from an r5 region with a high frequency of mouse Hoxb4-nlsGFP electroporated cells. Increased N-cadherin staining is observed in clusters of non-electroporated cells. Orthogonal projections reveal that increased N-cadherin staining in mouse Hoxb4- cells is associated with shallow invaginations that remain contiguous with the neuroepithelium.
Fig. 6.
Fig. 6.
Hox4 proteins are necessary and sufficient to induce non-autonomous apical cell enlargement. (A-H) Confocal immunostaining for Hoxb4 (green) and ZO-1 (red) on E10.5 flat-mounted mouse hindbrains of wild-type (Hoxb4+/+; Hoxd4+/+) (A,B), Hoxb4+/+; Hoxd4-/- (D), Hoxb4+/-; Hoxd4-/- (F) and Hox4 double-mutant (H,I) embryos at a lateral level of the r6/r7 boundary region. The r6/r7 boundary or its presumptive position (x) are indicated in A and H. (B,I) Confocal z-projections of similar magnifications of the r6/r7 boundary region as in D (corresponding to dotted boxes in A and H) showing the apical cell outlines (yellow) used for quantitation. (C,E,G,J) Apical areas (μm2) with respect to the anteroposterior position of the cells in B,D,F,I, respectively. Hoxb4+ (green) and Hoxb4- (black) cells are indicated. (K,L) Confocal z-projections and ZO-1 apical outlines (yellow) of the chick r5 neuroepithelium electroporated with mouse Hoxb4-mGFP. (K) Mouse Hoxb4/GFP+ cells (green) form a cluster with a well-defined interface (dotted line). (L) Corresponding apical cell areas (μm2) with respect to anteroposterior position for mouse Hoxb4+ (green) and mouse Hoxb4- (black) cells. Anterior is towards the left.
Fig. 7.
Fig. 7.
Several different Hox proteins can induce neuroepithelial cell segregation. (A-F) Confocal z-projections of confocal stacks through the apical surface of flat-mounted hindbrains at the mid-D/V level of r3/r4 (A) and r4/r5 (C,E) boundaries. Apical cell areas are detected by ZO-1 immunostaining (red) and the outlines used for analysis are shown in yellow in the respective bottom panels. (B,D,F) Distribution of apical cell areas (μm2) along the anteroposterior axis, as quantified from the above panels. The green data points in D and F indicate the r5 cells expressing Epha4 (C) or Hoxa3 (E), respectively. (G) Confocal z-projections of flat-mounted hindbrains, electroporated with plasmids expressing GFP and various transcription factors. GFP (green) and propidium iodide or DAPI staining (red) are shown in all panels except I, where Epha4 (green) is shown. The presence of absence of robust neuroepithelial cell segregation from observations of multiple electroporated specimens is denoted beneath each panel (+ or -). Anterior is towards the left.

Similar articles

Cited by

References

    1. Alexander T., Nolte C., Krumlauf R. (2009). Hox genes and segmentation of the hindbrain and axial skeleton. Annu. Rev. Cell Dev. Biol. 25, 431–456 - PubMed
    1. Araujo M., Nieto M. A. (1997). The expression of chick EphA7 during segmentation of the central and peripheral nervous system. Mech. Dev. 68, 173–177 - PubMed
    1. Barrow J. R., Stadler H. S., Capecchi M. R. (2000). Roles of Hoxa1 and Hoxa2 in patterning the early hindbrain of the mouse. Development 127, 933–944 - PubMed
    1. Batlle E., Wilkinson D. G. (2012). Molecular mechanisms of cell segregation and boundary formation in development and tumorigenesis. Cold Spring Harb. Perspect. Biol. 4, a008227 - PMC - PubMed
    1. Becker N., Seitanidou T., Murphy P., Mattéi M. G., Topilko P., Nieto M. A., Wilkinson D. G., Charnay P., Gilardi-Hebenstreit P. (1994). Several receptor tyrosine kinase genes of the Eph family are segmentally expressed in the developing hindbrain. Mech. Dev. 47, 3–17 - PubMed

Publication types