. 2014 Apr;71(4):257-72.
doi: 10.1002/cm.21167. Epub 2014 Feb 26.

Phosphorylation of α-tubulin by protein kinase C stimulates microtubule dynamics in human breast cells

Affiliations

Phosphorylation of α-tubulin by protein kinase C stimulates microtubule dynamics in human breast cells

Shatarupa De et al. Cytoskeleton (Hoboken). 2014 Apr.

Abstract

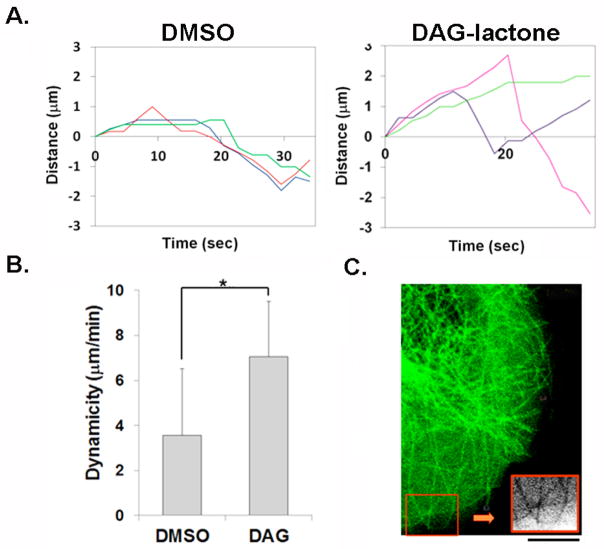
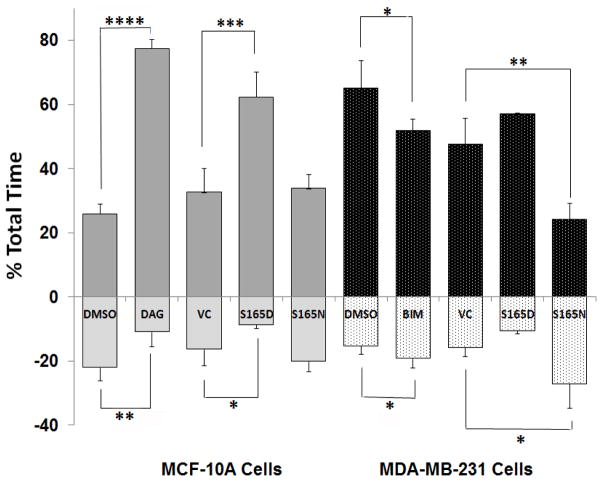
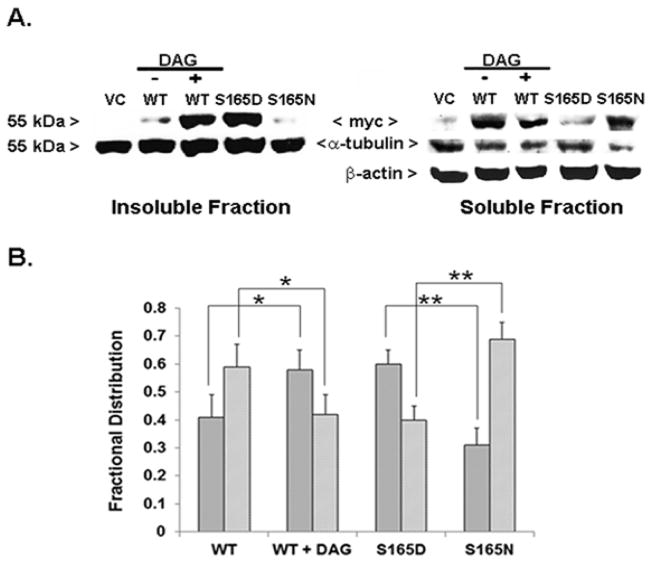
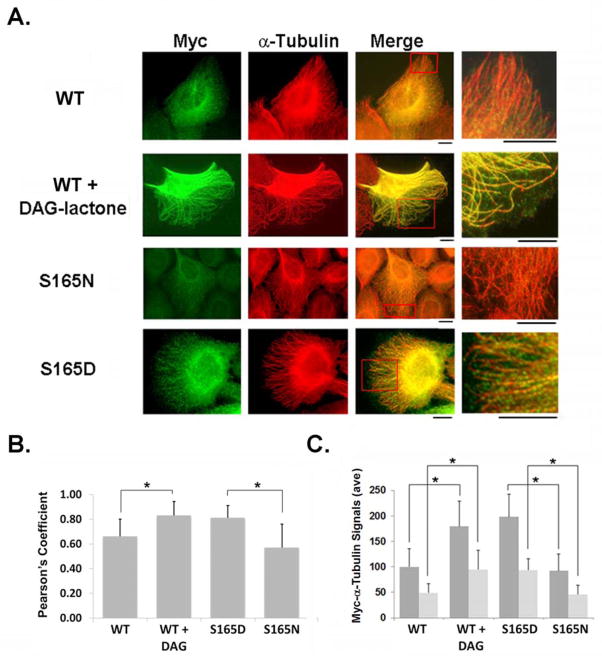
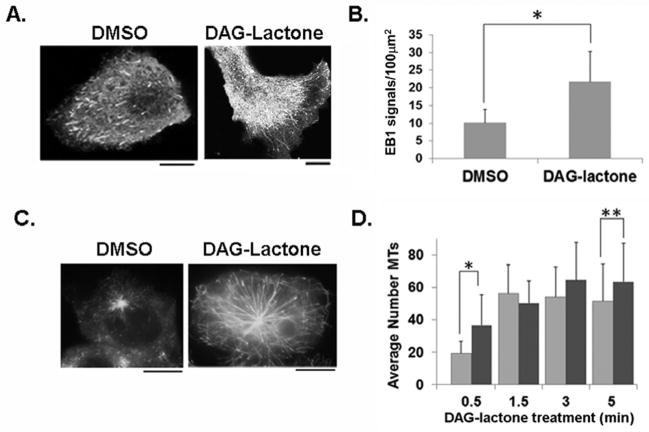
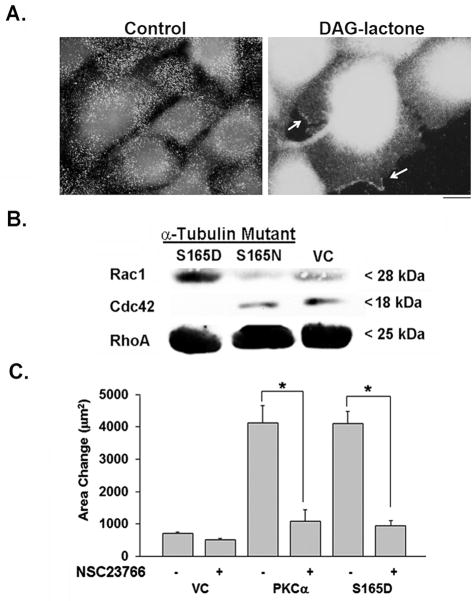
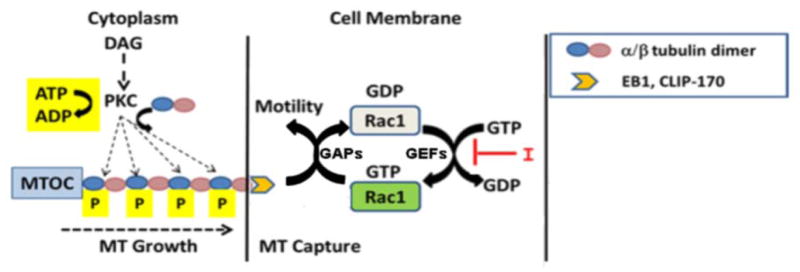
Protein kinase C (PKC) engenders motility through phosphorylation of α-tubulin at Ser-165 in nontransformed MCF-10A cells. Live cell imaging explored the impact of PKC-mediated phosphorylation on microtubule (MT) dynamics. MTs fluorescently labeled with GFP-α-tubulin were treated with diacylglycerol (DAG)-lactone (a membrane-permeable PKC activator), or cotransfected with a pseudophosphorylated S165D-α6-tubulin mutant. Each condition increased the dynamicity of MTs by stimulating the rate and duration of the growth phase and decreasing the frequency of catastrophe. In MDA-MB-231 metastatic breast cells where the intrinsic PKC activity is high, these MT growth parameters were also high but could be suppressed by expression of phosphorylation-resistant S165N-α6-tubulin or by treatment with a pan-PKC inhibitor (bis-indoleylmaleimide). Subcellular fractionation and immunofluorescence of MCF-10A cells showed that phosphorylation (via DAG-lactone) or pseudophosphorylation of α6-tubulin increased its partitioning into MTs as compared to controls, and produced longer, more stable MTs. Following expression of the plus-end binding protein GFP-EB1, DAG-lactone accelerated the formation and increased the number of nascent MTs. Expression of S165D-α6-tubulin promoted Rac1 activation and Rac1-dependent cell motility. These findings call attention to PKC-mediated phosphorylation of α-tubulin as a novel mechanism for controlling the dynamics of MTs that result in cell movement.

Keywords: Rac1; live cell imaging; motility; mutant; partitioning.


Figures

FIGURE 1
FIGURE 1
Fluorescent live cell imaging of MT dynamics in MCF-10A cells expressing EGFP-α-tubulin. Transfectants were treated with either 10 μM DAG-lactone (DAG) or DMSO as vehicle control (0.05% v/v) for 1 h at 37°C and 5% CO2 prior to imaging (as described in the Methods) (A) Life history plots of three representative MTs in these cells treated with or without DAG-lactone. (B) Quantitation of life history plots of MTs show that treatment with 10 μM DAG-lactone (DAG) increases the dynamicity of MTs (n = 54) in these cells. Statistical significance was determined by the Student’s t-test (*, p<0.0001). (C) A representative cell expressing EGFP-α-tubulin shows that following DAG-lactone treatment, growing MTs reverse direction upon contact with the cell periphery (inset). All results are representative of three independent experiments. Scale bar, 10 μm.
FIGURE 2
FIGURE 2
Phosphorylation or pseudo-phosphorylation of α6-tubulin increases the percentage of the total time that MTs spend in the growth phase. Phosphorylation-site mutants of α6-tubulin impact the percentage time that MTs spent growing (positive values) and decrease the time spent shrinking (negative values) in non-motile MCF-10A (light and dark grey bars bars) and metastatic human breast MDA-MB-231 (black and stippled bars) cells. Cells were transfected with DsRed plasmids encoding the S165D or S165N mutants of α6-tubulin, or the empty DsRed vector control (VC), and their impact was determined by live-cell imaging, as described in ‘Methods’. Addition of 10 μM DAG-lactone (DAG) to MCF-10A cells or 10 μM BIM to MDA-MB-231 cells were compared with their respective vehicle control (DMSO, 0.05% v/v). The results are based on a total of 42–62 MTs examined for each condition divided by the total time MTs spent growing or shortening. Statistical significance was evaluated by the Student’s t-test whereby *, p<0.1; **, p<0.05; ***, p<0.01; and ****, p<0.0001.
FIGURE 3
FIGURE 3
Phosphorylation of α6-tubulin increases its partitioning into MTs (insoluble fraction). (A) Western blot showing the level of myc-tagged WT-α6-tubulin from MCF-10A cells treated with DAG-lactone (WT + DAG) or DMSO (WT), or α6-tubulin mutants isolated in insoluble (25 μg protein per lane) and soluble fractions (100 μg protein per lane). Each sample represented 25% of the fraction volume. Myc-tagged α6-tubulin proteins were detected with anti-myc and the total level of α-tubulin present in each set of samples was detected by Western blot with anti-α-tubulin, as described in ‘Methods’. β-actin levels served as the loading control for the soluble fraction. The results are representative of three independent experiments that gave similar results. (B) From Western blots, the distribution of myc-α6-tubulin signals between the insoluble (dark gray bars) and soluble (light gray bars) fractions were quantitated by Image J. The values are represented as a fractional distribution of the total myc signal calculated for insoluble and soluble preparations. The results are the average ± s.d. of three independent experiments (n=3). Statistical significance was evaluated by the Student’s t-test: *, p<0.05; **, p<0.005.
FIGURE 4
FIGURE 4
Immunofluorescence of MCF-10A cells expressing myc-tagged wildtype or mutant α6-tubulin. (A) Incorporation of myc-tagged WT α6-tubulin was compared in cells pretreated for 1 h with 10 μM DAG-lactone or DMSO (0.05% v/v), and in cells transfected with S165D or S165N α6-tubulin mutants. Following fixation with 4% paraformaldehyde, cells were stained with myc antibody to delineate each myc-tagged α6-tubulin (mutant or WT) (green) and counter-stained with α-tubulin antibody to display total α-tubulin (red). Scale bar, 10 μm. A small area (red box) is enlarged in the adjacent image. (B) Co-localization of myc-tagged tubulin with endogenous MTs in immunochemically stained MCF-10A cells were analyzed by Pearson’s index (rp) (‘Methods’). Results are the average of signal intensities from 20–24 cells for each condition from three independent experiments. (*, p<0.0001) (C) Quantitation of the number of myc-tagged signals at the cell periphery was performed with Image J in cells either transfected with the indicated mutant α6-tubulin, or transfected with WT and treated with or without DAG-lactone treatment. Each value was normalized to the WT (minus DAG-lactone) condition. To assess MT stability under these conditions, a similar measurement of myc signals was performed with cells treated with DMSO (dark grey bars) or 300 nM nocodazole (light grey bars) for 1 h, followed by fixation and staining, as described in (A). (*, p<0.0001)
FIGURE 5
FIGURE 5
Quantitation of MT growing ends with EB1-EGFP in MCF-10A cells. (A) Images of live cells depict the arrival of EB1-EGFP comets near the cell periphery following a 1 h treatment with 10 μM DAG-lactone or DMSO (0.05% v/v). (B) Quantitative analysis of EB1-EGFP signals per 100 μm2 area near the cell periphery following treatment with DAG-lactone (n = 1800 signals, 14 cells) or DMSO (n = 1112 signals, 16 cells). Scale bar, 10 μm. The results are represented as the average number of EB1 comets from three independent experiments. (*, p<0.0001) (C) After treating cells with 6.6 μM nocodazole followed by washout of the drug (see ‘Methods’), the appearance of EB1-EGFP comets bound to nascent MTs was measured after incubation with DAG-lactone (10 μM) or DMSO (0.05% v/v) for 0.5 min, followed by cell fixation and detection by fluorescence microscopy. (D) In cells treated with 10 μM DAG-lactone (dark grey bars) or DMSO (light grey bars), the number of nascent MTs in 18–55 cells treated with DAG-lactone for the indicated time interval was determined by fluorescence microscopy and the signals were quantified with Image J and numerically averaged. (*, p<0.0001; **, p<0.05)
FIGURE 6
FIGURE 6
Rac1 undergoes activation in cells expressing S165D-α6-tubulin. (A) Evidence of activated Rac1 in membrane ruffles of MCF-10A cells. Immunofluorescence of cells treated either with DMSO (0.05% v/v, control) or DAG-lactone (10 μM, 1h) was performed followed by fixation with 4% PFA and addition of anti-active Rac1 antibody (1:100). With DAG-lactone treatment, Rac1 localized to membrane ruffles (arrows). Scale bar, 10 μm. (B) Western blot analysis of the level of GTP-bound Rac1, Cdc42, or RhoA in response to S165D or S165N α6-tubulin mutants, or the vector control (VC). The immunoblot shows the results of pull-down assays with whole cell lysates (600 μg per sample), as described in ‘Methods’. The results are representative of three independent experiments. (C) Motility of MCF-10A transfectants expressing wildtype PKCα, S165D-α6-tubulin, or the empty vector (VC) was measured with or without the Rac1 inhibitor NSC23766 (75 μM) (in water). Measurements show the area occupied by the cells in triplicate samples after 8 h of treatment (‘Methods’). (*, p<0.0001) The results are representative of three independent experiments.
FIGURE 7
FIGURE 7
Model describing how PKC-mediated phosphorylation of α-tubulin impacts motility. Upon phosphorylation of α-tubulin (blue circles), elongating MTs promote the activation of Rac1 via a plus-end binding protein (EB1 or CLIP-170). Rac1 cycles between GTP-bound (active) and GDP-bound (inactive) states due to active GEFs and GAPs. A Rac1-specific inhibitor I (NSC23766) interferes in GEF-mediated GDP-GTP exchange thus blocking the formation of GTP-Rac which is required for driving downstream events that support motility.

Similar articles

Cited by

References

    1. Abeyweera TP, Rotenberg SA. Design and characterization of a traceable protein kinase Cα. Biochemistry. 2007;46:2364–2370. - PubMed
    1. Abeyweera TP, Chen X, Rotenberg SA. Phosphorylation of α6-tubulin by protein kinase Cα activates motility of human breast cells. J Biol Chem. 2009;284:17648–17656. - PMC - PubMed
    1. Banyard J, Anand-Apte B, Symons M, Zetter BR. Motility and invasion are differentially modulated by Rho family GTPases. Oncogene. 2000;19:580–591. - PubMed
    1. Bolte S, Cordelieres F. A guided tour into subcellular colocalization analysis in light microscopy. J Microscopy. 2006;224:213–232. - PubMed
    1. Chan A, Andreae PM, Northcote PT, Miller JH. Peloruside A inhibits microtubule dynamics in a breast cancer cell line MCF7. Invest New Drugs. 2011;29:615–626. - PubMed

Publication types

MeSH terms

Substances

LinkOut - more resources