. 2014 May;88(9):5122-37.
doi: 10.1128/JVI.00019-14. Epub 2014 Feb 26.

Heat shock protein 70 enhances mucosal immunity against human norovirus when coexpressed from a vesicular stomatitis virus vector

Affiliations

Heat shock protein 70 enhances mucosal immunity against human norovirus when coexpressed from a vesicular stomatitis virus vector

Yuanmei Ma et al. J Virol. 2014 May.

Abstract

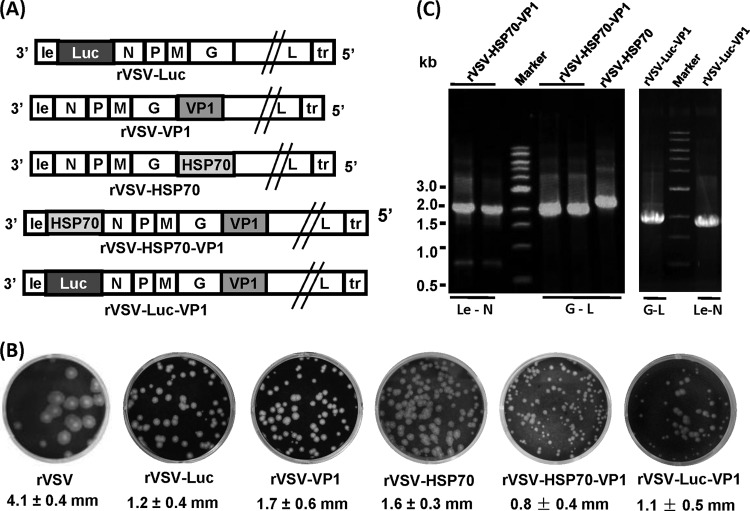
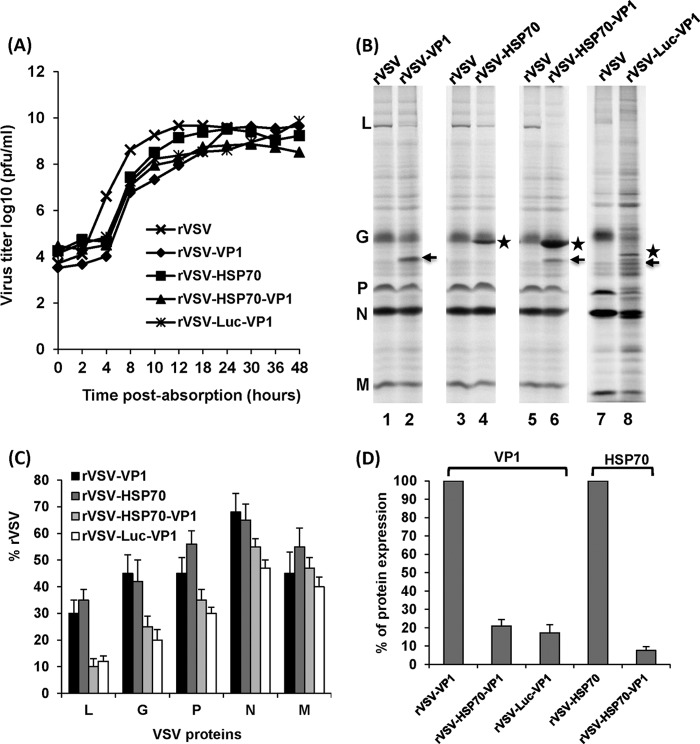
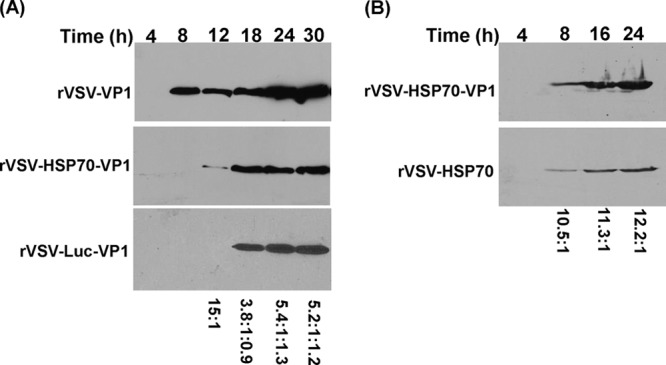
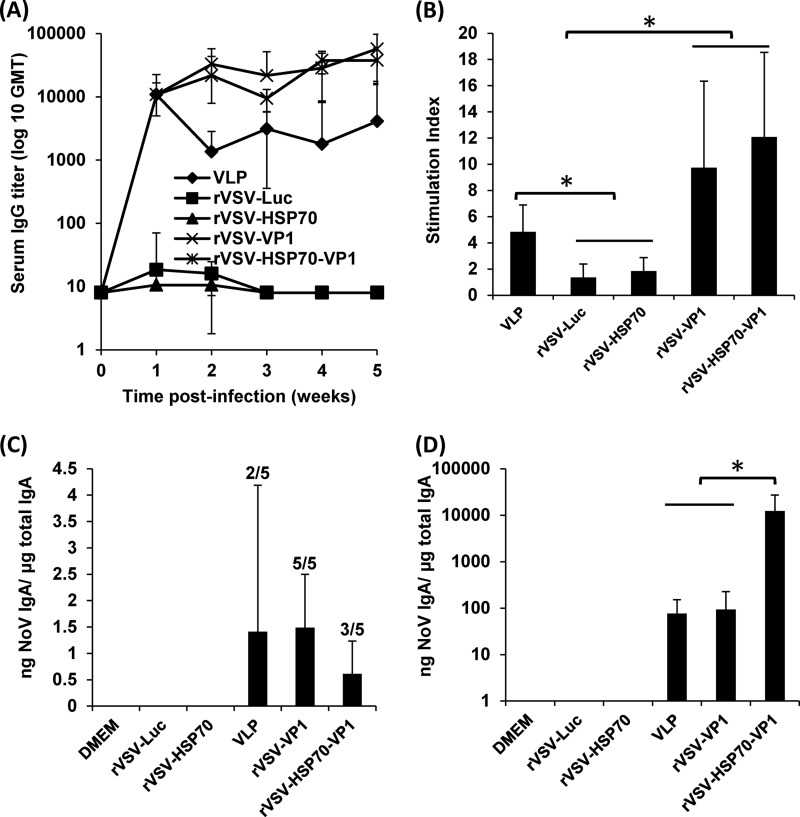
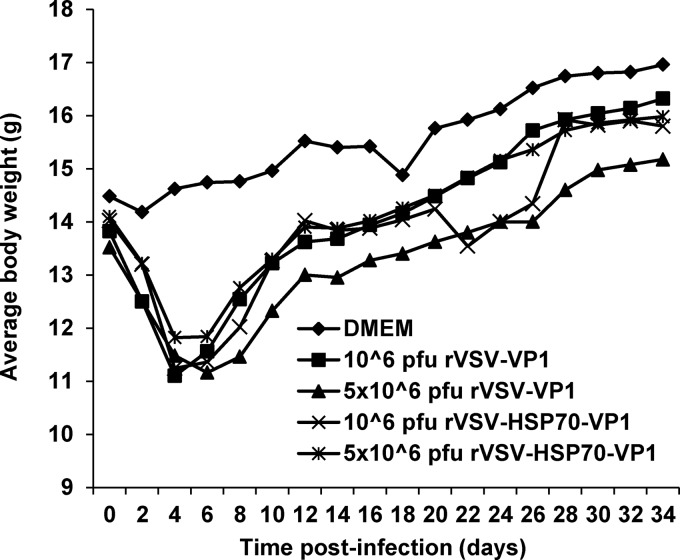
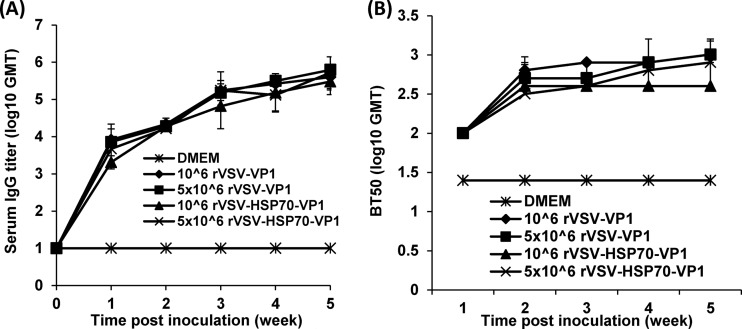
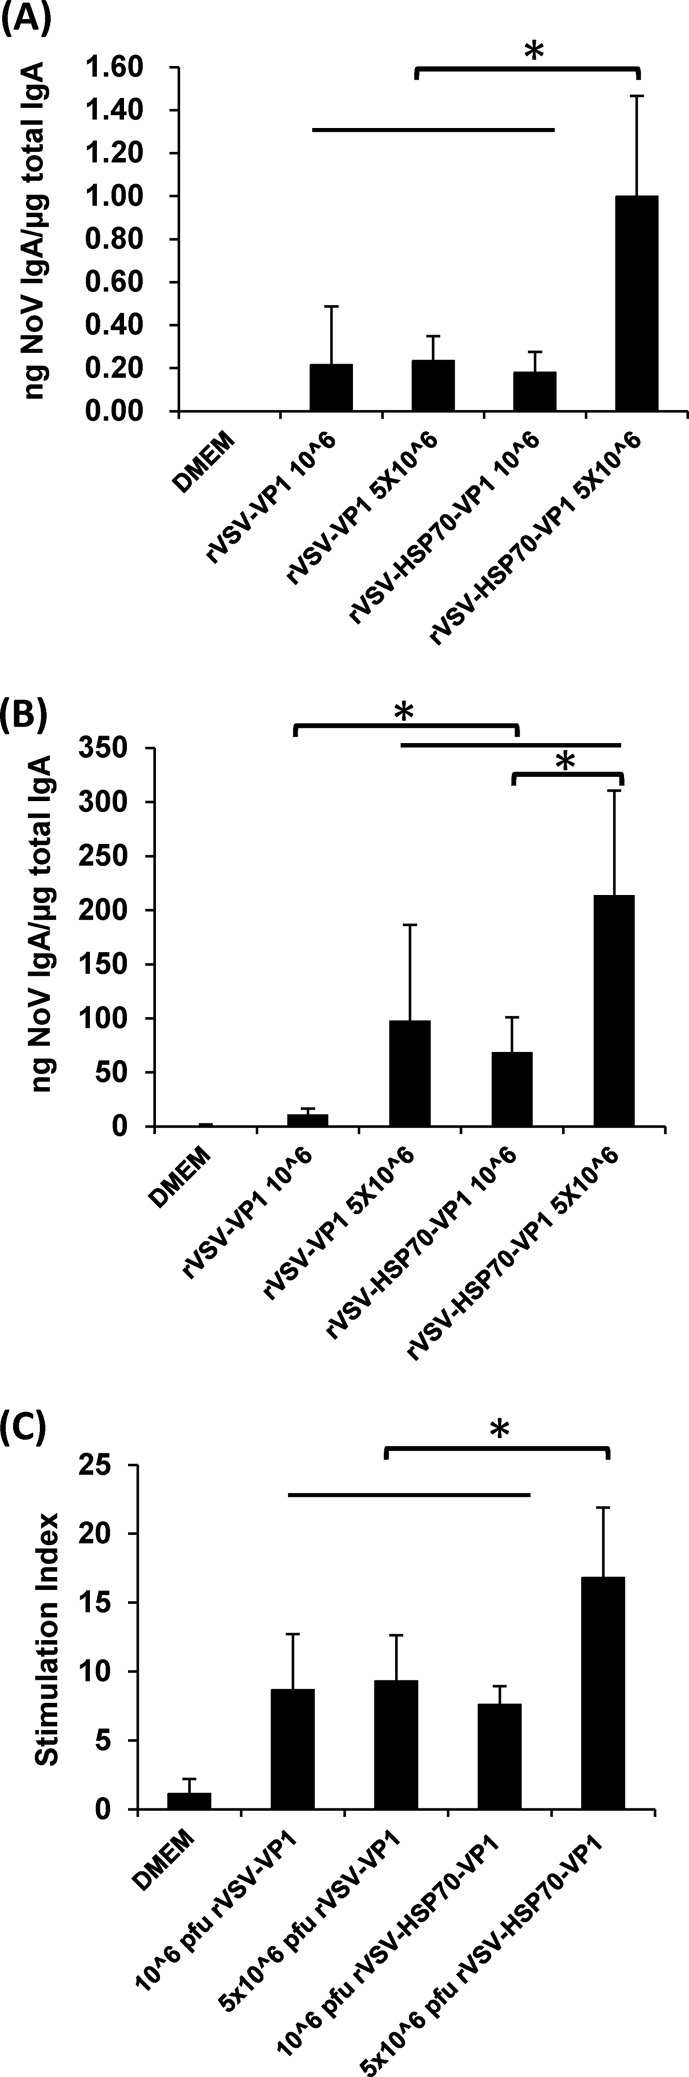
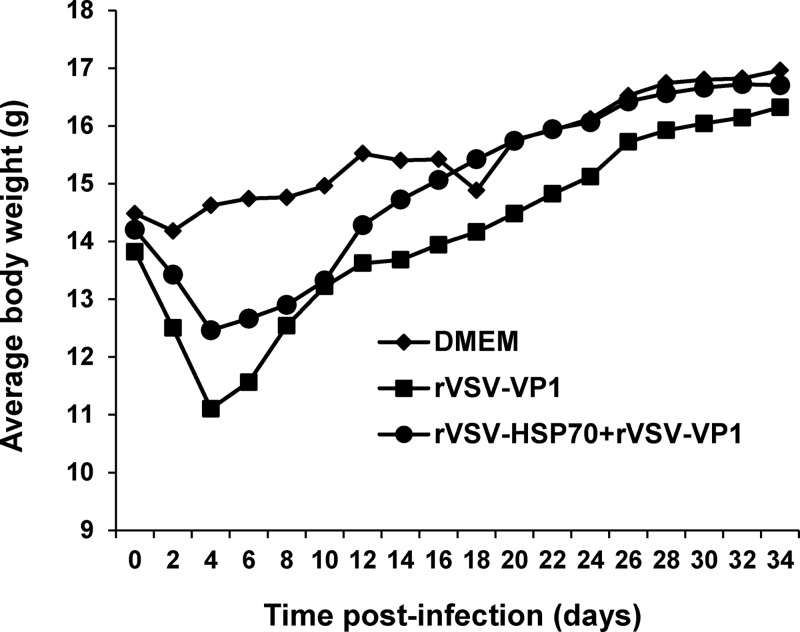
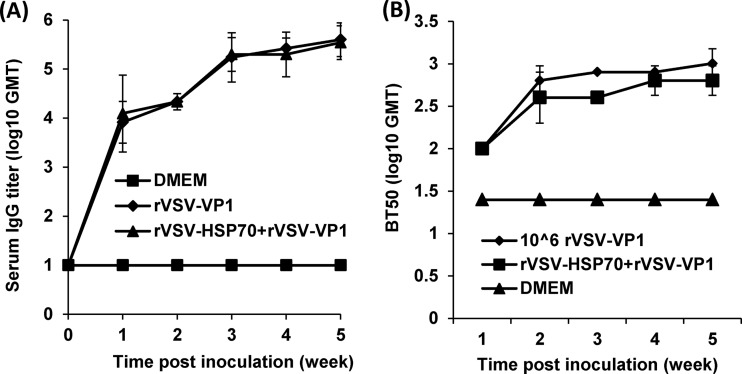
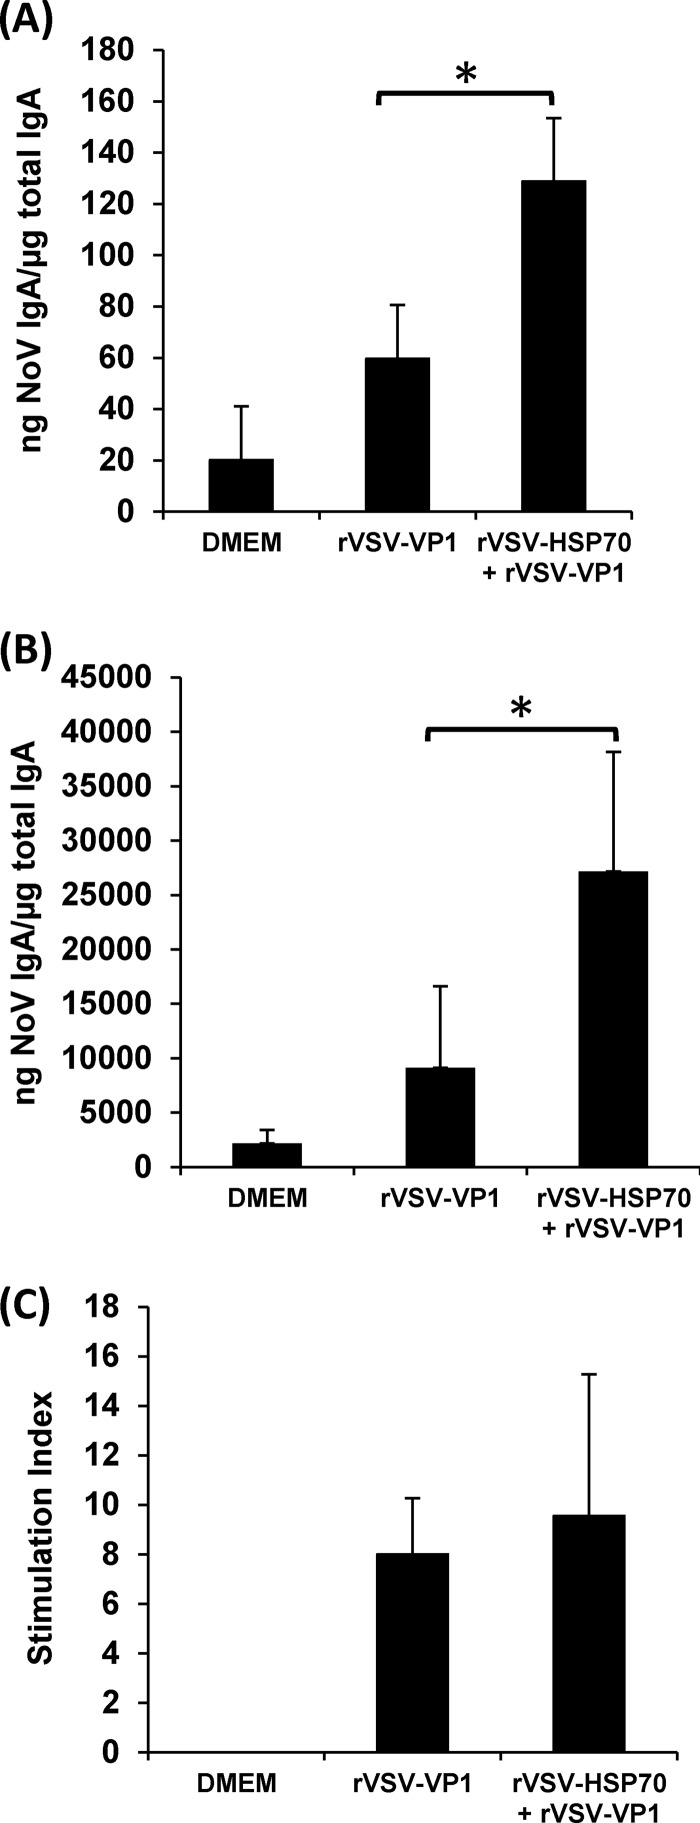
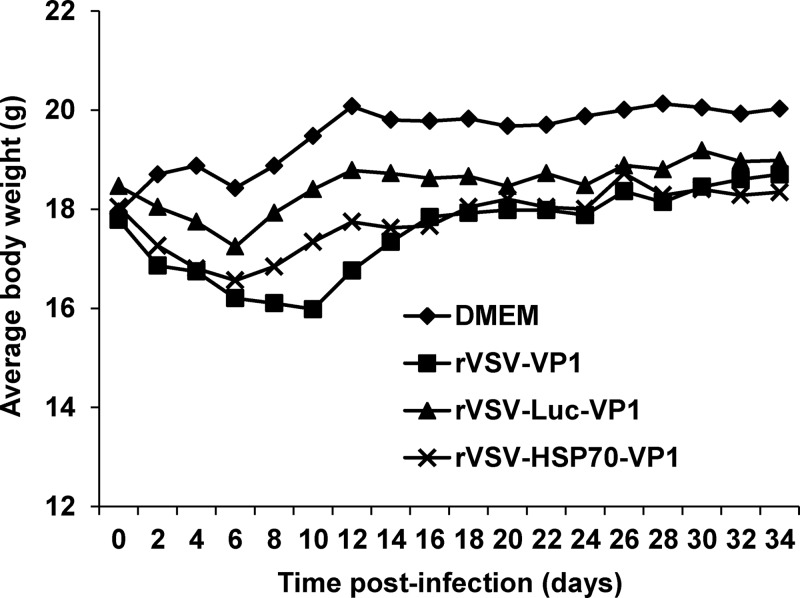
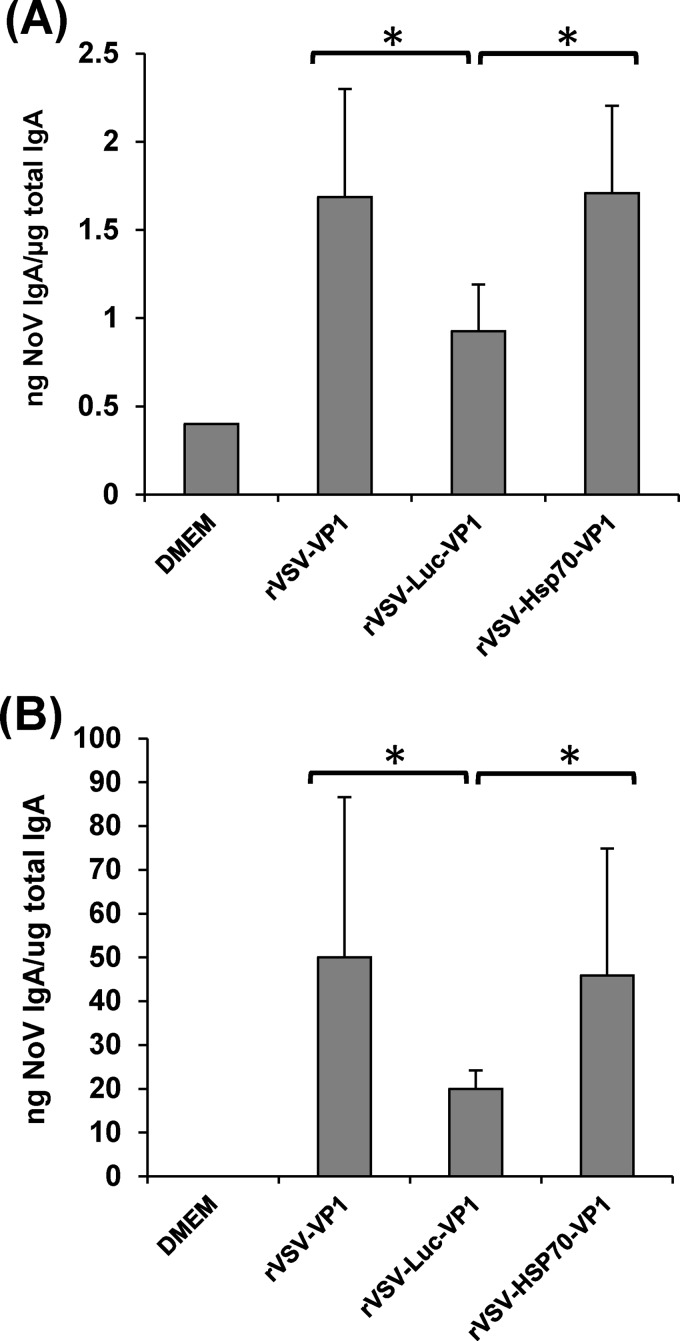
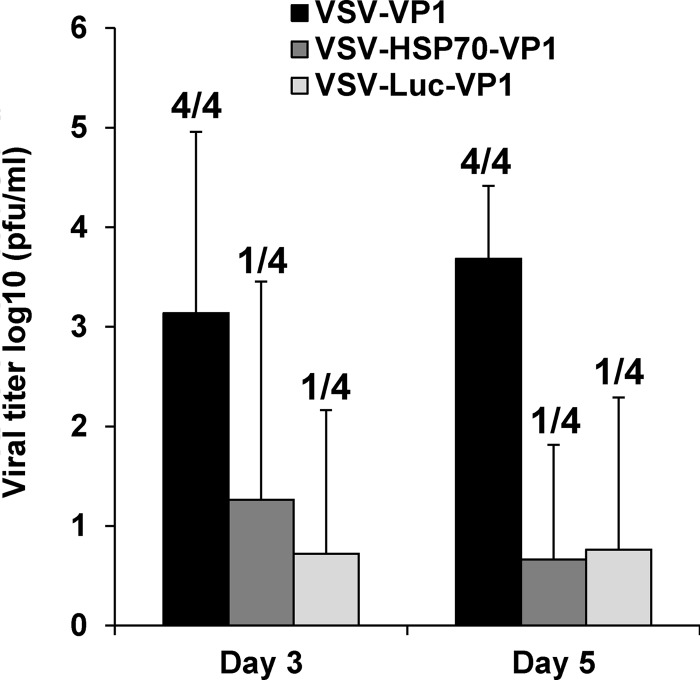
Human norovirus (NoV) accounts for 95% of nonbacterial gastroenteritis worldwide. Currently, there is no vaccine available to combat human NoV as it is not cultivable and lacks a small-animal model. Recently, we demonstrated that recombinant vesicular stomatitis virus (rVSV) expressing human NoV capsid protein (rVSV-VP1) induced strong immunities in mice (Y. Ma and J. Li, J. Virol. 85:2942-2952, 2011). To further improve the safety and efficacy of the vaccine candidate, heat shock protein 70 (HSP70) was inserted into the rVSV-VP1 backbone vector. A second construct was generated in which the firefly luciferase (Luc) gene was inserted in place of HSP70 as a control for the double insertion. The resultant recombinant viruses (rVSV-HSP70-VP1 and rVSV-Luc-VP1) were significantly more attenuated in cell culture and viral spread in mice than rVSV-VP1. At the inoculation dose of 1.0 × 10(6) PFU, rVSV-HSP70-VP1 triggered significantly higher vaginal IgA than rVSV-VP1 and significantly higher fecal and vaginal IgA responses than rVSV-Luc-VP1, although serum IgG and T cell responses were similar. At the inoculation dose of 5.0 × 10(6) PFU, rVSV-HSP70-VP1 stimulated significantly higher T cell, fecal, and vaginal IgA responses than rVSV-VP1. Fecal and vaginal IgA responses were also significantly increased when combined vaccination of rVSV-VP1 and rVSV-HSP70 was used. Collectively, these data indicate that (i) insertion of an additional gene (HSP70 or Luc) into the rVSV-VP1 backbone further attenuates the VSV-based vaccine in vitro and in vivo, thus improving the safety of the vaccine candidate, and (ii) HSP70 enhances the human NoV-specific mucosal and T cell immunities triggered by a VSV-based human NoV vaccine.

Importance: Human norovirus (NoV) is responsible for more than 95% of acute nonbacterial gastroenteritis worldwide. Currently, there is no vaccine for this virus. Development of a live attenuated vaccine for human NoV has not been possible because it is uncultivable. Thus, a live vector-based vaccine may provide an alternative vaccine strategy. In this study, we developed a vesicular stomatitis virus (VSV)-based human NoV vaccine candidate. We constructed rVSV-HSP70-VP1, coexpressing heat shock protein (HSP70) and capsid (VP1) genes of human NoV, and rVSV-Luc-VP1, coexpressing firefly luciferase (Luc) and VP1 genes. We found that VSVs with a double gene insertion were significantly more attenuated than VSV with a single VP1 insertion (rVSV-VP1). Furthermore, we found that coexpression or coadministration of HSP70 from VSV vector significantly enhanced human NoV-specific mucosal immunity. Collectively, we developed an improved live vectored vaccine candidate for human NoV which will be useful for future clinical studies.


Figures

FIG 1
FIG 1
Recovery of rVSV-HSP70-VP1, rVSV-HSP70, and rVSV-Luc-VP1. (A) Construction of plasmids. For rVSV-VP1 and rVSV-HSP70, VP1 and HSP70 were inserted at the G-L gene junction in their respective VSV genomes. For rVSV-HSP70-VP1, the HSP70 and VP1 genes were inserted at gene junctions between leader and N and between G and L, respectively. For rVSV-Luc-VP1, the luciferase and VP1 genes were inserted at gene junctions between leader and N and between G and L, respectively. le, VSV leader sequence; N, nucleocapsid gene; P, phosphoprotein gene; M, matrix protein gene; G, glycoprotein gene; L, large polymerase gene; tr, VSV trailer sequence. (B) Plaque diameter of recombinant viruses. Plaques of rVSV-VP1, rVSV-HSP70, rVSV-HSP70-VP1, and rVSV-Luc-VP1 were developed after 48 h of incubation compared to rVSV, which was developed after 24 h of incubation. An average size of 20 plaques for each recombinant virus is shown. (C) Amplification of the inserted genes from recombinant viruses by RT-PCR. Genomic RNA was extracted from each virus. The VP1 gene was amplified by RT-PCR using two primers annealing to the G and L genes. The HSP70 gene was amplified from rVSV-HSP70 using the two primers annealing to the G and L genes. The HSP70 or Luc gene was amplified from rVSV-HSP70-VP1 or rVSV-Luc-VP1 using two primers annealing to the leader and N sequences.
FIG 2
FIG 2
Growth and protein synthesis of recombinant VSVs in BSRT7 cells. (A) Single-step growth curve of recombinant VSVs. Confluent BSRT7 cells were infected with individual virus at an MOI of 10. Samples of supernatant were harvested at the indicated intervals over a 48-h time period, and the virus titer was determined by plaque assay. Titers represent the averages of the results of three independent single-step growth experiments. (B) Expression of VP1 and HSP70 by rVSV-VP1, rVSV-HSP70, and rVSV-HSP70-VP1. BSRT-7 cells were infected with each recombinant virus at an MOI of 10. Proteins were metabolically labeled by incorporation of [35S]methionine-cysteine in the presence of actinomycin D. Cytoplasmic extracts were harvested at 5 h postinfection, and proteins were analyzed by SDS-PAGE and detected using a phosphorimager. Arrows denote VP1 protein, and stars denote HSP70 or Luc protein. (C) The level of VSV structural protein expression for recombinant viruses relative to parental rVSV. Data were generated in three independent experiments. For each protein, the mean ± the standard deviation is shown as a percentage of that observed for rVSV. (D) The level of VP1 or HSP70 protein synthesized by recombinant VSVs. The VP1 synthesized by rVSV-VP1, rVSV-HSP70-VP1, and rVSV-Luc-VP1 and the HSP70 synthesized by rVSV-HSP70 and rVSV-HSP70-VP1 were quantified. Data were generated in three independent experiments.
FIG 3
FIG 3
Kinetics of VP1 and HSP70 expression in virus-infected cells. (A) Kinetics of VP1 protein expression. BSRT-7 cells were infected with rVSV-VP1, rVSV-HSP70-VP1, or rVSV-Luc-VP1 at an MOI of 10. Cytoplasmic extracts were harvested at indicated time points. Equal amounts of total cytoplasmic lysate were analyzed by SDS-PAGE, followed by Western blotting using guinea pig anti-human NoV VP1 antiserum. The ratio of VP1 produced by rVSV-VP1, rVSV-HSP70-VP1, or rVSV-Luc-VP1 is shown in the bottom. A representative blot is shown. (B) Kinetics of HSP70 expression. BSRT-7 cells were infected with rVSV-HSP70 or rVSV-HSP70-VP1 at an MOI of 10. Cytoplasmic extracts were harvested at indicated time points. Equal amounts of total cytoplasmic lysate were analyzed by SDS-PAGE, followed by Western blotting using mouse anti-HSP70 antibody. The ratio of HSP70 produced by rVSV-HSP70-VP1 and rVSV-HSP70 is shown in the bottom. A representative blot is shown.
FIG 4
FIG 4
Dynamics of mouse body weight after inoculation with recombinant viruses. Five BALB/c mice in each group were inoculated with 106 PFU of rVSV-Luc, rVSV-VP1, rVSV-HSP70, or rVSV-HSP70-VP1 or with 100 μg of VLPs (purified from insect cells expressed by baculovirus) through the combination of intranasal and oral routes. Body weight for each mouse was evaluated every other day for 5 weeks. The average body weight of five mice is shown.
FIG 5
FIG 5
Immune responses induced by VSV-based human NoV vaccines. (A) Serum IgG immune responses. Groups of five BALB/c mice were inoculated with either 106 PFU of rVSV-VP1 or rVSV-HSP70-VP1 or 100 μg of VLPs through the combination of intranasal and oral routes. Serum samples were collected weekly and analyzed by ELISA using human NoV-specific serum IgG antibody. Data are expressed as geometric mean titers (GMT) determined for five mice. Error bars at each time point represent the standard deviations between the results determined for the mice. (B) T cell proliferative responses. Spleen cells were harvested from all mice in each group at week 5 postinoculation and were stimulated with human NoV VLPs. T cell proliferation was measured by [3H]thymidine incorporation. The stimulation index (SI) was calculated as the mean of the following ratio: proliferation of human NoV VLP-stimulated cells/proliferation of cells in medium in cpm. Data are expressed as the means of the results from five mice ± the standard deviations. Asterisks indicate statistical significance (P < 0.05). (C) Fecal IgA responses. Fecal samples were collected from all mice at week 5 postinoculation. Samples were diluted in PBS, mixed using a vortex device, and clarified by centrifugation. Human NoV-specific antibody and total IgA antibody levels were detected by ELISA. The ratio between human NoV-specific IgA and total IgA was calculated for each mouse. Data are expressed as average titers from all mice ± standard deviations. Numbers of IgA-positive mice are indicated above the error bars. (D) Vaginal IgA responses. Vaginal samples were collected at week 5 postinoculation from each mouse, and human NoV-specific and total IgA antibody levels were determined by ELISA. The level of vaginal IgA is shown as the ratio between human NoV-specific IgA and total IgA. Data are expressed as the average titer for all mice ± standard deviations.
FIG 6
FIG 6
Dynamics of mouse body weight after inoculation with recombinant viruses. Five BALB/c mice in each group were inoculated with 106 PFU of rVSV-VP1, 106 PFU of rVSV-HSP70-VP1, 5 × 10⁶ PFU of rVSV-VP1, or 5 × 10⁶ PFU of rVSV-HSP70-VP1. Body weight for each mouse was measured every other day for 5 weeks. The average body weight of five mice per group is shown.
FIG 7
FIG 7
The effects of immunization doses on serum IgG immune response triggered by VSV-based human NoV vaccine. (A) Serum IgG antibody responses. Groups of five BALB/c mice were inoculated with 106 PFU of rVSV-VP1, 106 PFU of rVSV-HSP70-VP1, 5 × 10⁶ PFU of rVSV-VP1, or 5 × 10⁶ PFU of rVSV-HSP70-VP1. Serum samples were collected weekly and analyzed by ELISA using human NoV-specific serum IgG antibody. Data are expressed as geometric mean titers (GMT) determined for five mice. Error bars at each time point represent the standard deviations of the results of the comparisons between mice. (B) Serum HBGA blocking antibody. The ability of serum antibodies to inhibit human NoV VLP binding to HBGAs, the functional receptor of human NoV, was measured by an ELISA as described in Materials and Methods. The 50% blocking titer (BT50), defined as the titer at which the OD value (after subtraction of the blank) was 50% of the OD of the positive control, was determined for each sample. Error bars at each time point represent the standard deviations of the results of the comparisons between mice.
FIG 8
FIG 8
The effects of immunization doses on mucosal and T cell immune responses triggered by VSV-based human NoV vaccine. (A) Fecal IgA responses. Fecal samples were collected from all mice at week 5 postinoculation. Human NoV-specific and total IgA antibody levels were determined by ELISA. The ratio between human NoV-specific IgA and total IgA was calculated for each mouse. Data are expressed as average titers of IgA-positive mice ± standard deviations. (B) Vaginal IgA responses. Vaginal samples were collected at week 5 postinoculation from each mouse, and human NoV-specific and total IgA antibody levels were determined by ELISA. The level of vaginal IgA is shown as log 10 (ratio between human NoV-specific IgA and total IgA). Data are expressed as average titers of IgA-positive mice ± standard deviations. (C) T cell proliferative responses. Spleen cells were harvested from all mice in each group at week 5 postinoculation and stimulated with human NoV VLPs. T cell proliferation was measured by [3H]thymidine incorporation. The stimulation index (SI) was calculated as the mean of the following ratio: proliferation of human NoV VLP-stimulated cells/proliferation of cells in medium in cpm. Data are expressed as the means of the results determined for five mice ± the standard deviations. Asterisks indicate statistical significance (P < 0.05).
FIG 9
FIG 9
Dynamics of mouse body weight after inoculation with recombinant viruses for animal study 3. Five BALB/c mice in each group were inoculated with either 106 PFU of rVSV-VP1 or the combination of 106 PFU of rVSV-VP1 and 106 PFU of rVSV-HSP70. Body weight for each mouse was evaluated every other day for 5 weeks. The average body weight of five mice per group is shown.
FIG 10
FIG 10
The effects of coimmunization on serum IgG response triggered by VSV-based human NoV vaccines. (A) Serum IgG antibody response. Groups of five BALB/c mice were inoculated with either 106 PFU of rVSV-VP1 or the combination of 106 PFU of rVSV-VP1 and 106 PFU of rVSV-HSP70. Serum samples were collected weekly and analyzed by ELISA using human NoV-specific serum IgG antibody. Data are expressed as geometric mean titers (GMT) of five mice per group. Error bars at each time point represent the standard deviations of the means. (B) Serum HBGA blocking antibody. The ability of serum antibodies to inhibit human NoV VLP binding to HBGAs was measured by an ELISA as described in Materials and Methods. The 50% blocking titer (BT50) was determined for each sample. Data are expressed as means ± standard deviations for each treatment group at the indicated time point.
FIG 11
FIG 11
The effects of coimmunization on mucosal and T cell responses triggered by VSV-based human NoV vaccines. (A) Fecal IgA responses. Fecal samples were collected from all mice at week 5 postinoculation. Human NoV-specific and total IgA antibody levels were detected by ELISA. The ratio between human NoV-specific IgA and total IgA was calculated for each mouse. Data are expressed as average titers of IgA-positive mice ± standard deviations. (B) Vaginal IgA responses. Vaginal samples were collected at week 5 postinoculation from each mouse, and human NoV-specific and total IgA antibody levels were determined by ELISA. The level of vaginal IgA is shown as the ratio between human NoV-specific IgA and total IgA. Data are expressed as average titers of IgA-positive mice ± standard deviations. (C) T cell proliferative responses. Spleen cells were harvested from all mice in each group at week 5 postinoculation and stimulated with human NoV VLPs. T cell proliferation was measured by [3H]thymidine incorporation. The stimulation index (SI) was calculated as the mean of the following ratio: proliferation of human NoV VLP-stimulated cells/proliferation of cells in medium in cpm. Data are expressed as the means of the results determined for five mice ± the standard deviations. Asterisks indicate statistical significance (P < 0.05).
FIG 12
FIG 12
Dynamics of mouse body weight after inoculation with recombinant viruses containing single versus double insertions. Five BALB/c mice in each group were inoculated with 106 PFU of rVSV-VP1, rVSV-HSP70-VP1, or rVSV-Luc-VP1. Body weight for each mouse was evaluated every other day for 5 weeks. The average body weight of five mice per group is shown.
FIG 13
FIG 13
Recombinant rVSV-HSP70-VP1 triggered significantly higher fecal and vaginal IgA levels than rVSV-Luc-VP1. (A) Fecal IgA responses. Fecal samples were collected from all mice at week 5 postinoculation. Human NoV-specific and total IgA antibody levels were detected by ELISA. Data are expressed as the means of the results determined for five mice ± the standard deviations. (B) Vaginal IgA responses. Vaginal samples were collected at week 5 postinoculation from each mouse, and human NoV-specific and total IgA antibody levels were determined by ELISA. Data are expressed as the means of the results determined for five mice ± the standard deviations. Asterisks indicate statistical significance (P < 0.05).
FIG 14
FIG 14
Spread of recombinant virus in brains of mice. Mice were inoculated intranasally with 106 PFU of rVSV-VP1, rVSV-HSP70-VP1, or rVSV-Luc-VP1. At days 3 and 5 postinoculation, 4 mice from each group were euthanized. The brain from each mouse was collected for virus titration by plaque assay. Data are expressed as the mean viral titers of four mice ± the standard deviations. Numbers of virus-positive mice for each group are indicated.

Similar articles

Cited by

References

    1. Farkas T, Sestak K, Wei C, Jiang X. 2008. Characterization of a rhesus monkey calicivirus representing a new genus of Caliciviridae. J. Virol. 82:5408–5416. 10.1128/JVI.00070-08 - DOI - PMC - PubMed
    1. Duizer E, Schwab KJ, Neill FH, Atmar RL, Koopmans MPG, Estes MK. 2004. Laboratory efforts to cultivate noroviruses. J. Gen. Virol. 85:79–87. 10.1099/vir.0.19478-0 - DOI - PubMed
    1. Donaldson EF, Lindesmith LC, Lobue AD, Baric RS. 2008. Norovirus pathogenesis: mechanisms of persistence and immune evasion in human populations. Immunol. Rev. 225:190–211. 10.1111/j.1600-065X.2008.00680.x - DOI - PubMed
    1. Estes MK, Prasad BV, Atmar RL. 2006. Noroviruses everywhere: has something changed? Curr. Opin. Infect. Dis. 19:467–474. 10.1097/01.qco.0000244053.69253.3d - DOI - PubMed
    1. Koopmans M. 2008. Progress in understanding norovirus epidemiology. Curr. Opin. Infect. Dis. 21:544–552. 10.1097/QCO.0b013e3283108965 - DOI - PubMed

Publication types

MeSH terms