. 2014 May;88(10):5263-76.
doi: 10.1128/JVI.03688-13. Epub 2014 Feb 26.

Complementary induction of immunogenic cell death by oncolytic parvovirus H-1PV and gemcitabine in pancreatic cancer

Affiliations

Complementary induction of immunogenic cell death by oncolytic parvovirus H-1PV and gemcitabine in pancreatic cancer

Assia L Angelova et al. J Virol. 2014 May.

Abstract

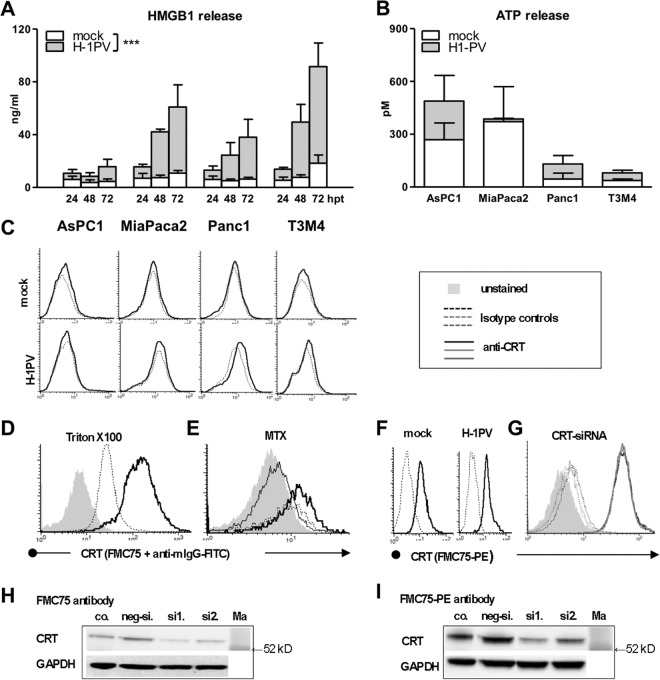
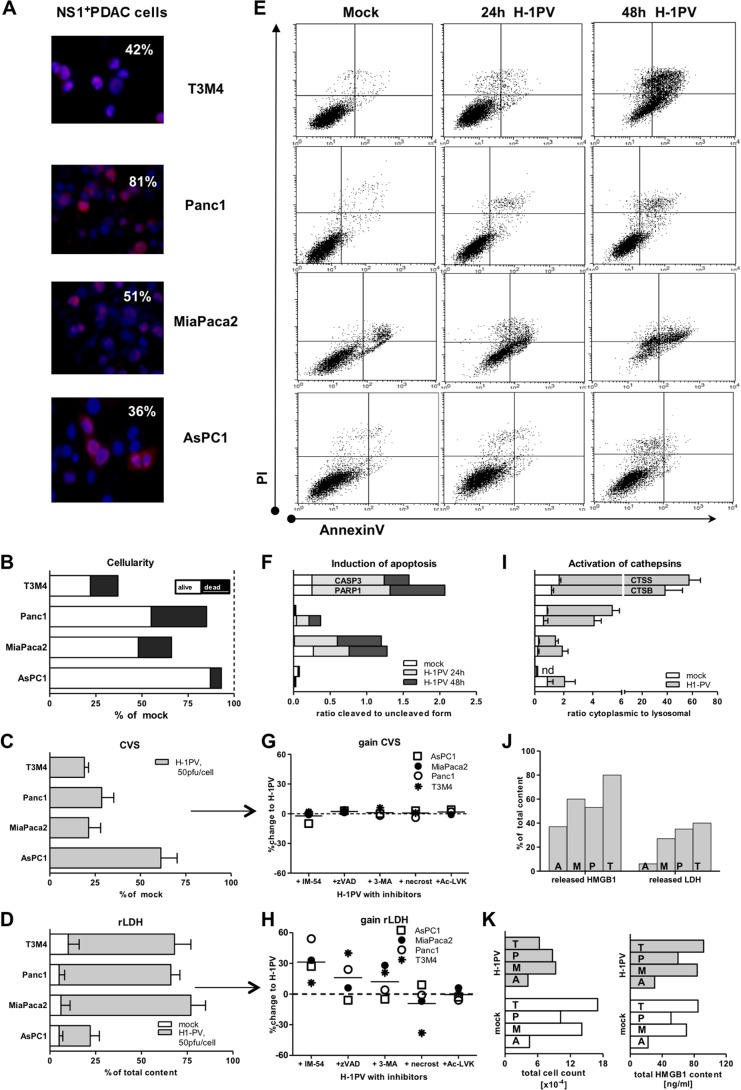
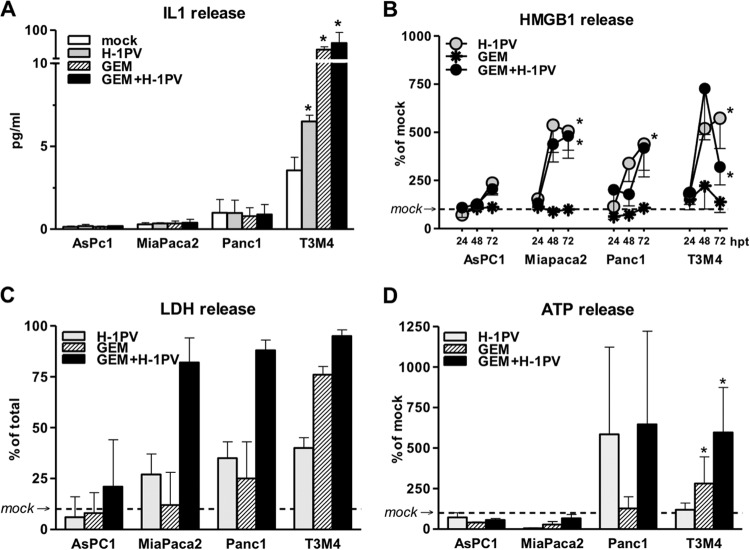
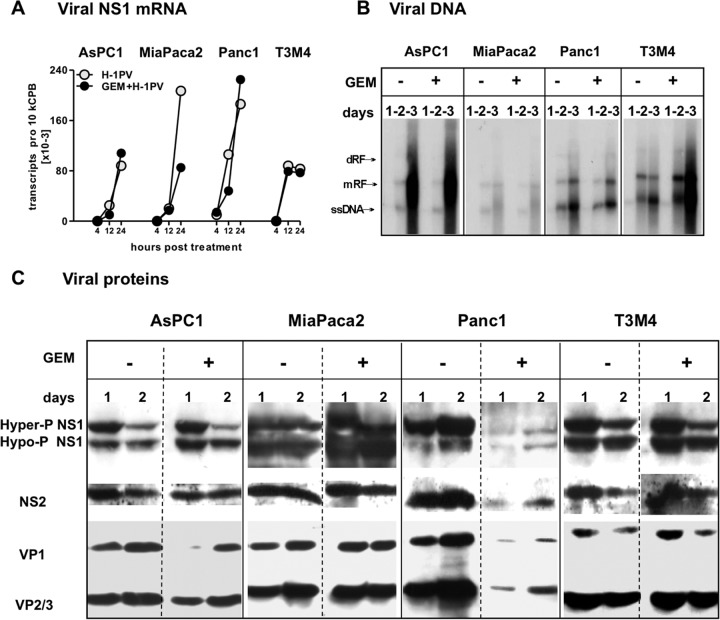
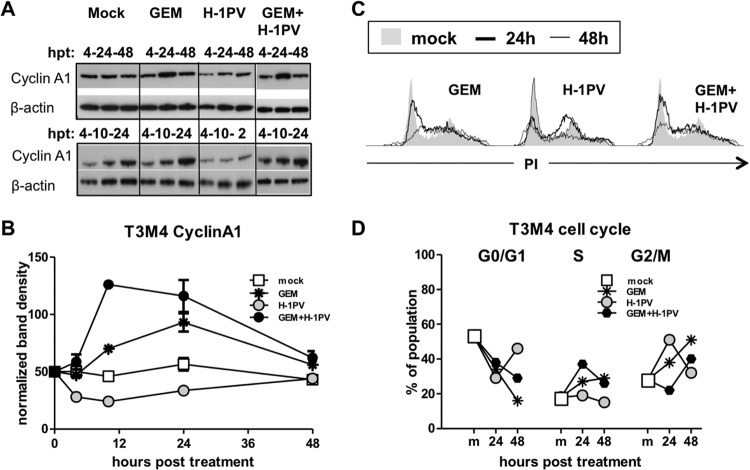
Novel therapies employing oncolytic viruses have emerged as promising anticancer modalities. The cure of particularly aggressive malignancies requires induction of immunogenic cell death (ICD), coupling oncolysis with immune responses via calreticulin, ATP, and high-mobility group box protein B1 (HMGB1) release from dying tumor cells. The present study shows that in human pancreatic cancer cells (pancreatic ductal adenocarcinoma [PDAC] cells n=4), oncolytic parvovirus H-1 (H-1PV) activated multiple interconnected death pathways but failed to induce calreticulin exposure or ATP release. In contrast, H-1PV elevated extracellular HMGB1 levels by 4.0±0.5 times (58%±9% of total content; up to 100 ng/ml) in all infected cultures, whether nondying, necrotic, or apoptotic. An alternative secretory route allowed H-1PV to overcome the failure of gemcitabine to trigger HMGB1 release, without impeding cytotoxicity or other ICD activities of the standard PDAC medication. Such broad resistance of H-1PV-induced HMGB1 release to apoptotic blockage coincided with but was uncoupled from an autocrine interleukin-1β (IL-1β) loop. That and the pattern of viral determinants maintained in gemcitabine-treated cells suggested the activation of an inflammasome/caspase 1 (CASP1) platform alongside DNA detachment and/or nuclear exclusion of HMGB1 during early stages of the viral life cycle. We concluded that H-1PV infection of PDAC cells is signaled through secretion of the alarmin HMGB1 and, besides its own oncolytic effect, might convert drug-induced apoptosis into an ICD process. A transient arrest of cells in the cyclin A1-rich S phase would suffice to support compatibility of proliferation-dependent H-1PV with cytotoxic regimens. These properties warrant incorporation of the oncolytic virus H-1PV, which is not pathogenic in humans, into multimodal anticancer treatments.

Importance: The current therapeutic concepts targeting aggressive malignancies require an induction of immunogenic cell death characterized by exposure of calreticulin (CRT) as well as release of ATP and HMGB1 from dying cells. In pancreatic tumor cells (PDAC cells) infected with the oncolytic parvovirus H-1PV, only HMGB1 was released by all infected cells, whether nondying, necrotic, or succumbing to one of the programmed death pathways, including contraproductive apoptosis. Our data suggest that active secretion of HMGB1 from PDAC cells is a sentinel reaction emerging during early stages of the viral life cycle, irrespective of cell death, that is compatible with and complements cytotoxic regimens. Consistent induction of HMGB1 secretion raised the possibility that this reaction might be a general "alarming" phenomenon characteristic of H-1PV's interaction with the host cell; release of IL-1β points to the possible involvement of a danger-sensing inflammasome platform. Both provide a basis for further virus-oriented studies.


Figures

FIG 1
FIG 1
Selective induction of HMGB1 but not CRT or ATP response by oncolytic parvovirus H-1PV in PDAC cells. The pancreatic cancer cell lines AsPC1, MiaPaca2, Panc1, and T3M4 were treated with H-1PV at an MOI of 10 PFU/cell. Cells and supernatants were harvested between 0 and 72 hpt. (A) H-1PV triggered extracellular HMGB1 accumulation as determined by ELISA analysis of supernatants (significant difference between mock- and virus-infected cultures as determined by two-way ANOVA; ***, P < 0.001). H-1PV failed to trigger ATP release (ELISA analysis of supernatants at 48 h) (B) and calreticulin exposure (FACS analyses of the cells at 24 h) (dotted lines depict staining with an isotype IgG control, and bold black lines depict staining with anti-CRT antibody) (C). Data shown were obtained with a mouse monoclonal anti-human CRT antibody (clone FMC75) and a subsequently added goat anti-mouse IgG–FITC conjugate. (D to I) A set of confirmatory experiments demonstrated the ability of anti-CRT antibody to detect intracellular CRT in Triton X-100-treated cells (Panc1 cells) (D) and surficial CRT in mitoxantrone (MTX)-treated cells (MiaPaca2 cells; bold black line in comparison to dotted line depicting MTX isotype control and to thin black line depicting overlapping isotype IgG and CRT staining in nontreated cells) (E). The inability of H-1PV to induce CRT exposure was demonstrated by a panel of five antibodies, although one antibody, a directly labeled FMC75 conjugate (ab22683; Abcam), suggested constitutive positivity of MiaPaca2 (F) and T3M4 (not shown) cells, which, however, were not susceptible to siRNA-based CRT knockdown (G). The histograms for siRNA-silenced cells (negative siRNA [neg-si.] and CRT siRNA sets 1 and 2 [si1. and si2.]) are shown as dotted lines for staining with isotype IgG control and as bold lines for staining with anti-CRT antibody. Although Western blot analysis of CRT knockdowns confirmed CRT binding of all antibodies, including the unlabeled FMC75 clone (H) and the FMC75-PE conjugate (I), retention of the CRT-FACS profile suggested additional off-target activity of the latter. co., control; Ma, marker.
FIG 2
FIG 2
H-1PV-induced PDAC cell death. (A) Infectivity of PDAC cells as determined by immunofluorescence using antibodies targeting the viral nonstructural protein NS1 upon exposure of PDAC cells to H-1PV at an MOI of 10 PFU/cell for 48 h (magnification, ×40). (B) Assessment of cytoreduction at an MOI of 10 PFU/cell by means of crystal violet staining of viable cells (CVS; % of mock) and colorimetric analysis of released LDH as a measure of death (oncolysis). The degree of lysis in the infected cultures was determined by calculating the ratio between released and total (whole Triton X-100-treated cultures) LDH content (rLDH). Subsequent combination of CVS (alive) and LDH (dead) levels allowed us to estimate the total cellularity of each infected culture in relation to the mock setups. (C and D) Cytoreduction (C) and lysis (D) at an MOI of 50 PFU/cell. (E) Compromised membrane integrity (apoptotic and necrotic events) as determined by means of annexin V- and PI-based flow cytometry. The dot blots depict profiles recorded at 24 h for mock infection and at 24 to 48 hpt for H-1PV infection at an MOI of 10 PFU/cell. (F) Molecular markers of apoptosis as assessed by Western blotting of whole-cell lysates, mock or H-1PV treated (10 PFU/cell), using PARP1 and CASP3 antibodies, with results normalized to β-actin levels upon densitometric analyses of images by use of ImageJ software. Data show the ratios between cleaved and uncleaved isoforms. (G and H) Infected PDAC cells (50 PFU/cell) were treated simultaneously with a panel of cell death pathway inhibitors: the oxidative stress inhibitor IM-54, the apoptosis inhibitor Z-VAD-FMK, the autophagy inhibitor 3-MA, the necroptosis inhibitor necrostatin-1, and the cathepsin B inhibitor Ac-LVK-CHO (see Table 1 for details). The data points indicate gain or loss of survival (CVS) and lysis (LDH) between noninhibited H-1PV-infected cultures (as in panels C and D) and inhibited cultures (mean change of value [%]). (I) PDAC cells were infected at an MOI of 10 PFU/cell. At 48 hpt, cells were harvested and samples were subjected to subcellular fractionation. The activities of CTSB and CTSS were determined for cytosolic and crude lysosomal fractions. The ratios between the cytosolic and crude lysosomal values were calculated for mock- and H-1PV-infected cells. nd, not determined. (J) Measurements of released HMGB1 and released LDH differently estimated the degree of oncolysis in infected cultures. (K) The correlation between cellularity and HMGB1 content was observed in mock- but not H-1PV-infected cultures. T, T3M4 cells; P, Panc1 cells; M, MiaPaca2 cells; A, AsPC1 cells.
FIG 3
FIG 3
Complementary induction of ICD by gemcitabine (GEM) and H-1PV in PDAC cells. PDAC cultures were treated with H-1PV at an MOI of 10 PFU/cell, with or without previous exposure to GEM for 12 h, at doses ranging from IC50 to 100× IC50 or 40 ng/ml. The supernatants were harvested between 24 and 72 hpt. (A) Selective secretion of IL-1β in T3M4 cells as determined by commercial ELISA at 48 hpt. (B) Kinetics of HMGB1 released into supernatants. The measurements are presented as percentages of levels detected in mock-infected cultures at each time point (see Fig. 1A for actual levels). (C) Levels of oncolysis in H-1PV-treated cells exposed to 40 ng/ml GEM as detected by LDH release assay at 72 hpt. (D) Selective alteration of extracellular ATP level by GEM (in relation to that in mock-infected cells) at 48 hpt. *, significantly different from mock-treated cultures (P < 0.05).
FIG 4
FIG 4
H-1PV replication in GEM-treated PDAC cells. H-1PV was added to PDAC cultures at an MOI of 10 PFU/cell, alone or after 12 hours of preexposure to GEM at the respective IC50s (see Materials and Methods). Cells were harvested at the indicated time points to measure expression of H-1PV determinants (mRNA, DNA, and proteins). (A) At 4 to 24 hpt, the number of NS1 mRNA copies was determined by qRT-PCR, normalized to cyclophilin B levels (10 kCPB), and controlled for vDNA contamination as described in Materials and Methods. (B) Viral DNA replication was assessed by Southern blotting of DNA extracts at 1 to 3 days posttreatment. ssDNA, single-stranded viral DNA genome; mRF, monomer replicative form; dRF, dimer replicative form. (C) Expression of viral proteins NS1 and -2 and VP1 to -3 was analyzed by Western blot analysis of infected cells, using antibodies targeting the respective viral proteins at 1 to 3 days posttreatment.
FIG 5
FIG 5
Transient G1/S block and cyclin A1 overexpression are sufficient to enable compatibility of proliferation-dependent H-1PV with cytotoxic GEM. T3M4 cultures were treated with H-1PV at an MOI of 10 PFU/cell, with or without previous exposure to GEM for 12 h at 40 ng/ml, and analyzed by Western blotting and FACS analysis. (A and B) Kinetics of cyclin A1 protein accumulation as monitored by Western blotting sets comprising 4, 10, and 24 hpt and 4, 24, and 48 hpt. The graph depicts the summarized data obtained by quantification of images by use of ImageJ software. (C and D) Cell cycle analyses were performed by PI staining of the DNA in the treated cells and subsequent FACS-assisted measurement of the fluorescence. Analysis of kinetics revealed transient arrest of the cells by GEM at G1/S and by H-1PV at the S/G2 boundary by 24 h (bold lines), with consequent release thereafter (48 h) (thin lines). The proportions of the population in the G0/G1, S, and G2/M cell cycle phases were calculated and plotted to show differences from the mock-treated cells.

References

    1. Siegel R, Naishadham D, Jemal A. 2012. Cancer statistics, 2012. CA Cancer J. Clin. 62:10–29. 10.3322/caac.20138 - DOI - PubMed
    1. Hartwig W, Hackert T, Hinz U, Gluth A, Bergmann F, Strobel O, Buchler MW, Werner J. 2011. Pancreatic cancer surgery in the new millennium: better prediction of outcome. Ann. Surg. 254:311–319. 10.1097/SLA.0b013e31821fd334 - DOI - PubMed
    1. Gillen S, Schuster T, Meyer Zum Buschenfelde C, Friess H, Kleeff J. 2010. Preoperative/neoadjuvant therapy in pancreatic cancer: a systematic review and meta-analysis of response and resection percentages. PLoS Med. 7:e1000267. 10.1371/journal.pmed.1000267 - DOI - PMC - PubMed
    1. Igney FH, Krammer PH. 2002. Immune escape of tumors: apoptosis resistance and tumor counterattack. J. Leukoc. Biol. 71:907–920 - PubMed
    1. Morse MA, Hall JR, Plate JM. 2009. Countering tumor-induced immunosuppression during immunotherapy for pancreatic cancer. Expert Opin. Biol. Ther. 9:331–339. 10.1517/14712590802715756 - DOI - PubMed

Publication types