. 2014 May;88(10):5421-36.
doi: 10.1128/JVI.03763-13. Epub 2014 Feb 26.

Human herpesvirus 6A infection in CD46 transgenic mice: viral persistence in the brain and increased production of proinflammatory chemokines via Toll-like receptor 9

Affiliations

Human herpesvirus 6A infection in CD46 transgenic mice: viral persistence in the brain and increased production of proinflammatory chemokines via Toll-like receptor 9

Joséphine M Reynaud et al. J Virol. 2014 May.

Abstract

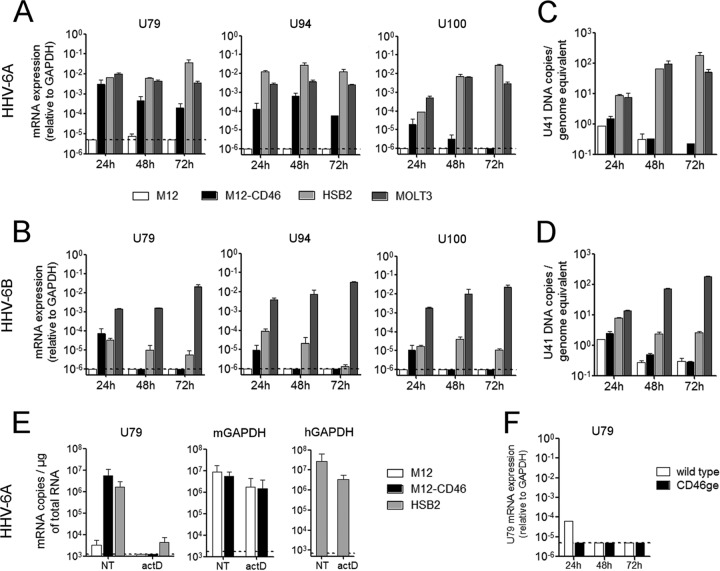
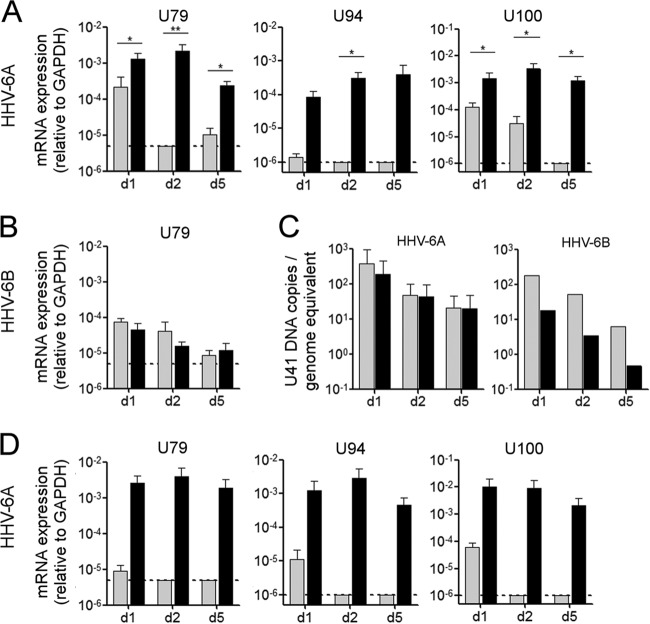
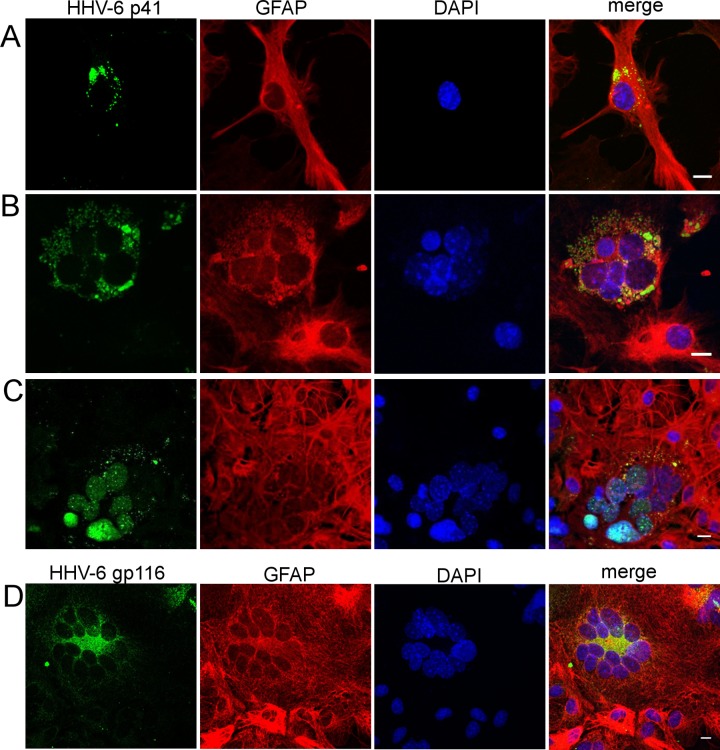
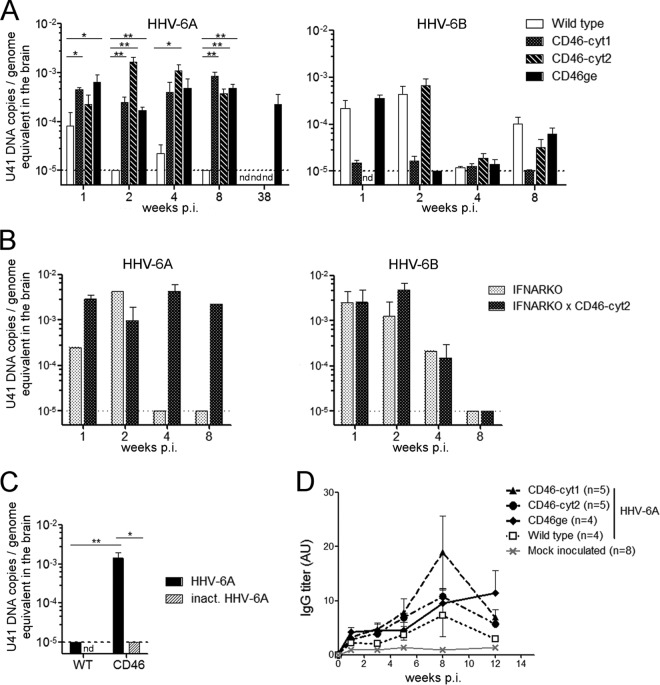
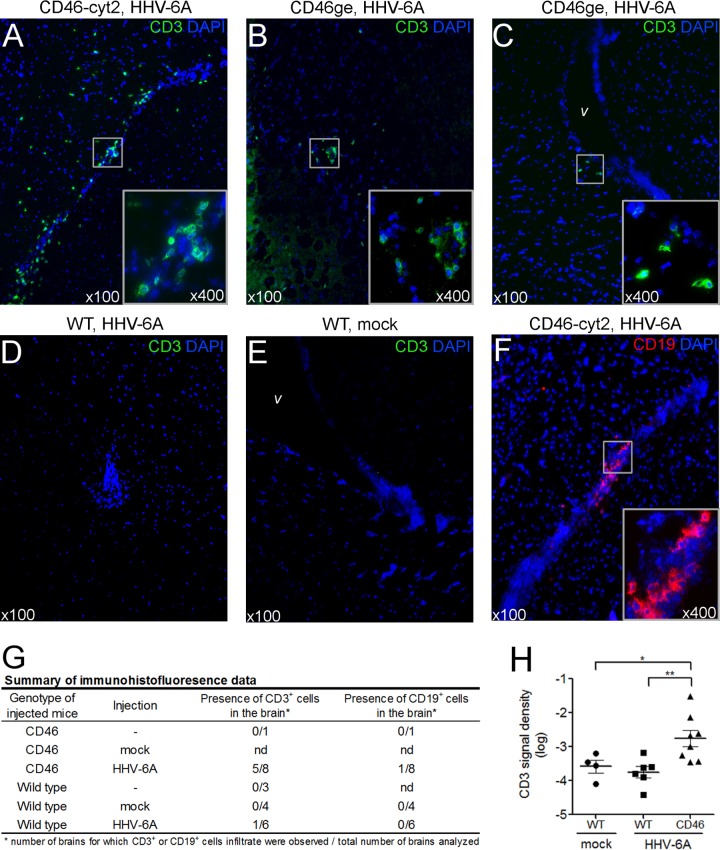
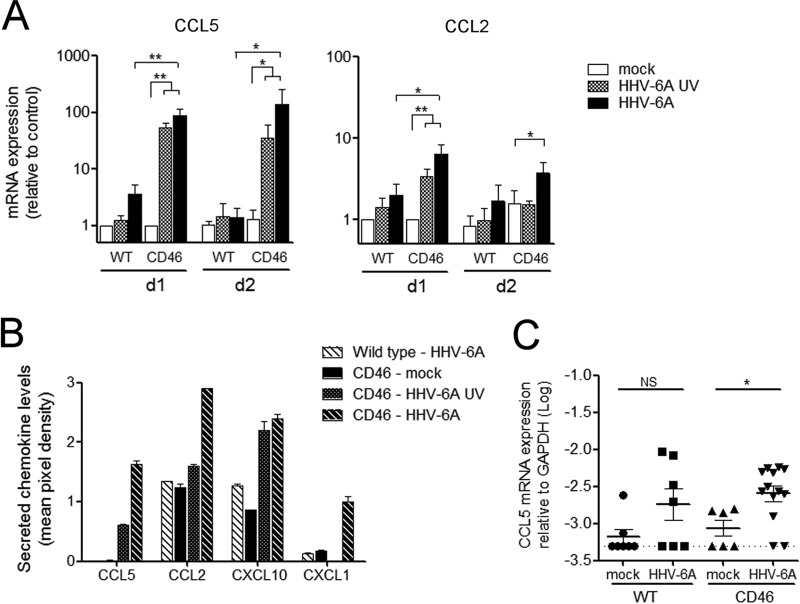
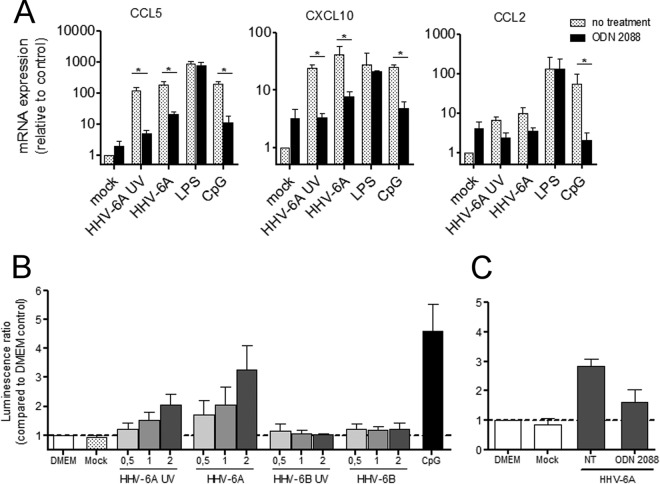
Human herpesvirus 6 (HHV-6) is widely spread in the human population and has been associated with several neuroinflammatory diseases, including multiple sclerosis. To develop a small-animal model of HHV-6 infection, we analyzed the susceptibility of several lines of transgenic mice expressing human CD46, identified as a receptor for HHV-6. We showed that HHV-6A (GS) infection results in the expression of viral transcripts in primary brain glial cultures from CD46-expressing mice, while HHV-6B (Z29) infection was inefficient. HHV-6A DNA persisted for up to 9 months in the brain of CD46-expressing mice but not in the nontransgenic littermates, whereas HHV-6B DNA levels decreased rapidly after infection in all mice. Persistence in the brain was observed with infectious but not heat-inactivated HHV-6A. Immunohistological studies revealed the presence of infiltrating lymphocytes in periventricular areas of the brain of HHV-6A-infected mice. Furthermore, HHV-6A stimulated the production of a panel of proinflammatory chemokines in primary brain glial cultures, including CCL2, CCL5, and CXCL10, and induced the expression of CCL5 in the brains of HHV-6A-infected mice. HHV-6A-induced production of chemokines in the primary glial cultures was dependent on the stimulation of toll-like receptor 9 (TLR9). Finally, HHV-6A induced signaling through human TLR9 as well, extending observations from the murine model to human infection. Altogether, this study presents a first murine model for HHV-6A-induced brain infection and suggests a role for TLR9 in the HHV-6A-initiated production of proinflammatory chemokines in the brain, opening novel perspectives for the study of virus-associated neuropathology.

Importance: HHV-6 infection has been related to neuroinflammatory diseases; however, the lack of a suitable small-animal infection model has considerably hampered further studies of HHV-6-induced neuropathogenesis. In this study, we have characterized a new model for HHV-6 infection in mice expressing the human CD46 protein. Infection of CD46 transgenic mice with HHV-6A resulted in long-term persistence of viral DNA in the brains of infected animals and was followed by lymphocyte infiltration and upregulation of the CCL5 chemokine in the absence of clinical signs of disease. The secretion of a panel of chemokines was increased after infection in primary murine brain glial cultures, and the HHV-6-induced chemokine expression was inhibited when TLR9 signaling was blocked. These results describe the first murine model for HHV-6A-induced brain infection and suggest the importance of the TLR9 pathway in HHV-6A-initiated neuroinflammation.


Figures

FIG 1
FIG 1
HHV-6 infection of murine and human lymphoid cells. Murine lymphoid M12 cells, stably expressing the human protein CD46 (M12-CD46), parental M12 cell line, and human T cell lines HSB2 and MOLT3, were infected with HHV-6A (A and C) or HHV-6B (B and D) at an MOI of 1. (A and B) mRNA levels of the viral genes U79 (early), U94 (immediate early), and U100 (late) were determined using RT-qPCR and expressed relative to that of murine GAPDH (M12 and M12-CD46) or human GAPDH (HSB2 and MOLT3). (C and D) Genomic DNA levels of the viral gene U41 were determined using qPCR, and means and standard deviations from two independent experiments are presented. (E) Before infection with HHV-6A, M12, M12-CD46, and HSB2 cells were treated with actinomycin D (actD) at 5 μg/ml for 1 h or left untreated (NT). Total RNA was extracted at 8 h postinfection, and U79 mRNA levels were quantified by RT-qPCR. Results are presented as the number of copies per μg of total RNA and are representative of two independent experiments. (F) Primary murine T lymphocytes were enriched from spleens of wild-type (open bars) or CD46ge (closed bars) mice, ConA activated, and infected with HHV-6A at an MOI of 1. mRNA expression of U79 was quantified relative to that of murine GAPDH by RT-qPCR at different time points postinfection. Dotted lines represent the limit of detection of the qPCR system.
FIG 2
FIG 2
HHV-6 infection of murine primary glial brain cultures. (A to C) Primary glial cultures were generated from the brains of wild-type mice (gray bars) or CD46-cyt1 mice (black bars) and infected with HHV-6A or HHV-6B at an MOI of 0.5. Levels of mRNA expression of the viral gene U79 (A and B) and U94 and U100 genes (A) were determined at 1, 2, and 5 days p.i. using RT-qPCR. (C) Viral DNA levels were determined by qPCR using genomic DNA. Means and standard deviations from 2 to 5 independent experiments are plotted. (D) HHV-6A infection was performed with cultures generated from IFNARKO mice (gray bars) and IFNRKO × CD46-cyt2 mice (black bars), and the mRNA levels of U79, U94, and U100 were analyzed. Dotted lines represent the limit of detection of the quantitative PCR system.
FIG 3
FIG 3
Production of HHV-6 proteins in primary murine glial brain cultures overlaid with HHV-6A-infected HSB2 lymphocytes. Primary murine brain glial cells generated from CD46-transgenic (CD46-cyt1) mice were cocultured with HHV-6A-infected HSB2 cells. Seven days after the establishment of coculture, supernatants as well as nonadherent cells, were removed, and adherent cells were fixed and analyzed for the presence of viral antigens by confocal microscopy. Cells were stained with antibodies against HHV-6 protein (green) p41 (A to C) or gp116 (D) or with glial fibrillary acidic protein (GFAP) antibody (red), and cell nuclei were stained with DAPI (blue). With p41 antibody, both cytoplasmic (A and B) and nuclear (C) staining was observed. Scale bar, 10 μm.
FIG 4
FIG 4
In vivo infection with HHV-6A or HHV-6B in different CD46-transgenic mouse lines. (A) CD46-cyt1, CD46-cyt2, or CD46ge mice or wild type littermates received i.c. injection of HHV-6A (4 to 9 mice/group) or HHV-6B (4 to 9 mice/group), followed 1 week later by i.p. injection of HHV-6A-infected HSB2 cells or HHV-6B-infected MOLT3 cells. (B) The same type of infection was performed with IFNARKO and IFNARKO × CD46-cyt2 mice with either HHV-6A or HHV-6B (1 to 4 mice/group). Brains were collected at different time points after infection, and levels of U41 DNA were determined by qPCR. Data were normalized to genome equivalents using the murine cellular gene β-actin. (C) Control experiment carried out using CD46 transgenic mice (CD46-cyt1 and CD46ge) and nontransgenic littermates (5 to 6 mice/group), which received i.c. injection of either HHV-6A or heat-inactivated (inact.) HHV-6A (nd, not done). Brains were collected 3 weeks after i.c. injection. (A to C) Increase in viral loads compared to wild-type control mice were analyzed using the Mann-Whitney test (*, P ≤ 0.05; **, P ≤ 0.01). Dotted lines represent the limit of detection of the quantitative PCR method. (D) Plasma from CD46-cyt1, CD46-cyt2, and CD46ge mice and nontransgenic littermates, inoculated with HHV-6A or mock infection solution, were collected before and after virus administration every 2 weeks for 12 weeks. HHV-6-specific IgG was detected by ELISA, using purified virions for coating, and expressed in arbitrary units (AU). Means and standard errors are plotted.
FIG 5
FIG 5
Lymphocyte infiltration in the brain of HHV-6A-infected mice. CD46-cyt2 mice (A and F), CD46ge mice (B and C), and wild-type littermates (D and E) received a single i.c. injection of purified HHV-6A or mock infection solution (E) in the right brain hemisphere. Three weeks after injection, mice were perfused with PBS and brains were collected and frozen. Coronal brain sections were fixed and analyzed by immunofluorescence using CD3 (green) (A to E) or CD19-specific (red) (F) antibodies. Cell nuclei were stained with DAPI (blue). Sections were observed at a magnification of ×100, and infiltrates are presented in inserts at higher magnification (×400). Images of the left (A and C to F) or right (B) lateral ventricle (v) areas are presented. (G) Summary of immunohistofluorescence observations. Brain slides from wild-type or CD46-cyt1, CD46-cyt2, and CD46ge mice (grouped as CD46), injected with HHV-6A, mock infection solution, or left uninjected, were analyzed for the presence of CD3+ and CD19+ cells. Data are presented as the number of brains for which CD3+ or CD19+ infiltrating cells was observed out of the total number of brains analyzed. nd, not done. (H) Two sections from each brain presented in panel G were used for quantification of CD3 fluorescent signal density. Images from the right lateral ventricle region were analyzed, and CD3 signal density (fluorescent area out of the total area analyzed) was determined using Image J software. Each point corresponds to the average value of 2 sections analyzed from one brain. Means ± standard errors for each group are presented, and statistical analysis was performed using Mann-Whitney test.
FIG 6
FIG 6
HHV-6A increases chemokine production in primary brain glial cells from CD46 transgenic mice. (A and B) Primary cultures generated from CD46 transgenic mice (CD46-cyt1 and CD46-cyt2) or wild-type mice were inoculated with either HHV-6A, UV-irradiated virus (HHV-6A UV), or mock solution. (A) At 24 and 48 h postinfection, total RNA was extracted and analyzed for the expression of CCL5 and CCL2 by RT-qPCR. CCL5 and CCL2 mRNA levels were normalized using GAPDH, and ratios relative to basal levels of mock-infected controls at 24 h postinfection are presented as means and standard errors of four (WT) or six (CD46) independent experiments. Statistical analyses were performed using the Mann-Whitney test. (B) Culture supernatants from one representative experiment were collected at 48 h postinfection, and the secretion of 40 cytokines was analyzed in duplicate using a Proteome Profiler antibody array. Results for chemokines for which consistent variations were observed are presented as mean pixel density and standard deviations from duplicates. (C) CD46 transgenic mice (CD46-cyt1 and CD46-cyt2) and wild-type mice received a single i.c. injection of purified HHV-6A or mock solution. CCL5 mRNA expression in the brain was analyzed 3 weeks after injection. Statistical analyses were performed using Student's t test (*, P ≤ 0.05; **, P ≤ 0.01).
FIG 7
FIG 7
Role of TLR9 signaling in the induction of chemokine secretion by HHV-6A. (A) Primary cultures of CD46-transgenic mice were inoculated with either UV-inactivated or infectious HHV-6A or mock solution. Control stimulations with LPS and CpG were performed in parallel. During stimulation, cells were treated with the TLR9 antagonist ligand ODN 2088 (black bars) or left untreated (gray bars). CCL5, CXCL10, and CCL2 mRNA expression was analyzed 24 h after stimulation. Means and standard deviations from 4 independent experiments are presented. (B) HEK cells stably expressing human TLR9 and the luciferase reporter construct were stimulated with UV-inactivated or infectious HHV-6A and HHV-6B at an MOI of 0.5, 1, or 2 in triplicate. Nonstimulated (DMEM), mock-stimulated, and CpG-stimulated controls were analyzed in parallel. Means and standard errors of the means from three independent experiments are presented. (C) hTLR9-HEK reporter cells were treated with the TLR9 antagonist ODN 2088 or left untreated and then were stimulated with HHV-6A. Luminescence values are expressed relative to the nonstimulated DMEM control. Means and standard deviations of triplicate values from one representative of three independent experiments are plotted (*, P ≤ 0.05; Mann-Whitney test).

Similar articles

Cited by

References

    1. Ablashi D, Agut H, Alvarez-Lafuente R, Clark DA, Dewhurst S, Diluca D, Flamand L, Frenkel N, Gallo R, Gompels UA, Höllsberg P, Jacobson S, Luppi M, Lusso P, Malnati M, Medveczky P, Mori Y, Pellett PE, Pritchett JC, Yamanishi K, Yoshikawa T. 6 November 2013. Classification of HHV-6A and HHV-6B as distinct viruses. Arch. Virol. 10.1007/s00705-013-1902-5 - DOI - PMC - PubMed
    1. Braun DK, Dominguez G, Pellett PE. 1997. Human herpesvirus 6. Clin. Microbiol. Rev. 10:521–567 - PMC - PubMed
    1. Yamanishi K, Okuno T, Shiraki K, Takahashi M, Kondo T, Asano Y, Kurata T. 1988. Identification of human herpesvirus-6 as a causal agent for exanthem subitum. Lancet i:1065–1067 - PubMed
    1. Luppi M, Barozzi P, Maiorana A, Marasca R, Torelli G. 1994. Human herpesvirus 6 infection in normal human brain tissue. J. Infect. Dis. 169:943–944. 10.1093/infdis/169.4.943 - DOI - PubMed
    1. Chan PK, Ng HK, Hui M, Ip M, Cheung JL, Cheng AF. 1999. Presence of human herpesviruses 6, 7, and 8 DNA sequences in normal brain tissue. J. Med. Virol. 59:491–495. 10.1002/(SICI)1096-9071(199912)59:4<491::AID-JMV11>3.0.CO;2-1 - DOI - PubMed

Publication types

MeSH terms

LinkOut - more resources