. 2014 May 1;123(18):2816-25.
doi: 10.1182/blood-2013-02-481507. Epub 2014 Feb 26.

NOTCH2 and FLT3 gene mis-splicings are common events in patients with acute myeloid leukemia (AML): new potential targets in AML

Affiliations

NOTCH2 and FLT3 gene mis-splicings are common events in patients with acute myeloid leukemia (AML): new potential targets in AML

Sophia Adamia et al. Blood. .

Abstract

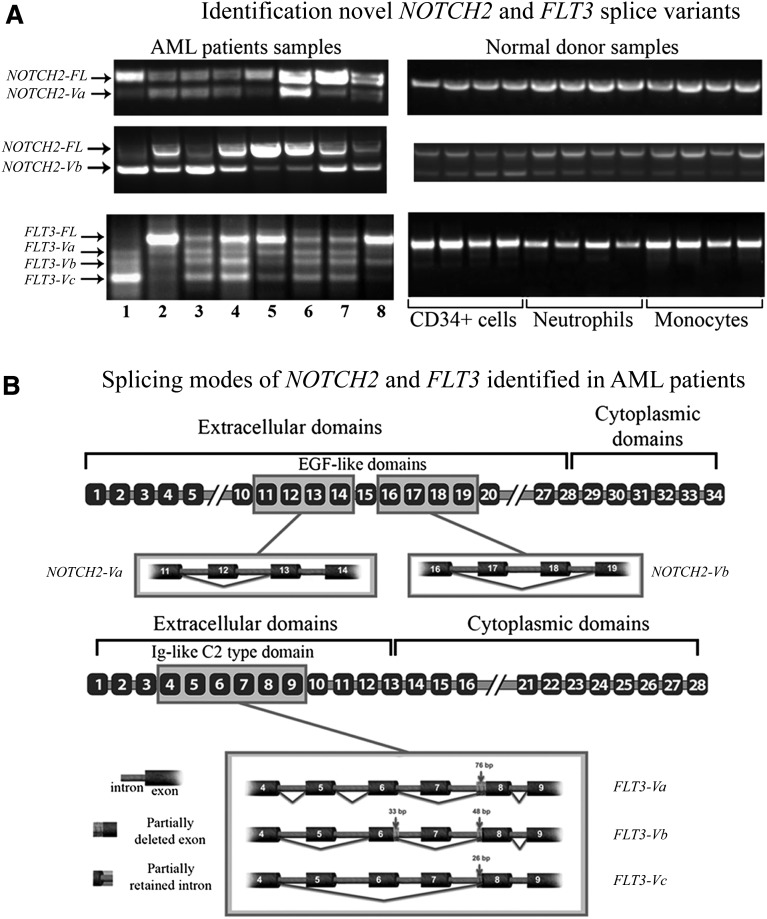
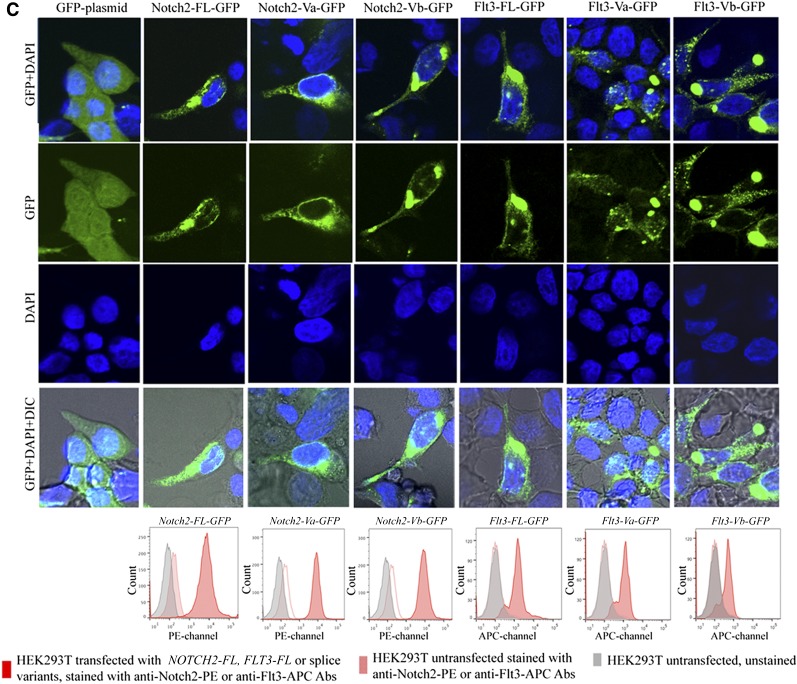
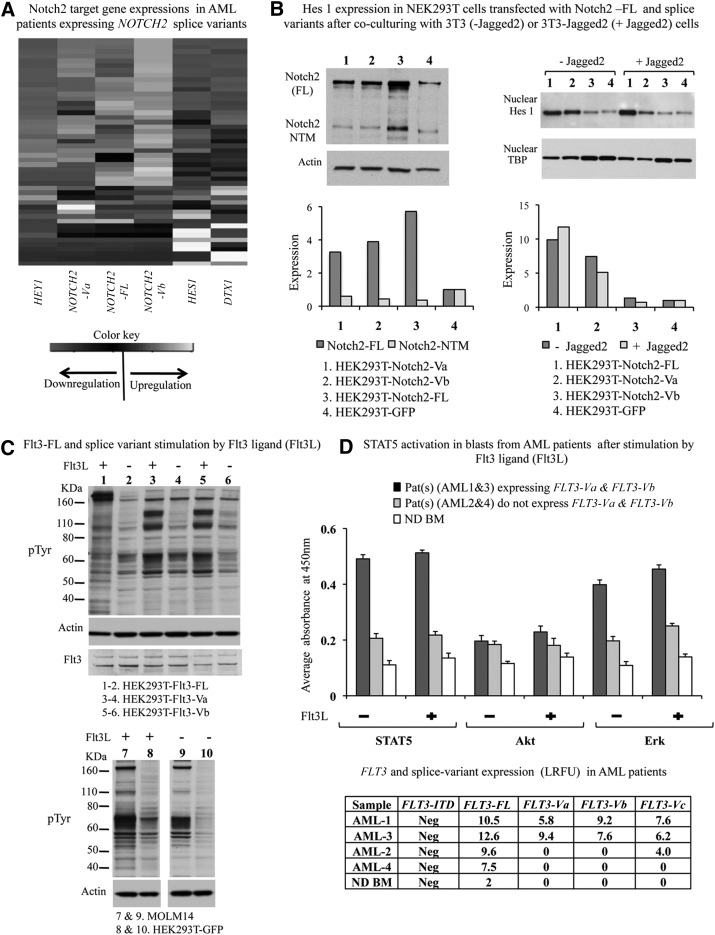
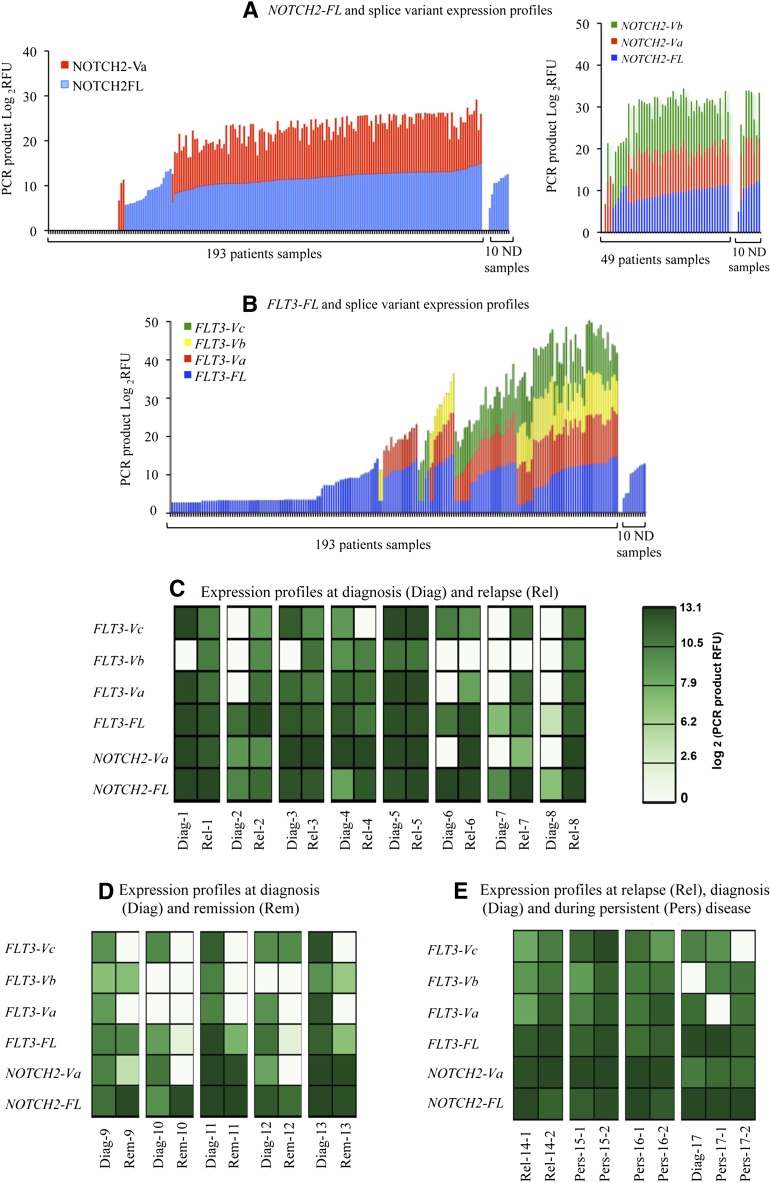
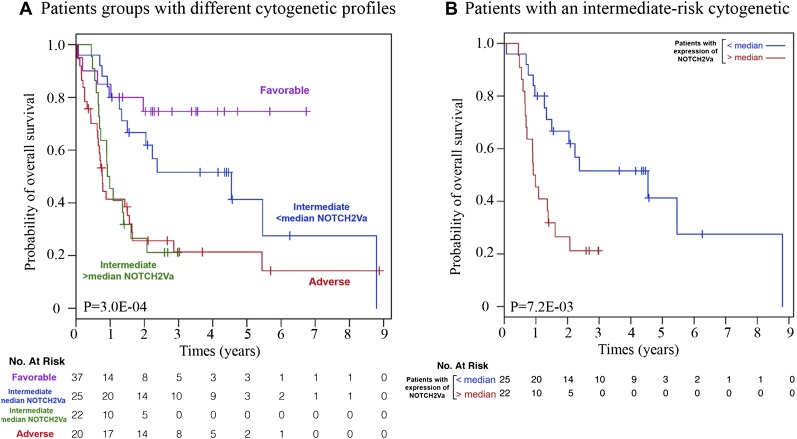
Our previous studies revealed an increase in alternative splicing of multiple RNAs in cells from patients with acute myeloid leukemia (AML) compared with CD34(+) bone marrow cells from normal donors. Aberrantly spliced genes included a number of oncogenes, tumor suppressor genes, and genes involved in regulation of apoptosis, cell cycle, and cell differentiation. Among the most commonly mis-spliced genes (>70% of AML patients) were 2, NOTCH2 and FLT3, that encode myeloid cell surface proteins. The splice variants of NOTCH2 and FLT3 resulted from complete or partial exon skipping and utilization of cryptic splice sites. Longitudinal analyses suggested that NOTCH2 and FLT3 aberrant splicing correlated with disease status. Correlation analyses between splice variants of these genes and clinical features of patients showed an association between NOTCH2-Va splice variant and overall survival of patients. Our results suggest that NOTCH2 and FLT3 mis-splicing is a common characteristic of AML and has the potential to generate transcripts encoding proteins with altered function. Thus, splice variants of these genes might provide disease markers and targets for novel therapeutics.


Figures

Figure 1
Figure 1
Identification novel NOTCH2 and FLT3 splice variants. (A) This figure displays NOTCH2 and FLT3 RT-PCR agarose gel electrophoresis results. (B) This figure displays AML-associated splicing patterns of NOTCH2 and FLT3 splice variants. After cloning and sequencing experiments, novel splice variant sequences were identified through alignment with published sequences for human NOTCH2 and FLT3 mRNA (gi:317008612 and gi:178535 NCBI, respectively). NOTCH2-Va and NOTCH2-Vb are the result of complete deletions of exon 12 (111 bp) or exons 17 (120 bp) and 18 (153 bp), respectively. These splicing aberrations did not cause any frame shifts. FLT3-Va is a result of skipping exon 7 (140 bp) and a 76-bp deletion of exon 8 at the 5′ end, whereas FLT3-Vb was due to skipping exons 5 (130 bp) and 7 (140 bp), with partial deletions of exons 6 (33-bp deletion at the 3′ end of exon 6) and 8 (48-bp deletion at the 5′ end of exon 8). FLT3-Vc appears to be most severely affected by splicing events compared with other FLT3 splice variants. FLT3-Vc is a result of skipping of exons 5 (130 bp), 6 (128 bp), and 7 (140 bp) and a 26-bp deletion of exon 8 at the 5′ end. As a result of these aberrations 240 bp are spliced out from FLT3-Va, 351 bp from FLT3-Vb, and 398 bp from FLT3-Vc. Thus, these aberrations did not cause a frame shift on FLT3-Va and FLT3-Vb transcripts, whereas FLT3-Vc transcripts were subjected to a frame shift. For both NOTCH2 and FLT3, the splice variant transcripts retained their original start codons and conserved signal sequences. Also, bioinformatics and alignment analysis showed that exons affected by aberrant splicing events mapped to extracellular domains of the Notch2 and Flt3 protein sequences. As a result of the splicing alterations, 3 EGF-like domains were entirely deleted from the Notch2 protein and 2 were partially affected. Splicing alterations caused deletion of the entire Ig-like C2 type domain on the Flt3 protein. In the figure, we zoomed out gene segments of NOTCH2 and FLT3 that we cloned and sequenced. In the figure, yellow-boxed exons are those that are affected by the splicing events. (C) HEK293T cells were transiently transfected with NOTCH2-FL-GFP, NOTCH2-Va-GFP, NOTCH2-Vb-GFP, FLT3-FL-GFP, FLT3-Va-GFP, FLT3-Vb-GFP, or GFP backbone plasmids. Seventy-two hours after transfection cells were stained using the live cell nuclear staining reagent (Life Technologies) that includes DAPI. Cells were visualized under the Zeiss 710 confocal laser-scanning microscope. On the figure, GFP signal shown in green, and DAPI signal in blue. HEK293T cells transfected with NOTCH2 and FLT3 splice-variants were stained with anti-Notch2-PE (16F11, eBioscience) and anti-Flt3-APC (BV10A4H2, eBioscience) antibodies, then membrane expression of these variants was evaluated by flow cytometry. On the flow cytometry histograms, gray peaks represent HEK293T cells untransfected and unstained, pink peaks represent HEK293T cells untransfected and stained with anti-Notch2-PE or anti-Flt3-APC antibodies, red peaks represent HEK293T cells transfected with NOTCH2-FL, FLT3-FL, or splice variants tagged with GFP. These cells were stained with anti-Notch2-PE or anti-Flt3-APC antibodies and staining was determined in GFP gated cells. IgG stained controls are provided in Supplemental Figure 1A.
Figure 1
Figure 1
Identification novel NOTCH2 and FLT3 splice variants. (A) This figure displays NOTCH2 and FLT3 RT-PCR agarose gel electrophoresis results. (B) This figure displays AML-associated splicing patterns of NOTCH2 and FLT3 splice variants. After cloning and sequencing experiments, novel splice variant sequences were identified through alignment with published sequences for human NOTCH2 and FLT3 mRNA (gi:317008612 and gi:178535 NCBI, respectively). NOTCH2-Va and NOTCH2-Vb are the result of complete deletions of exon 12 (111 bp) or exons 17 (120 bp) and 18 (153 bp), respectively. These splicing aberrations did not cause any frame shifts. FLT3-Va is a result of skipping exon 7 (140 bp) and a 76-bp deletion of exon 8 at the 5′ end, whereas FLT3-Vb was due to skipping exons 5 (130 bp) and 7 (140 bp), with partial deletions of exons 6 (33-bp deletion at the 3′ end of exon 6) and 8 (48-bp deletion at the 5′ end of exon 8). FLT3-Vc appears to be most severely affected by splicing events compared with other FLT3 splice variants. FLT3-Vc is a result of skipping of exons 5 (130 bp), 6 (128 bp), and 7 (140 bp) and a 26-bp deletion of exon 8 at the 5′ end. As a result of these aberrations 240 bp are spliced out from FLT3-Va, 351 bp from FLT3-Vb, and 398 bp from FLT3-Vc. Thus, these aberrations did not cause a frame shift on FLT3-Va and FLT3-Vb transcripts, whereas FLT3-Vc transcripts were subjected to a frame shift. For both NOTCH2 and FLT3, the splice variant transcripts retained their original start codons and conserved signal sequences. Also, bioinformatics and alignment analysis showed that exons affected by aberrant splicing events mapped to extracellular domains of the Notch2 and Flt3 protein sequences. As a result of the splicing alterations, 3 EGF-like domains were entirely deleted from the Notch2 protein and 2 were partially affected. Splicing alterations caused deletion of the entire Ig-like C2 type domain on the Flt3 protein. In the figure, we zoomed out gene segments of NOTCH2 and FLT3 that we cloned and sequenced. In the figure, yellow-boxed exons are those that are affected by the splicing events. (C) HEK293T cells were transiently transfected with NOTCH2-FL-GFP, NOTCH2-Va-GFP, NOTCH2-Vb-GFP, FLT3-FL-GFP, FLT3-Va-GFP, FLT3-Vb-GFP, or GFP backbone plasmids. Seventy-two hours after transfection cells were stained using the live cell nuclear staining reagent (Life Technologies) that includes DAPI. Cells were visualized under the Zeiss 710 confocal laser-scanning microscope. On the figure, GFP signal shown in green, and DAPI signal in blue. HEK293T cells transfected with NOTCH2 and FLT3 splice-variants were stained with anti-Notch2-PE (16F11, eBioscience) and anti-Flt3-APC (BV10A4H2, eBioscience) antibodies, then membrane expression of these variants was evaluated by flow cytometry. On the flow cytometry histograms, gray peaks represent HEK293T cells untransfected and unstained, pink peaks represent HEK293T cells untransfected and stained with anti-Notch2-PE or anti-Flt3-APC antibodies, red peaks represent HEK293T cells transfected with NOTCH2-FL, FLT3-FL, or splice variants tagged with GFP. These cells were stained with anti-Notch2-PE or anti-Flt3-APC antibodies and staining was determined in GFP gated cells. IgG stained controls are provided in Supplemental Figure 1A.
Figure 2
Figure 2
Functional effects of NOTCH2 and FLT3 splice variants. (A) This figure displays unsupervised clustering analyses results obtained from the TaqMan gene expression assays of Notch2 target genes HES1, DXT1 and HEY1 carried out in 49 AML patients expressing NOTCH2-FL, FLT3-FL, and their splice variants. Expression levels of NOTCH2-FL, FLT3-FL, and their splice variants were determined by RT-PCR and DNA fragment analysis described in this paper. In these studies, relative transcript expressions are calculated compared with the expression levels of the corresponding transcripts detected in NDs. (B) This figure is a summary of coculture experiments performed 3 times. HEK293T cells expressing NOTCH2-FL-GFP, NOTCH2-Va-GFP, and NOTCH2-Vb-GFP were cocultured 24 hours with 3T3 cells (−Jagged2) or 3T3 cells expressing Jagged2 (+Jagged2). After incubation, cells were scraped, and GFP-positive cells were sorted. Western blotting analysis for Notch2 and Hes 1 was performed as described in “Materials and methods”. Western blots were quantified using the ImageJ software (http://rsb.info.nih.gov/ij). Densitometry measurements were normalized to loading control amount. (C) FLT3-FL, FLT3-Va, and FLT3Vb splice variants were stably expressed in HEK293T cells. Serum-deprived, transfected cells were stimulated for 10 minutes with FLT3L. Cellular tyrosine phosphorylation was analyzed by immunoblotting with a pTyr antibody (Clone 4G10 from Millipore). Elevation of tyrosine phosphorylation of bands at approximately 100 kDa was determined compared with FLT3L unstimulated cells. Additionally, in the samples, Flt3 expression was determined by immunoblotting using anti-FLT3 antibodies from eBiosciences. As a loading control, the same membranes were reprobed with anti-actin antibody. As a control, MOLM14 and HEK293T-GFP stimulated and unstimulated cell lysates were used for pTyr immunoblotting analyses. (D) Serum-starved blasts from patients were stimulated for 10 minutes with 100 ng/mL Flt3L and washed, and cell lysates were prepared to measure phosphorylation levels of STAT5, Akt, and Erk using InstantOne enzyme-linked immunosorbent assay kits according to the manufacturer’s suggestions. Absorbance was measured at 450 nm using an automated enzyme-linked immunosorbent assay plate reader. In the figure, results are presented as bar graphs. The x-axis shows the samples analyzed, and the y-axis displays the phosphorylation level as an absorbance. Results obtained from positive and negative control samples are not displayed on the graph. Expression levels of FLT3-FL and its splice variants in patient samples are reported in a table included in this figure and presented as RFU = log2RFU (relative fluorescence units, described in Figure 3).
Figure 3
Figure 3
NOTCH2-FL and FLT3-FL and their novel splice variant expression frequencies in AML patients and their association with disease status. (A-B) These figures display overall expression patterns of (A) NOTCH2 and (B) FLT3 FL transcripts and their splice variants. On the figures, the x-axes display patient and normal donor samples, and the y-axes display relative fluorescent units (RFU). PCR product RFU = log2RFU. RFU is a unit of measurement calculated relative to the size standards included in each reaction. For relative level determination, product levels were kept below 3500 RFU, and size standard levels were within 500 to 800 units as recommended by the manufacturer. All calculations and an instrument calibration were done according to the Life Technologies recommendations. We note that in some patients, FLT3-FL expression is lower than the cutoff and not displayed on the graph. (C-E) These figures display overall expression patterns of NOTCH2-FL and FLT3-FL transcripts and their splice variants over the course of the disease in 17 patients. Patients are numbered from 1 to 17; patients samples were taken (C) at diagnosis and relapse (patients 1-8), (D) at diagnosis and remission (patients 9-13), or (E) over the course of refractory disease (patients 14-17). A total of 35 samples were collected including 14 samples obtained at diagnosis: Diag 1 to 13 and Diag 17; 10 samples obtained at relapse: Rel 1 to 8, Rel-14-1, and Rel-14-2 (first and second relapses); 5 samples obtained at remission: Rem 9 to 13; 6 samples obtained during regular visits over the course of refractory disease: Pers 15 to 17 (samples taken at first and second visits are marked as −1 or −2). On the panels, NOTCH2-FL and FLT3-FL and their splice variant transcripts expression levels are presented as log2(PCR product RFU) and shown in a green color-coded scale.
Figure 4
Figure 4
The relevance of NOTCH2-Va expression to the clinical outcome of patients with AML. The relevance of NOTCH2-Va expression to clinical outcome was estimated in the subgroup of patients within each cytogenetic risk group. As A demonstrates, a patient group expressing higher than median levels of NOTCH2-Va has a similar prognosis as the adverse risk group of patients. B shows the overall survival of AML patients with an intermediate risk cytogenetic profile. When dividing patients into 4 categories based on NOTCH2-Va expression (divided by quartile) the resulting classification was borderline significant (P = 5.9 × 10⁻²) as expected due to the small number of patients in each group. However, separation trend remained the same.

Comment in

References

    1. Bennett JM, Catovsky D, Daniel MT, et al. Proposals for the classification of the acute leukaemias. French-American-British (FAB) co-operative group. Br J Haematol. 1976;33(4):451–458. - PubMed
    1. Grimwade D. The clinical significance of cytogenetic abnormalities in acute myeloid leukaemia. Best Pract Res Clin Haematol. 2001;14(3):497–529. - PubMed
    1. O’Donnell MR, Abboud CN, Altman J, et al. National Comprehensive Cancer Network. Acute myeloid leukemia. J Natl Compr Canc Netw. 2011;9(3):280–317. - PubMed
    1. Fathi AT, Abdel-Wahab O. Mutations in epigenetic modifiers in myeloid malignancies and the prospect of novel epigenetic-targeted therapy. Adv Hematol. 2012;2012:469592. - PMC - PubMed
    1. Mardis ER, Ding L, Dooling DJ, et al. Recurring mutations found by sequencing an acute myeloid leukemia genome. N Engl J Med. 2009;361(11):1058–1066. - PMC - PubMed

Publication types

MeSH terms