. 2014 Feb 12:6:2.
doi: 10.3389/fnsyn.2014.00002. eCollection 2014.

Enhanced synaptic transmission at the squid giant synapse by artificial seawater based on physically modified saline

Affiliations

Enhanced synaptic transmission at the squid giant synapse by artificial seawater based on physically modified saline

Soonwook Choi et al. Front Synaptic Neurosci. .

Abstract

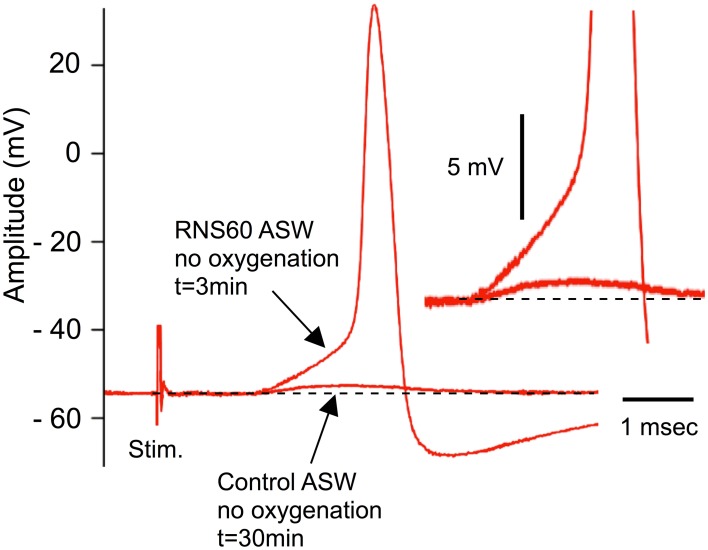
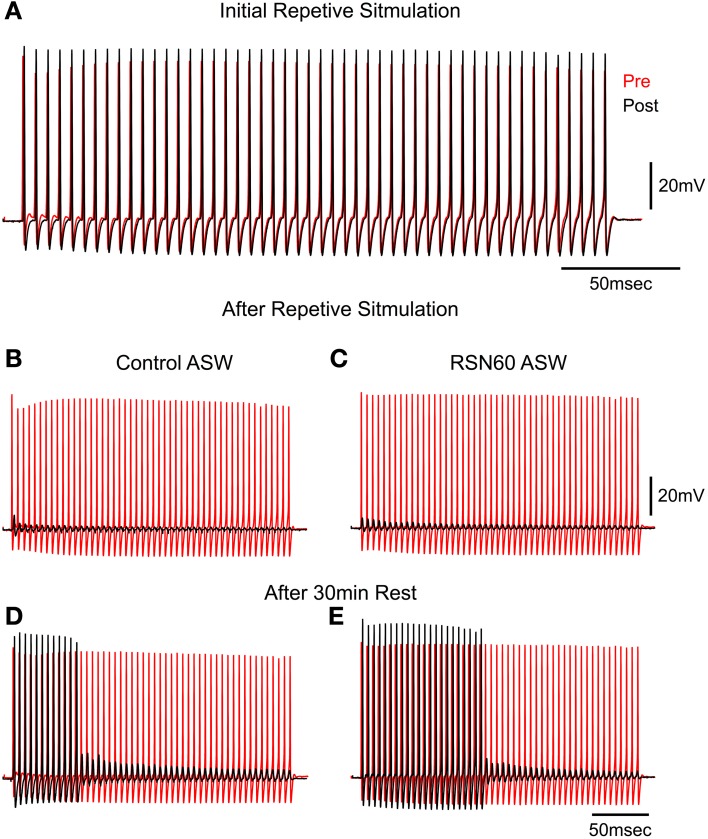
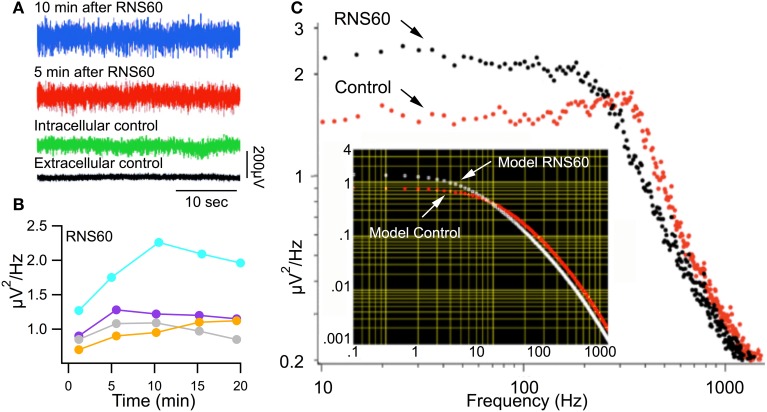
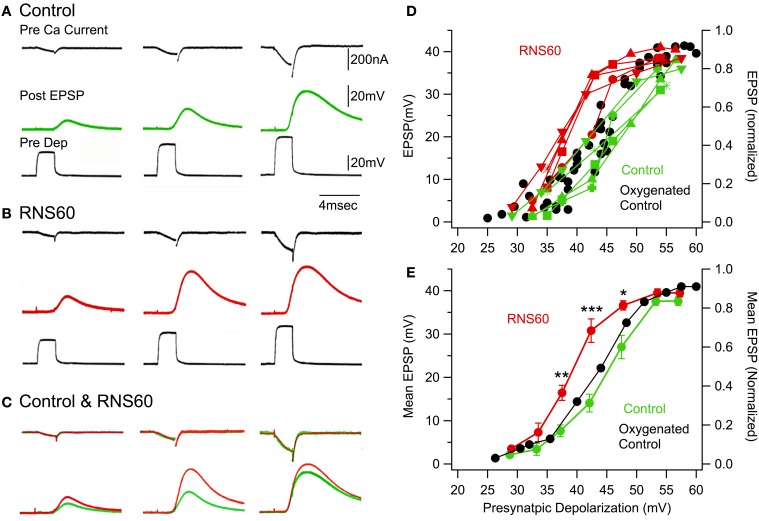
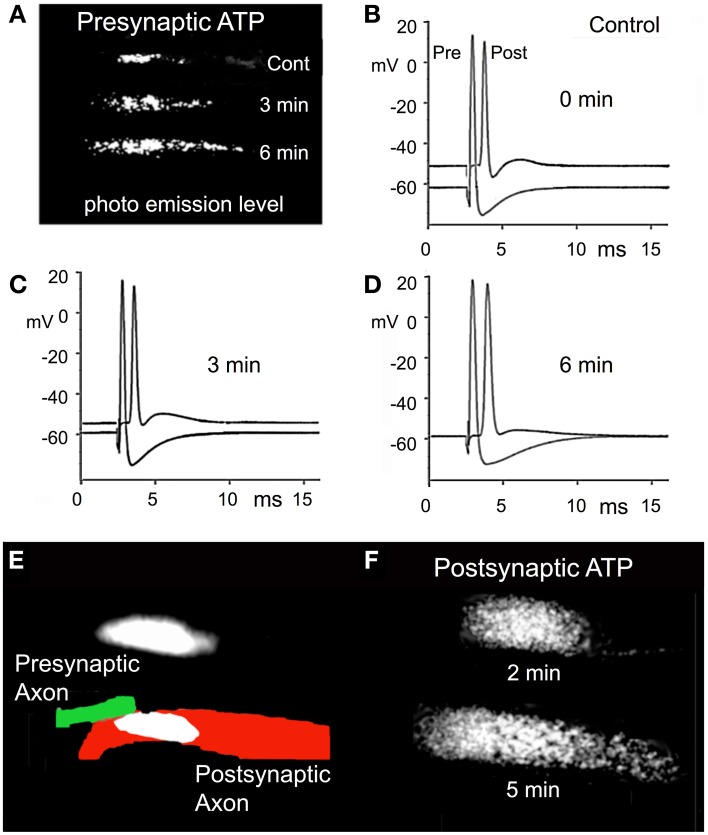
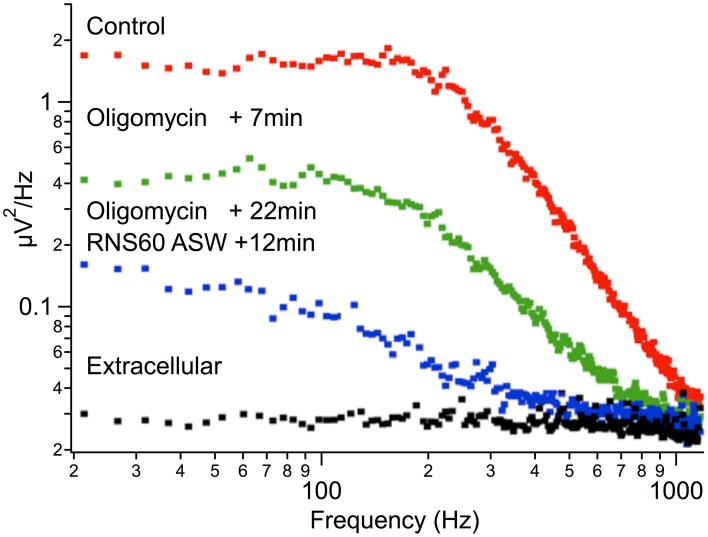
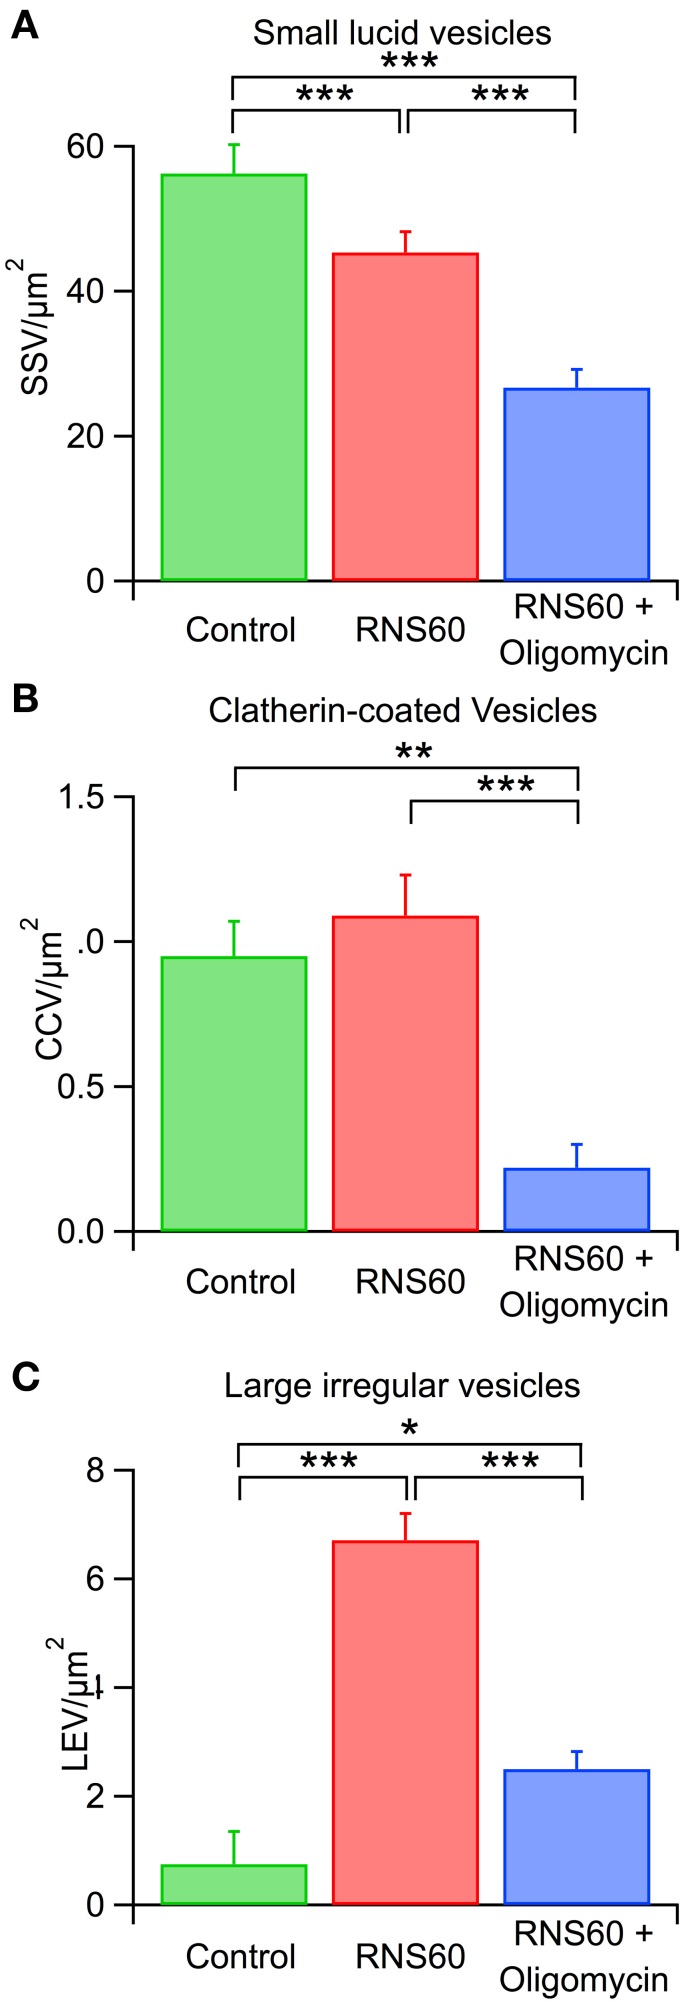
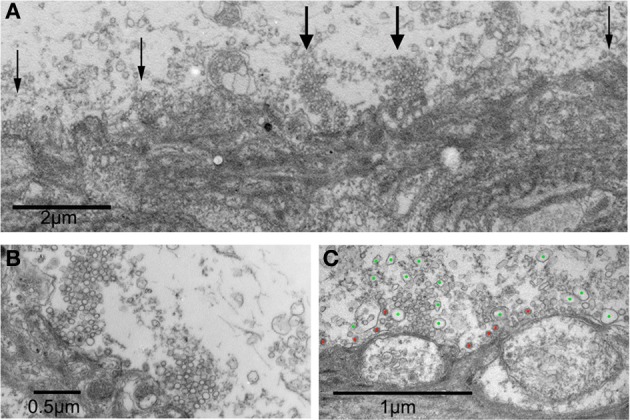
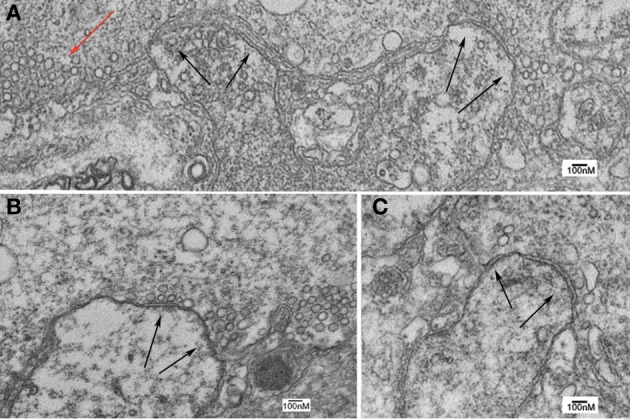
Superfusion of the squid giant synapse with artificial seawater (ASW) based on isotonic saline containing oxygen nanobubbles (RNS60 ASW) generates an enhancement of synaptic transmission. This was determined by examining the postsynaptic response to single and repetitive presynaptic spike activation, spontaneous transmitter release, and presynaptic voltage clamp studies. In the presence of RNS60 ASW single presynaptic stimulation elicited larger postsynaptic potentials (PSP) and more robust recovery from high frequency stimulation than in control ASW. Analysis of postsynaptic noise revealed an increase in spontaneous transmitter release with modified noise kinetics in RNS60 ASW. Presynaptic voltage clamp demonstrated an increased EPSP, without an increase in presynaptic ICa(++) amplitude during RNS60 ASW superfusion. Synaptic release enhancement reached stable maxima within 5-10 min of RNS60 ASW superfusion and was maintained for the entire recording time, up to 1 h. Electronmicroscopic morphometry indicated a decrease in synaptic vesicle density and the number at active zones with an increase in the number of clathrin-coated vesicles (CCV) and large endosome-like vesicles near junctional sites. Block of mitochondrial ATP synthesis by presynaptic injection of oligomycin reduced spontaneous release and prevented the synaptic noise increase seen in RNS60 ASW. After ATP block the number of vesicles at the active zone and CCV was reduced, with an increase in large vesicles. The possibility that RNS60 ASW acts by increasing mitochondrial ATP synthesis was tested by direct determination of ATP levels in both presynaptic and postsynaptic structures. This was implemented using luciferin/luciferase photon emission, which demonstrated a marked increase in ATP synthesis following RNS60 administration. It is concluded that RNS60 positively modulates synaptic transmission by up-regulating ATP synthesis, thus leading to synaptic transmission enhancement.

Keywords: calcium current; neurotransmitter release; physically modified water; squid giant synapse; synaptic transmission optimization.


Figures

Figure 1
Figure 1
Example of recovery of evoked transmitter release by RNS60 ASW in a hypoxic synapse following electrical stimulation of the presynaptic terminal. Note small subthreshold synaptic potential after 30 min of hypoxia (lower arrow) and EPSP (upper arrow) and action potential elicited 3 min after superfusion with RNS60 ASW. Insert, amplitude magnification showing detail of the EPSP onset indicating change in amplitude without a change in release latency.
Figure 2
Figure 2
High frequency stimulation in Control and RNS60 ASW. (A) Presynaptic (red) and Postsynaptic (black) spikes generated by a repetitive presynaptic electrical stimulation at 200 Hz. (B) Failure of all postsynaptic spike generation after 100 consecutive trains repeated at 1 Hz in Control ASW. (C) Same as in (B) recorded in RNS60 ASW. (D) Partial recovery of postsynaptic spike generation after a 30 s rest period in control ASW. (E) Partial recovery after rest period in RNS60 ASW. Note in (D,E) that in the presence of RNS60 ASW there was a more vigorous recovery of postsynaptic spike generation after a similar 30 s rest period than in control ASW. Similar results were obtained in four other synapses utilizing the same stimulus paradigm.
Figure 3
Figure 3
Synaptic noise recorded in Control ASW and RNS60 ASW. (A) Recordings showing synaptic noise across the postsynaptic membrane superfused with control ASW (green) and the increase in noise amplitude 5 min (red) and 10 min (blue) after superfusion with RNS60 ASW as well as the background extracellular noise recorded directly from the bath (black). (B) Plot of change in noise amplitude as a function of time after superfusion with RNS60 ASW in four synapses. (C) Plot of noise amplitude as a function of frequency (note log scale) in control ASW (red) and 10 min after superfusion with RNS60 ASW (black). The insert shows modeled results indicating that the change in noise could be interpreted as a change in the time course and amplitude of synaptic noise (for details see Lin et al., 1990).
Figure 4
Figure 4
Voltage clamp study indicating that RNS60 increases transmitter release without modifying calcium current or its relationship with transmitter release. (A) Set of traces recorded in Control ASW show the amplitude and time course of the presynaptic calcium current (black), the amplitude and time course of the postsynaptic response (green) elicited by the rapid voltage clamp step shown in the third trace (Pre Dep, black). (B) Set of traces recorded in RNS60 ASW with the same amplitude depolarizing pulses as in the control set; EPSPs are red. (C) Superposition of calcium currents (upper traces) and EPSPs (lower trace) from panel (A) for control (green) and panel (B) for RNS60 (red) ASW demonstrates that there was no change in the time course or amplitude of the presynaptic calcium current, but a clear increase in the EPSP amplitude in RNS60 compared to control ASW. (D) Plot of EPSP amplitude as a function of presynaptic depolarization step for the five synapses. (Set of recordings from each synapse use the same marker.) The oxygenated control is modified from Figure 3B in (Llinas et al., 1981b) and provides data from seven synapses superfused with control ASW oxygenated with a 99.5% 02 and 0.5% CO2 gas mixture or with 0.001% H2O2. (E) Mean EPSP and s.e.m. as a function of mean presynaptic depolarizations for synapses in panel (D). Oxygenated control is mean of data in Figure 3B in (Llinas et al., 1981b). [*T(4, 8) = 4.27, p < 0.01; **T(4, 8) = 5.1, p < 0.001; ***T(4, 8) = 3.54, p < 0.05, t-test].
Figure 5
Figure 5
Effect of RNS60 on ATP synthesis. (A) The levels of luciferin/luciferase light emission in control ASW (Cont) and 3 and 6 min following RNS60 superfusion. (B) Presynaptic and postsynaptic action potentials in control ASW. (C) Action potentials recorded 3 min after superfusion with RNS60. (D) Action potentials recorded 6 min after superfusion with RNS60. (E) Drawing of presynaptic (green) and postsynaptic (red) element is superimposed on photograph of postsynaptic light emission. Presynaptic light emission is shown above the drawing. (F) Postsynaptic light emission 2 and 5 min after superfusion with RNS60. Note increase in postsynaptic resting potential in (C,D), indicating an improvement of postsynaptic axon viability that is consistent with the increased level of ATP measured at the postsynaptic terminal following RNS60 ASW superfusion.
Figure 6
Figure 6
Reduction of spontaneous synaptic release following oligomycin administration. Plot of noise amplitude as a function of frequency (note double log coordinates). Red, control ASW; green, 7 min after addition of oligomycin; blue, 22 min after oligomycin administration and 12 min after changing superfusate to RNS60 ASW. Black, extracellular recording.
Figure 7
Figure 7
Effect of RNS60 and oligomycin on synaptic vesicle numbers. (A) Number of lucid small synaptic vesicles after superfusion with control (green), RNS60 (red), or RNS60 after presynaptic injection of oligomycin (blue) in the presence of RNS60. (B) Number of clatherin-coated vesicles under the same three conditions as in panel (A). (C) Number of large, irregular vesicles under the same three conditions as in panel (A). ***p < 0.0001, **p < 0.001, *p < 0.05, Kruskal-Wakkus test.
Figure 8
Figure 8
Electronmicrographs of a synaptic junctions following RNS60 ASW superfusion. (A) Presynaptic and postsynaptic image at low magnification showing postsynaptic digit making several contacts forming active zones with the presynaptic terminal (arrows) in a synapse superfused with control ASW. (B) Higher power image showing two active zones from panel (A) that are marked with wide arrows. (C) Vesicles of irregular shapes and sizes are present in the terminals from a synapse superfused with RNS60 ASW. Green dots denote large synaptic-like vesicles, red dots mark clathrin-coated vesicles.
Figure 9
Figure 9
Ultrastructure of squid giant synapse active zones following oligomycin injection. (A–C) Black arrows indicate active zones showing few, if any, synaptic vesicles. Note also the lack of clathrin-coated vesicles and of large vesicular profiles that are generally found in the presence of synapses superfused with RNS60 ASW. Note also the presence of a few vesicles scattered away from the active zone (red arrow).

Similar articles

Cited by

References

    1. Attwell D., Laughlin S. B. (2001). An energy budget for signaling in the grey matter of the brain. J. Cereb. Blood Flow Metab. 21, 1133–1145 10.1097/00004647-200110000-00001 - DOI - PubMed
    1. Augustine G. J., Charlton M. P. (1986). Calcium dependence of presynaptic calcium current and post-synaptic response at the squid giant synapse. J. Physiol. 381, 619–640 - PMC - PubMed
    1. Augustine G. J., Morgan J. R., Villalba-Galea C. A., Jin S., Prasad K., Lafer E. M. (2006). Clathrin and synaptic vesicle endocytosis: studies at the squid giant synapse. Biochem. Soc. Trans. 34, 68–72 10.1042/BST0340068 - DOI - PMC - PubMed
    1. Billups B., Forsythe I. D. (2002). Presynaptic mitochondrial calcium sequestration influences transmission at mammalian central synapses. J. Neurosci. 22, 5840–5847 - PMC - PubMed
    1. Bryant S. H. (1958). Transmission in squid giant synapses: the importance of oxygen supply and the effects of drugs. J. Gen. Physiol. 41, 473–484 10.1085/jgp.41.3.473 - DOI - PMC - PubMed

LinkOut - more resources