. 2014 Feb 10:5:40.
doi: 10.3389/fimmu.2014.00040. eCollection 2014.

VH Replacement Footprint Analyzer-I, a Java-Based Computer Program for Analyses of Immunoglobulin Heavy Chain Genes and Potential VH Replacement Products in Human and Mouse

Affiliations

VH Replacement Footprint Analyzer-I, a Java-Based Computer Program for Analyses of Immunoglobulin Heavy Chain Genes and Potential VH Replacement Products in Human and Mouse

Lin Huang et al. Front Immunol. .

Abstract

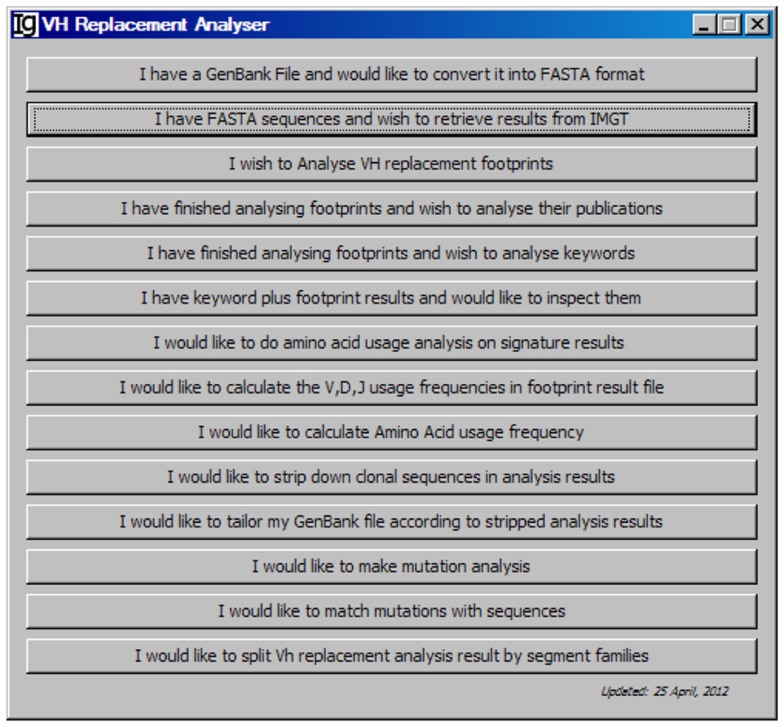
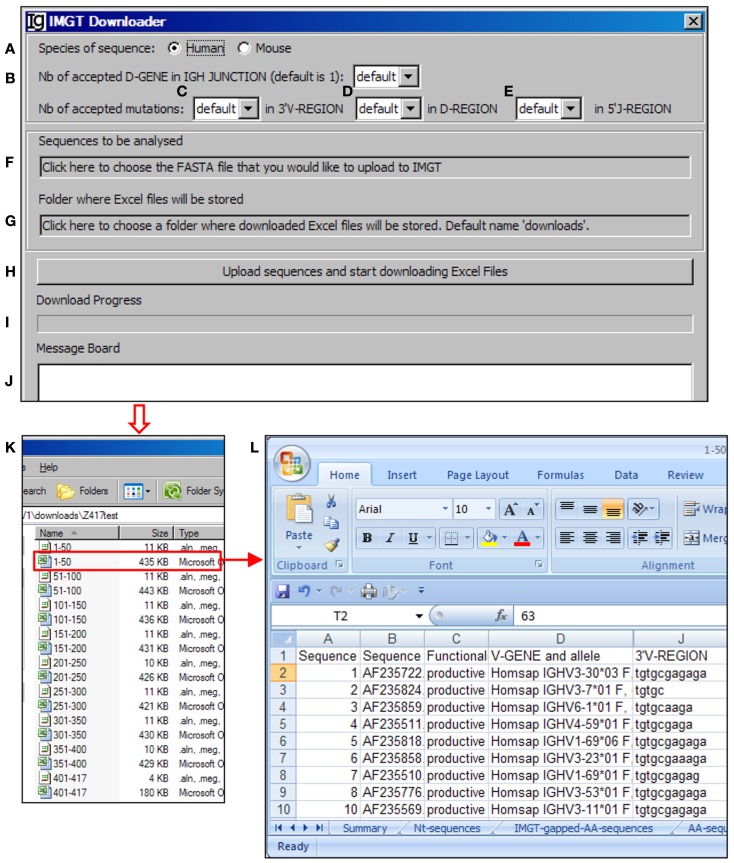
VH replacement occurs through RAG-mediated secondary recombination between a rearranged VH gene and an upstream unrearranged VH gene. Due to the location of the cryptic recombination signal sequence (cRSS, TACTGTG) at the 3' end of VH gene coding region, a short stretch of nucleotides from the previous rearranged VH gene can be retained in the newly formed VH-DH junction as a "footprint" of VH replacement. Such footprints can be used as markers to identify Ig heavy chain (IgH) genes potentially generated through VH replacement. To explore the contribution of VH replacement products to the antibody repertoire, we developed a Java-based computer program, VH replacement footprint analyzer-I (VHRFA-I), to analyze published or newly obtained IgH genes from human or mouse. The VHRFA-1 program has multiple functional modules: it first uses service provided by the IMGT/V-QUEST program to assign potential VH, DH, and JH germline genes; then, it searches for VH replacement footprint motifs within the VH-DH junction (N1) regions of IgH gene sequences to identify potential VH replacement products; it can also analyze the frequencies of VH replacement products in correlation with publications, keywords, or VH, DH, and JH gene usages, and mutation status; it can further analyze the amino acid usages encoded by the identified VH replacement footprints. In summary, this program provides a useful computation tool for exploring the biological significance of VH replacement products in human and mouse.

Keywords: B cell; IGH sequencing; IgH gene; RAG; VDJ rearrangement; VH replacement.


Figures

Figure 1
Figure 1
Overview of the VH replacement footprint analyzer-I (VHRFA-I) program. Diagram shows the workflow of the VHRFA-I Program. All the major functional modules are marked with numbers and their functional outcomes are indicated.
Figure 2
Figure 2
The front page of the VH replacement footprint analyzer-I (VHRFA-I) program. The VHRFA-I program contains multiple functional modules as listed as clickable bars on the front page.
Figure 3
Figure 3
The IMGT downloader. Diagram shows the interface of the IMGT Downloader. The IMGT Downloader allows users to use the IMGT/V-QUEST program to analyze large numbers of IgH gene sequences by uploading IgH sequences and downloading V-QUEST analysis results to a local computer. The user can specify human or mouse sequences (A), numbers of DH genes (default = 1) (B), number of accepted mutations in the 3′ VH region (C), DH region (D), and 5′ JH region (E). After these settings, the user can upload the IgH sequences (in FASTA file) (F) and specify the directory where the downloaded V-QUEST analysis Excel files can be stored (G). The analysis can be started by clicking the Upload sequences and start downloading Excel Files bar (H). The analysis progress (I) and message during the analysis (J) will also be shown. The V-QUEST analyses results of the test sequences are downloaded to a user specified location (K). The detailed results of sequence 1–50 are shown in the V-QUEST format (L).
Figure 4
Figure 4
The footprint analyzer. Diagram shows the interface of the Footprint Analyzer. The user can specify the species of the sequences (A), choose input Excel files downloaded from IMGT/V-QUEST (B), choose the source of footprints used to identify potential VH replacement products (C), set the criterion as to the minimum length of footprints (D), choose the CSV file for storing footprint analysis result (E), chose to store the used footprint file (F), specify the name and location of the used footprint file (G), exclude footprints with “GGG” sequence (H), start the analysis (I). The selected files for analysis will be shown in the window (J) (The Z417 test sequences), and analysis progress will be shown in a progress bar (K). The footprint analyses results will be saved in Excel format (L). The identified sequence with 5-mer footprint in the N1 region is highlighted in the red box. The identified footprint (GAGAA) in the N1 region is listed in Column T (N1 signature).
Figure 5
Figure 5
The publication analyzer. Diagram shows the interface of the Publication Analyzer. The user can choose the input GenBank file (A), start the publication analysis process (B). The number of GenBank records in association with each PubMed ID will be shown in the window area (C). By clicking on each GenBank ID, the abstract pages of selected PubMed IDs at the NCBI database can be opened (D); the GenBank IDs associated with selected PubMed IDs can be copied to the clipboard (E), the GenBank records associated with selected PubMed IDs can be saved (F), or the footprint analysis results associated with selected PubMed IDs can be saved in groups (G). The user can also choose the file containing VH replacement analysis results associated with the GenBank file (H).
Figure 6
Figure 6
The keyword analyzer. Diagram shows the interface of the Keyword Analyzer. (A) Textbox to choose the VH replacement footprint analysis result file. (B) Textbox to choose the GenBank file with the VH replacement footprint analysis result file. (C) Textbox to choose the output file. (D) Button to start the analysis process. (E) Window area to show the message during analysis progress. (F) Examples of list of keywords associated with the Z417 test sequences.
Figure 7
Figure 7
The keyword group picker. Diagram shows the interface of the Keyword Group Picker. (A) Textbox to select the footprint analysis result file. (B) Textbox to select the keyword analysis result file. (C) Button to move selected rows from (F) to (J). (D) Textbox for entering search string to locate keywords in (F). (E) Button to start locating keywords containing string in (D). (F) Window area containing contents of the keyword analysis result file. (G) Button to move selected rows from (J) to (F). (H) Button to select a keyword analysis result file so that keywords can be isolated, to repeat a previous pick. (I) Button to select keywords associated with entered GenBank ID. (J) Window area displaying the selected keywords. (K) Combo box to select the type of sequences to output. (L) Checkbox to indicate intention to dump footprint analysis result into a single sheet. (M) Textbox for entering the sheet name if (L) is selected. (N) Textbox for choosing the output file. (O) Button to start the pick/isolation process.
Figure 8
Figure 8
The amino acid contribution analyzer. Diagram shows the interface of the Amino Acid Contribution Analyzer. (A) Textbox for selecting the footprint analysis result file. (B) Textbox for selecting the output file. (C) Button for starting the analyzer. (D) A sample result showing the VH replacement footprints and amino acid residues encoded by the identified VH replacement footprints the test sequences.
Figure 9
Figure 9
The amino acid usage calculator. Diagram shows the interface of the Amino Acid Usage Calculator. (A) Button to choose the amino acid analysis result file. (B) Combo box for choosing the sheet to analyze. (C) Button to copy the name of the selected sheet to the clipboard. (D) Button to choose the output file. (E) Button to start the calculation process. (F) The output results of amino acid usage in Excel format. (G) Bar graph shows the amino acid usages.
Figure 10
Figure 10
The VDJ frequency calculator. Diagram shows the interface of the VDJ Frequency Calculator. (A) Button to select the input footprint analysis result file. (B) Combo box for selecting the sheet for processing, when an Excel file is selected as the input file. (C) Button to copy the value in (B) to clipboard. (D) Button to choose the output file. (E) Radio button group to select the sorting criterion for the output results. (F) Button to start the calculator. (G) The output results of VH gene usage in the test sequences were presented as a bar graph. (H) Distribution of the Z417 test IgH gene sequences with different CDR3 lengths.
Figure 11
Figure 11
The clonal stripper. Diagram shows the interface of the Clonal Stripper. (A) Button to choose the input footprint analysis result file, which can be CSV file generated by the footprint analyzer or Excel file generated by the Keyword Group Picker. (B) Combo box for selecting the sheet for analysis, if an Excel file is selected in (A). (C) Button to copy the name of selected sheet to the clipboard. (D) Button to choose the output file. (E) Button to start the stripping process.
Figure 12
Figure 12
The GenBank file tailor. Diagram shows the interface of the GenBank File Tailor. (A) Button to choose the footprint analysis result file. (B) Button to choose the input GenBank file for tailoring. (C) Button to choose the output file. (D) Button to start the tailoring process.
Figure 13
Figure 13
The mutation analyzer. Diagram shows the interface of the Mutation Analyzer. (A) Button to choose the Excel file as downloaded from IMGT/V-QUEST. (B) Window area for displaying selected Excel files. (C) Textbox for displaying path of output mutation result file. (D) Button for selecting output file displayed in (C). (E) Button to the start the analyzer. (F) Progress bar for showing the progress of analysis. (G) The mutation analysis results of the Z417 test sequences. Results show the sequence ID, V region, location of each mutation within V region, V region length, mutation number, and mutation rate.
Figure 14
Figure 14
The mutation matcher. Diagram shows the interface of the Mutation Matcher. (A) Button for choosing the footprint analysis result file. (B) Combo box for selecting a sheet if a Excel file is selected. (C) Button to copy the name of selected sheet to the clipboard. (D) Button to choose the mutation analysis result file from the Mutation Analyzer. (E) Button to choose the output file. (F) Textbox to set the maximum allowed mutation rate in the VH region. (G) Button to start the matching process. (H) The result file of the Z417 test sequences in Excel format.
Figure 15
Figure 15
The footprint result splitter. Diagram shows the interface of the Footprint Result Splitter. (A) Button to select the footprint analysis result file. (B) Button to select the output directory. (C) Radio button group to select the criterion for the splitting results, according to the V, D, or J gene family. (D) Button to start the splitting process. (E) The split results according to individual VH germline gene are deposited at a user specified location. (F) The example of VH replacement footprint analysis results of IgH genes using the VH1–69 gene (highlighted in red box).

Similar articles

Cited by

References

    1. Rajewsky K. Clonal selection and learning in the antibody system. Nature (1996) 381:751–810.1038/381751a0 - DOI - PubMed
    1. Jung D, Alt FW. Unraveling V(D)J recombination: insights into gene regulation. Cell (2004) 116:299–31110.1016/S0092-8674(04)00039-X - DOI - PubMed
    1. Oettinger MA, Schatz DG, Gorka C, Baltimore D. RAG-1 and RAG-2, adjacent genes that synergistically activate V(D)J recombination. Science (1990) 248:1517–2310.1126/science.2360047 - DOI - PubMed
    1. Schatz DG, Baltimore D. Stable expression of immunoglobulin gene V(D)J recombinase activity by gene transfer into 3T3 fibroblasts. Cell (1988) 53:107–1510.1016/0092-8674(88)90492-8 - DOI - PubMed
    1. Schatz DG, Oettinger MA, Baltimore D. The V(D)J recombination activating gene, RAG-1. Cell (1989) 59:1035–4810.1016/0092-8674(89)90760-5 - DOI - PubMed

LinkOut - more resources