. 2014 Jan 16;5(2):515-38.
doi: 10.1364/BOE.5.000515. eCollection 2014 Feb 1.

Fluorescence lifetime spectroscopy of tissue autofluorescence in normal and diseased colon measured ex vivo using a fiber-optic probe

Affiliations

Fluorescence lifetime spectroscopy of tissue autofluorescence in normal and diseased colon measured ex vivo using a fiber-optic probe

Sergio Coda et al. Biomed Opt Express. .

Abstract

We present an ex vivo study of temporally and spectrally resolved autofluorescence in a total of 47 endoscopic excision biopsy/resection specimens from colon, using pulsed excitation laser sources operating at wavelengths of 375 nm and 435 nm. A paired analysis of normal and neoplastic (adenomatous polyp) tissue specimens obtained from the same patient yielded a significant difference in the mean spectrally averaged autofluorescence lifetime -570 ± 740 ps (p = 0.021, n = 12). We also investigated the fluorescence signature of non-neoplastic polyps (n = 6) and inflammatory bowel disease (n = 4) compared to normal tissue in a small number of specimens.

Keywords: (120.3890) Medical optics instrumentation; (170.2680) Gastrointestinal; (170.3650) Lifetime-based sensing; (300.6500) Spectroscopy, time-resolved; (300.6540) Spectroscopy, ultraviolet; (300.6550) Spectroscopy, visible.


Figures

Fig. 1
Fig. 1
Optical configuration of the fiber-optic probe-based fluorescence lifetime spectroscopy system. Insets show the arrangement of the optical fibers in the custom fiber bundle at the distal end of the probe and at the output of the fluorescence detection branch of the proximal end of the probe. Cores shown in green are fluorescence detection fibers; fibers colored blue are used to deliver the laser excitation; the orange and red cores were unused in this study.
Fig. 2
Fig. 2
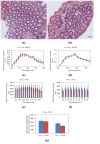
Summary of results from normal tissues grouped according to whether the patient was diagnosed with a polyp (n = 13) or IBD (n = 4). (a & b) Exemplar H&E stained histological sections of a biopsy sample of normal colon from a patient diagnosed with a polyp (a) and IBD (b). Scale bar represents 100 μm, see text for description of arrowheads. (c) & (d) show the mean fluorescence emission spectra obtained with 375 and 435 nm excitation, respectively. (e) & (f) show the spectrally resolved fluorescence lifetimes for 375 and 435 nm excitation, respectively. (g) shows the spectrally averaged mean fluorescence lifetimes for both groups and for both excitation wavelengths. The error bars represent ± 1 standard deviation in all panels.
Fig. 3
Fig. 3
Summary of results from normal tissues grouped according to the location that the specimen was taken from. The number of specimens in each group was: rectum (n = 2), left (n = 8), transverse (n = 5), right (n = 3). (a) & (b) show the mean fluorescence emission spectra obtained with 375 and 435 nm excitation respectively. (c) shows the spectrally averaged mean fluorescence lifetimes for both groups and for both excitation wavelengths. The error bars represent ± 1 standard deviation in all panels.
Fig. 4
Fig. 4
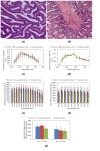
Comparison of normal tissue versus neoplastic and non-neoplastic polyp specimens. (a) & (b) show exemplar H&E stained histological sections of (a) neoplastic (adenomatous polyp) and (b) non-neoplastic (hyperplastic polyp) polyps, respectively. Scale bar represents 100 μm, see text for description of arrowheads and asterisks. (c) & (d) show the mean fluorescence emission spectra obtained with 375 and 435 nm excitation, respectively. (e) & (f) show the spectrally resolved fluorescence lifetimes with 375 and 435 nm excitation, respectively. (g) shows the spectrally averaged mean fluorescence lifetimes for all three groups and for both excitation wavelengths. The error bars represent ± 1 standard deviation in all panels.
Fig. 5
Fig. 5
Shift in the spectrally averaged mean fluorescence lifetime for (a) 375 nm and (b) 435 nm excitation of neoplastic (red) and non-neoplastic polyp (green) specimens. Lifetime shifts are calculated using a measurement of normal tissue obtained from the same or nearest region of colon (paired analysis).
Fig. 6
Fig. 6
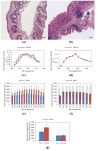
Comparison of normal tissue and IBD specimens. (a) & (b) show an exemplar H&E stained histological sections of biopsy samples obtained from one patient of (a) normal colonic mucosa and (b) IBD tissue (ulcerative colitis) respectively. Scale bar represents 100 μm, see text for description of arrowheads. (c) & (d) show the mean normalized fluorescence emission spectra obtained with 375 nm and 435 nm excitation, respectively. (e) & (f) show the spectrally resolved mean fluorescence lifetimes with 375 nm and 435 nm excitation, respectively. (g) shows the spectrally averaged mean fluorescence lifetime for both groups and for both excitation wavelengths. The spectrally averaged mean fluorescence lifetime for 375 nm excitation was obtained using the emission spectral range 494-556 nm. The error bars represent ± 1 standard deviation in all panels.
Fig. 7
Fig. 7
Bar graphs showing the shift in the spectrally averaged mean fluorescence lifetime observed in all IBD samples relative to a sample of healthy tissue from the same patient. (a) & (b) show lifetime shifts obtained with 375 nm and 435 nm excitation respectively. The lifetime shift for 375 nm excitation was obtained using the spectrally averaged mean lifetime calculated over the emission spectral range 494-556 nm.
Fig. 8
Fig. 8
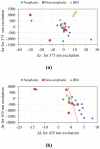
Summary of all measured shifts in mean fluorescence emission wavelength and spectrally averaged mean fluorescence lifetime for (a) 375 nm and (b) 435 nm excitation wavelengths. The lifetime shift for 375 nm excitation was obtained using the spectrally averaged mean lifetime calculated over the emission spectral range 494-556 nm for all points.

References

    1. Lambert R., Saito H., Saito Y., “High-resolution endoscopy and early gastrointestinal cancer...dawn in the East,” Endoscopy 39(3), 232–237 (2007).10.1055/s-2006-945109 - DOI - PubMed
    1. P. Boyle and B. Levin, World Cancer Report 2008 (World Health Organisation - International Agency for Research on Cancer, Geneva, 2008).
    1. Taplin S. H., Barlow W., Urban N., Mandelson M. T., Timlin D. J., Ichikawa L., Nefcy P., “Stage, age, comorbidity, and direct costs of colon, prostate, and breast cancer care,” J. Natl. Cancer Inst. 87(6), 417–426 (1995).10.1093/jnci/87.6.417 - DOI - PubMed
    1. Vogelstein B., Fearon E. R., Hamilton S. R., Kern S. E., Preisinger A. C., Leppert M., Nakamura Y., White R., Smits A. M., Bos J. L., “Genetic Alterations during Colorectal-Tumor Development,” N. Engl. J. Med. 319(9), 525–532 (1988).10.1056/NEJM198809013190901 - DOI - PubMed
    1. Rex D. K., “Risks and potential cost savings of not sending diminutive polyps for histologic examination,” Gastroenterol Hepatol (N Y) 8(2), 128–130 (2012). - PMC - PubMed