. 2014 Feb 24;28(4):459-73.
doi: 10.1016/j.devcel.2014.01.020.

A regulatory network of Drosophila germline stem cell self-renewal

Affiliations

A regulatory network of Drosophila germline stem cell self-renewal

Dong Yan et al. Dev Cell. .

Abstract

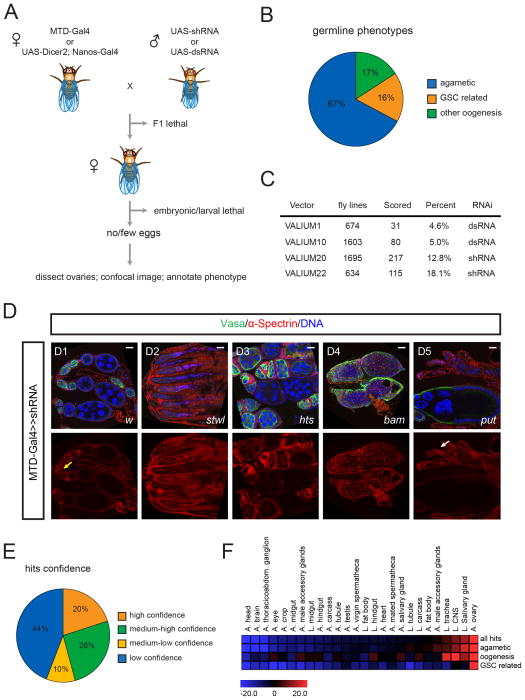
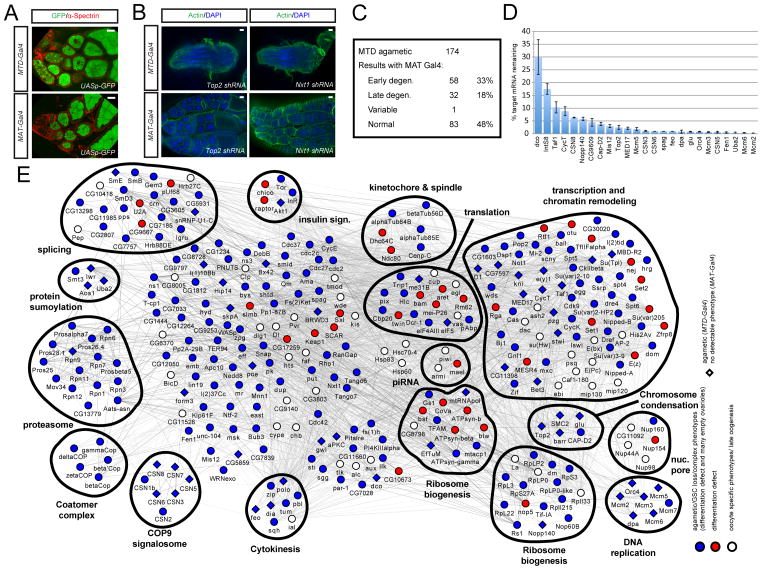
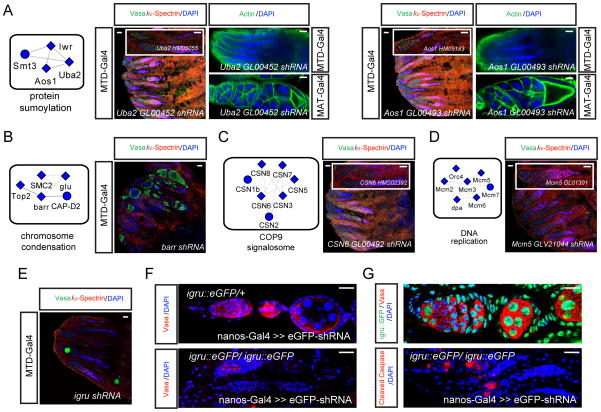
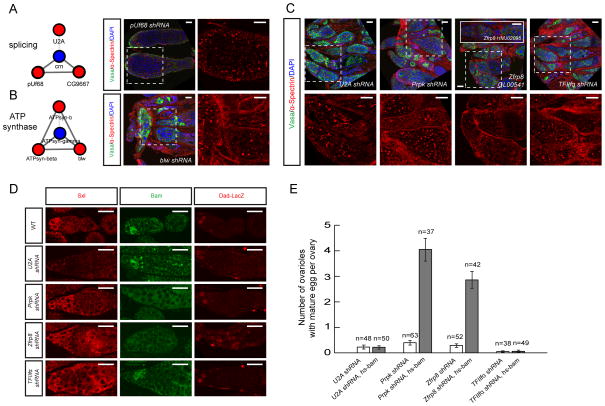
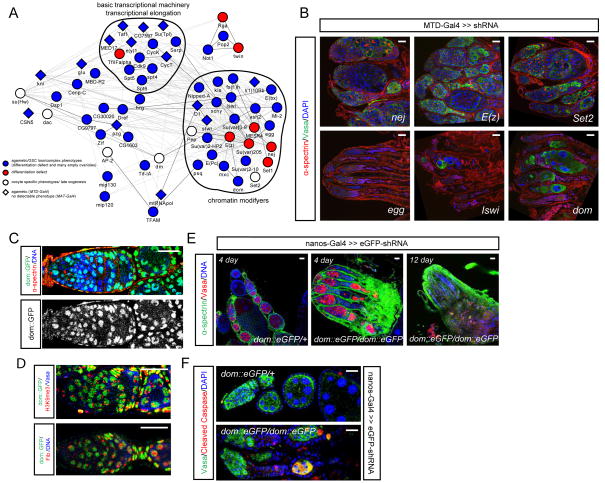
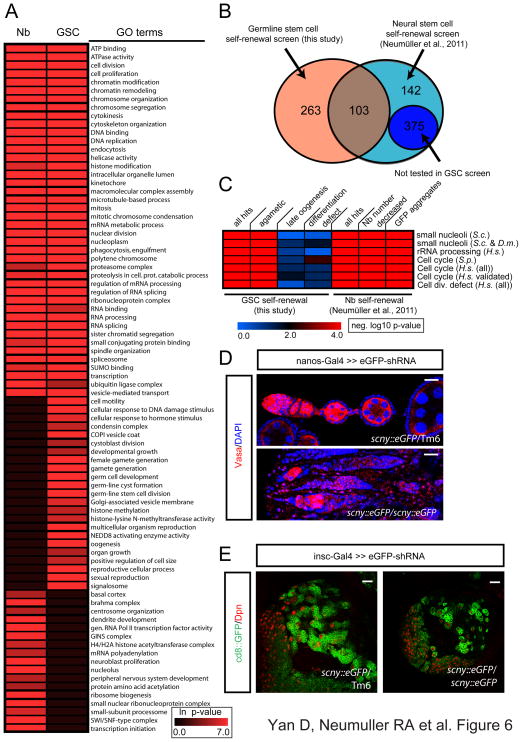
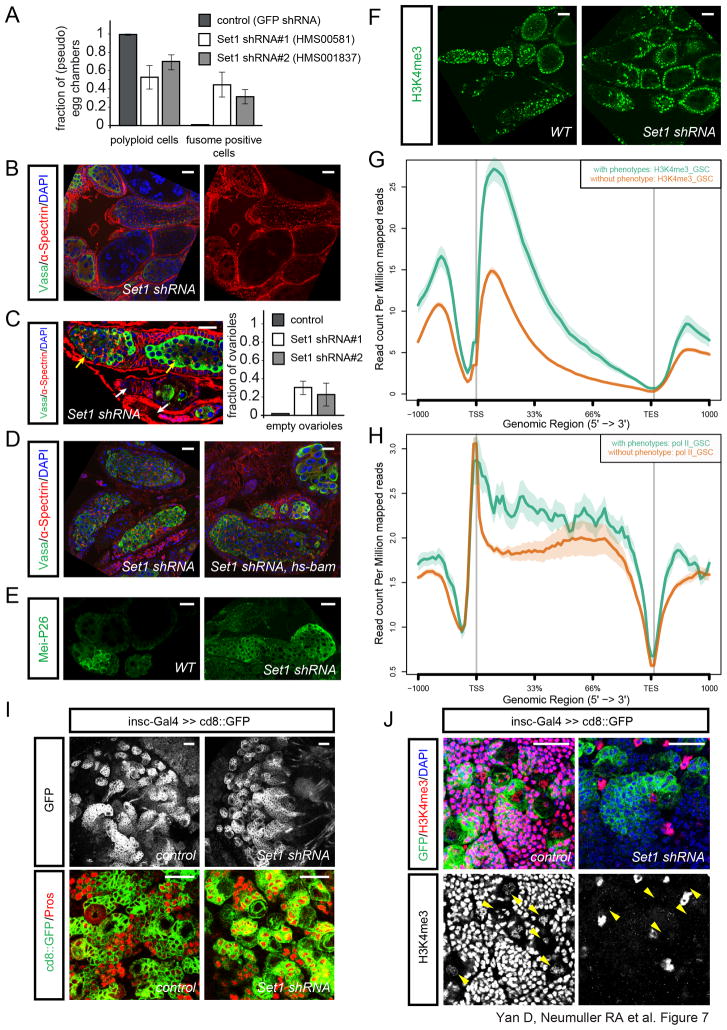
Stem cells possess the capacity to generate two cells of distinct fate upon division: one cell retaining stem cell identity and the other cell destined to differentiate. These cell fates are established by cell-type-specific genetic networks. To comprehensively identify components of these networks, we performed a large-scale RNAi screen in Drosophila female germline stem cells (GSCs) covering ∼25% of the genome. The screen identified 366 genes that affect GSC maintenance, differentiation, or other processes involved in oogenesis. Comparison of GSC regulators with neural stem cell self-renewal factors identifies common and cell-type-specific self-renewal genes. Importantly, we identify the histone methyltransferase Set1 as a GSC-specific self-renewal factor. Loss of Set1 in neural stem cells does not affect cell fate decisions, suggesting a differential requirement of H3K4me3 in different stem cell lineages. Altogether, our study provides a resource that will help to further dissect the networks underlying stem cell self-renewal.


Figures

Figure 1
Figure 1. Transgenic RNAi screen
(A) Workflow of the germline RNAi screen. (See Table S1) (B) F1 females with no eggs or few eggs were dissected and ovaries were analyzed by confocal microscopy. The phenotypes were divided into three categories: agametic, GSC-related, and other oogenesis. (C) Summary of the screen results. (D) D1-D5, ovaries expressing shRNAs targeting w, stwl, hts, bam, or put by MTD-Gal4 stained for α-Spectrin, Vasa and DAPI. Yellow arrow indicates germline stem cells. White arrow points to empty germarium. (See Figure S1). (E) Confidence of identified 366 genes from the screen. High confidence genes are identified by >2 independent RNAi lines; medium-high confident genes are identified by one RNAi line but they co-complex with high confidence hits; medium-low confidence genes are identified by one RNAi line but they co-complex with other low confidence hits; low confidence hits are identified by one RNAi only (Complexes are identified by COMPLEAT and listed in table S2). (F) Heat map showing over- and underrepresentation of tissue-specific gene sets (as defined by their expression levels in the listed tissues) in three phenotypic categories found in the screen (Figure 1B). Color code represents Z-score with colors from blue (underrepresented) to red (overrepresented). Scale bars: 20 μm.
Figure 2
Figure 2. Quality control and regulatory network for genes identified from the screen
(A) Expression patterns of UASp-GFP using the MTD-Gal4 or MAT-Gal4 drivers. (B) Examples of the MAT screen. Top2 or Nxt1 shRNA is induced by MTD-Gal4 or MAT-Gal4 and the ovaries are stained for actin and DAPI. Both shRNAs result in agametic phenotypes with MTD-Gal4; but Top2 shRNA produce normal eggs with MAT-Gal4 while Nxt1 is still defective with MAT-Gal4. (C) Summary of the secondary MAT-Gal4 screen of 174 agametic lines. 83 (48%) of the RNAi lines produce normal eggs with MAT-Gal4, indicating that these genes have GSC- or cystocyte-specific functions. (D) qPCR experiments assessing the knockdown efficiency of a select set of shRNAs in 0–4 hr eggs laid from MAT-Gal4/shRNA females. Twenty-five genes are ranked according to the degree of knockdown. x-axis: genes tested; y-axis: % target mRNA remaining. Data are means ± s.e.m. (See Figure S2) (E) Network of genes identified by the germline screen. Genes are shown as nodes and the node color and shape indicate the observed phenotype in the screen. Red circle: differentiation defect; blue circle: agametic/stem cell loss; white circle: other oogenesis defects; blue diamond: agametic (MAT normal). Overall, red genes represent those required for GSC differentiation, and blue ones are those required for GSC maintenance. The edges denote the interactions of the genes and are represented in different grey tones: light edges are text mining/ genetic interaction based and dark edges represent PPI data. Scale bars: 20 μm.
Figure 3
Figure 3. Genes and complexes required for GSC maintenance
(A–D) Identified protein complexes required for GSC maintenance (Figure S3, Table S2). Complexes are enlarged from Figure 2E. RNAi against one representative gene from each complex is shown and other genes in the complex have a similar phenotype when knocked down by RNAi. (A) Knockdown of Uba2 or Aos1 by two independent RNAi constructs using MTD-Gal4 or UAS-dcr2; nanos-Gal4 results in a depletion of the germline. MAT-Gal4 mediated knockdown of these genes does not induce an obvious phenotype at later stages of oogenesis. (B-D) Knockdown of members of the respective complex members results in a depletion of the germline. Independent shRNA constructs are shown in inserts. (E) Knockdown of igru (CG11266) with MTD-Gal4 results in a depletion of the germline. (F) Trap-mediated loss-of-function validates the loss of vasa-positive germline cells upon loss of igru function. (G) igru::GFP is expressed throughout the germline including high level expression in GSCs and low expression levels in the cystocyte region (top panel). Remaining germline cells stain positive for Vasa and cleaved Caspase (lower panel). Scale bars: 20 μm.
Figure 4
Figure 4. Genes and complexes required for GSC differentiation
(A–B) Identified protein complexes required for GSC differentiation. RNAi against one representative gene from each complex is shown. Ovaries expressing RNAi targeting pUf68 and blw are stained for α-Spectrin, Vasa and DAPI. Areas marked by the dashed squares are enlarged. (C) shRNAs against U2A, Prpk, zfrp8 or TFIIfα expressed by MTD-Gal4 lead to strong differentiation defects. Ovaries are stained for α-Spectrin, Vasa and DAPI and Zfrp8 phenotype is confirmed by two independent shRNAs. (D) Ovaries expressing U2A, Prpk, zfrp8 or TFIIfα shRNAs are stained for Sxl, Bam or Dad-lacZ. Sxl and Bam experiments are driven by MTD-Gal4, and Dad-lacZ experiments are driven by nanos-Gal4. (E) Quantification of hs-bam rescue experiments. shRNAs against U2A, Prpk, zfrp8 or TFIIfα expressed using nanos-Gal4 with or without hs-bam expression. The number of ovarioles with mature egg per ovary is shown and n is number of ovaries examined. Data are mean ± s.e.m. Representative ovary images are shown in Figure S4C. Scale bars: 20 μm.
Figure 5
Figure 5. Transcription factor network regulating GSC self-renewal
(A) Network for transcription factors and chromatin regulators identified from our screen. Nodes and edges are represented the same as those in Figure 2E. (B) shRNAs are expressed using MTD-Gal4 and ovaries stained for α-Spectrin, Vasa and DAPI. shRNAs against nej, E(z) and Set2 cause differentiation defects, while shRNAs against egg, Iswi and dom result in agametic or stem-cell-loss phenotype. (See Figure S5 for additional examples). (C) dom-eGFP protein trap ovaries stained for α-Spectrin and DAPI show the expression pattern of Dom. (D) dom-eGFP ovaries stained for Fibrillarin or H3K9me3. (E) Ovaries expressing eGFP shRNA using nanos-Gal4 in the dom-eGFP heterozygous or homozygous background are stained for α-Spectrin,Vasa and DAPI. Days indicate time after eclosion. Germ cells are lost in dom loss-of-function after 12 days compared to wild type (data not shown). (F) Ovaries expressing eGFP shRNA using nanos-Gal4 in the dom-eGFP heterozygous or homozygous background are stained for cleaved Caspase, Vasa and DAPI. Scale bars: 20 μm.
Figure 6
Figure 6. Comparison of GSC and the neural stem cell RNAi screens
(A) Heat map displaying overrepresentation of selected GO terms in genes identified in the GSC and the Nb screen. (B) Number of genes identified in the GSC and Nb screen. 103 genes were found in both screens. Note that 375 identified genes in Nb screen were not tested in the germline screen (See Table S1 for the detailed list of genes). (C) Comparative gene set enrichment between GSCs and Nbs of genes associated with small nucleoli, rRNA processing defects and cell division defects in the respective phenotypic categories. (D) Ovaries expressing eGFP shRNA using nanos-Gal4 in the protein trap scny-eGFP heterozygous or homozygous background stained for Vasa and DAPI. (scny shRNA phenotypes are shown in Figure S6C). (E) Larval brains expressing eGFP shRNA using insc-Gal4≫CD8::GFP in the scny-eGFP heterozygous or homozygous background stained for Nb marker Dpn (Note: the eGFP shRNA does not target CD8::GFP). Scale bars: 20 μm.
Figure 7
Figure 7. Set1 regulates GSC but not Nb self-renewal
(A) Quantification of the Set1 loss of function phenotype in the germline by MTD-Gal4 (bars represent the mean+/− S.D. of the observed frequencies (n=175 pseudo egg chambers (HMS00581), n=105 pseudo egg chmbers (HMS001837)). (B) Ovaries expressing Set1 shRNA (HMS00581) by MTD-Gal4 are labeled by α-Spectrin, Vasa and DAPI staining. (C) Co-occurrence of pseudo egg chambers filled with undifferentiated fusome containing cells (yellow arrows) and empty ovarioles (white arrows) in MTD/Set1 shRNA ovaries. Quantification of the empty ovariole phenotype (bars represent the mean+/− S.D. of the observed frequencies (n=74 ovarioles (HMS00581), n=55 ovarioles (HMS001837)). (D) Overexpressing bam using hs-bam fails to fully rescue the differentiation defects in Set1 shRNA/nanos-Gal4 background, as shown by α-Spectrin, Vasa and DAPI staining. (E) Mei-P26 antibody staining in WT and Set1 shRNA/MTD-Gal4 ovaries. (F) H3K4me3 staining in WT and Set1 shRNA/MTD-Gal4 ovaries. (G) H3K4me3 ChIP from FACS purified GSCs showing increased levels of lysine4 tri-methylation at genes with a phenotype (green) in our screen over genes without a detectable phenotype (brown). x-axis depicts 1000 bp upstream of the transcriptional start site (TSS), the length of the gene bodies in percentage, the transcriptional end site (TES) and 1000 bp downstream. (See Figure S7 for further ChIP results and phenotypic characterization of Set1 loss-of-function) (H) Pol II ChIP from FACS purified GSCs showing an increased association of Pol II at genes with a phenotype (green) in our screen over genes without a detectable phenotype (brown). x-axis depicts 1000 bp upstream of the transcriptional start site (TSS), the length of the gene bodies in percentage, the transcriptional end site (TES) and 1000 bp downstream. (I–J) Larval brains expressing Set1 shRNA, or no RNAi (control) using insc-Gal4≫CD8::GFP stained by neuronal marker Pros (I), or H3K4me3 and DAPI (J). Yellow arrowheads point to Nbs. Scale bars: 20 μm.

Similar articles

Cited by

References

    1. Ardehali MB, Mei A, Zobeck KL, Caron M, Lis JT, Kusch T. Drosophila Set1 is the major histone H3 lysine 4 trimethyltransferase with role in transcription. EMBO J. 2011;30:2817–2828. - PMC - PubMed
    1. Buszczak M, Paterno S, Lighthouse D, Bachman J, Planck J, Owen S, Skora AD, Nystul TG, Ohlstein B, Allen A, et al. The carnegie protein trap library: a versatile tool for Drosophila developmental studies. Genetics. 2007;175:1505–1531. - PMC - PubMed
    1. Buszczak M, Paterno S, Spradling AC. Drosophila stem cells share a common requirement for the histone H2B ubiquitin protease scrawny. Science. 2009;323:248–251. - PMC - PubMed
    1. Chau J, Kulnane LS, Salz HK. Sex-lethal facilitates the transition from germline stem cell to committed daughter cell in the Drosophila ovary. Genetics. 2009;182:121–132. - PMC - PubMed
    1. Chau J, Kulnane LS, Salz HK. Sex-lethal enables germline stem cell differentiation by down-regulating Nanos protein levels during Drosophila oogenesis. Proc Natl Acad Sci U S A. 2012;109:9465–9470. - PMC - PubMed

Publication types

Substances

LinkOut - more resources