

Summer increase of Legionnaires' disease 2010 in The Netherlands associated with weather conditions and implications for source finding
- PMID: 24576486
- PMCID: PMC9151314
- DOI: 10.1017/S0950268813003476
Summer increase of Legionnaires' disease 2010 in The Netherlands associated with weather conditions and implications for source finding
Abstract
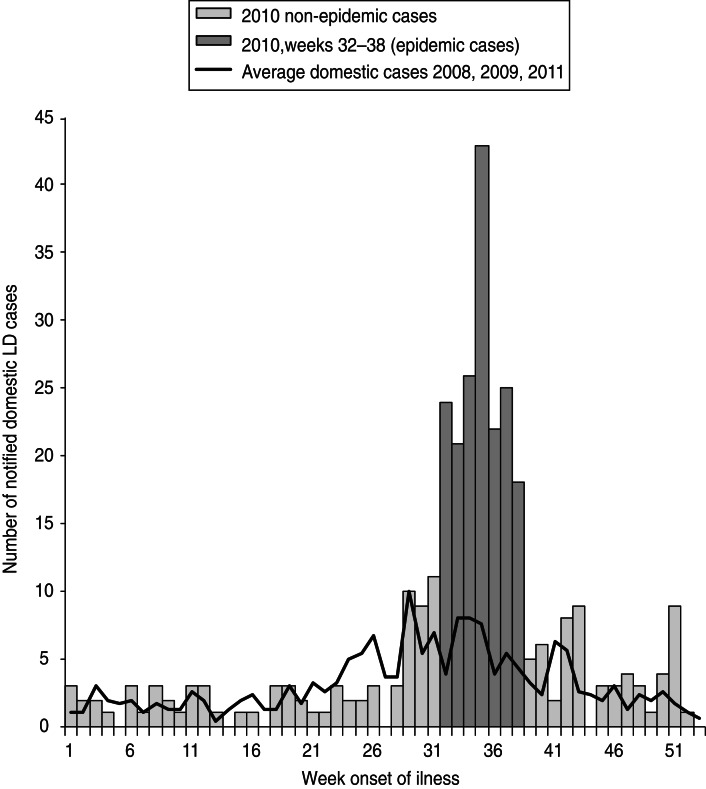
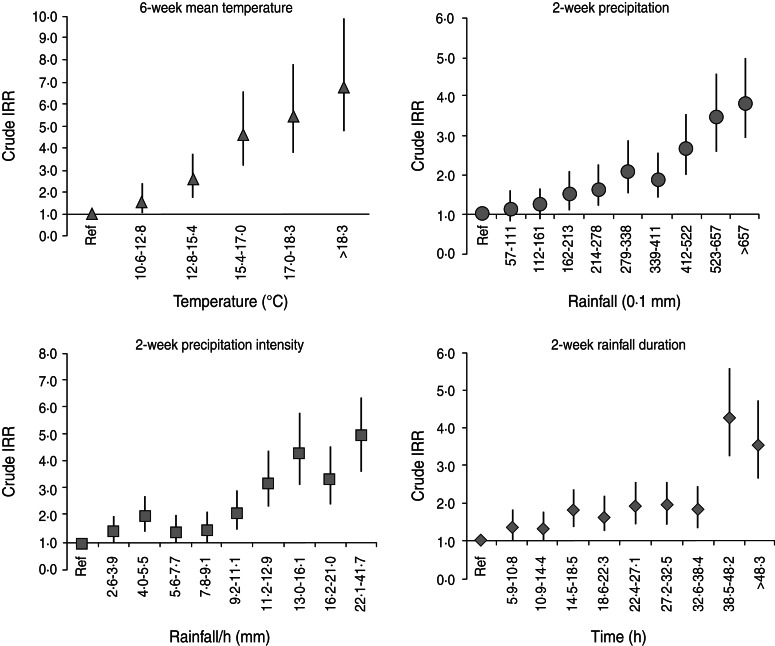
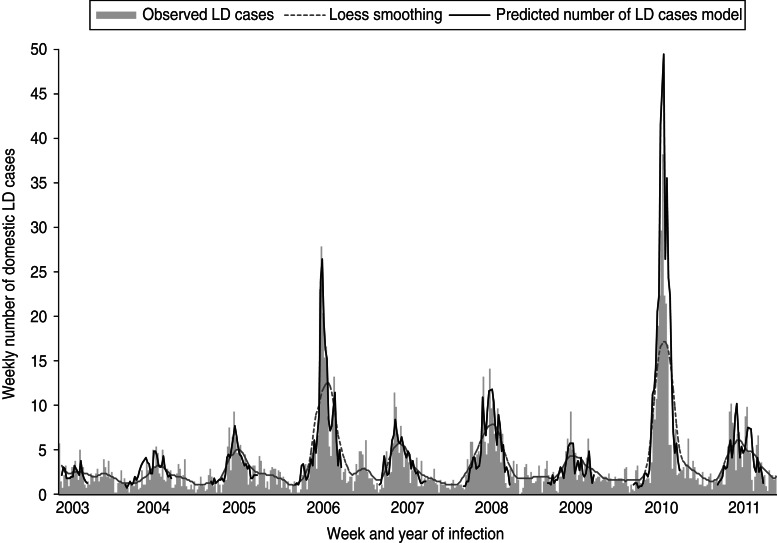
During August and September 2010 an unexpected high number of domestic cases of Legionnaires' disease (LD) were reported in The Netherlands. To examine this increase, patient characteristics and results of source finding and environmental sampling during the summer peak were compared to other domestic cases in 2008-2011. This analysis did not provide an explanation for the rise in cases. A similar increase in LD cases in 2006 was shown to be associated with warm and wet weather conditions, using an extended Poisson regression model with adjustment for long-term trends. This model was optimized with the new data from 2008 to 2011. The increase in 2010 was very accurately described by a model, which included temperature in the preceding 4 weeks, and precipitation in the preceding 2 weeks. These results confirm the strong association of LD incidence with weather conditions, but it remains unclear which environmental sources contributed to the 2010 summer increase.
Figures
Similar articles
-
The association between sporadic Legionnaires' disease and weather and environmental factors, Minnesota, 2011-2018.Epidemiol Infect. 2020 Jun 29;148:e156. doi: 10.1017/S0950268820001417. Epidemiol Infect. 2020. PMID: 32594925 Free PMC article.
-
Warm, wet weather associated with increased Legionnaires' disease incidence in The Netherlands.Epidemiol Infect. 2009 Feb;137(2):181-7. doi: 10.1017/S095026880800099X. Epub 2008 Jul 17. Epidemiol Infect. 2009. PMID: 18631425
-
Diagnostic testing for Legionnaires' disease in the Netherlands between 2007 and 2009: a possible cause for the decline in reported Legionnaires' disease patients.Eur J Clin Microbiol Infect Dis. 2012 Aug;31(8):1969-74. doi: 10.1007/s10096-011-1528-z. Epub 2012 Jan 13. Eur J Clin Microbiol Infect Dis. 2012. PMID: 22246510
-
Meteorological conditions and Legionnaires' disease sporadic cases-a systematic review.Environ Res. 2022 Nov;214(Pt 4):114080. doi: 10.1016/j.envres.2022.114080. Epub 2022 Aug 11. Environ Res. 2022. PMID: 35964674
-
Legionnaires' disease in France.Med Mal Infect. 2015 Mar;45(3):65-71. doi: 10.1016/j.medmal.2015.01.015. Epub 2015 Feb 24. Med Mal Infect. 2015. PMID: 25722040 Review.
Cited by
-
Short-term effects of atmospheric pressure, temperature, and rainfall on notification rate of community-acquired Legionnaires' disease in four European countries.Epidemiol Infect. 2016 Dec;144(16):3483-3493. doi: 10.1017/S0950268816001874. Epub 2016 Aug 30. Epidemiol Infect. 2016. PMID: 27572105 Free PMC article.
-
The association between sporadic Legionnaires' disease and weather and environmental factors, Minnesota, 2011-2018.Epidemiol Infect. 2020 Jun 29;148:e156. doi: 10.1017/S0950268820001417. Epidemiol Infect. 2020. PMID: 32594925 Free PMC article.
-
Legionnaires' disease in the EU/EEA*: increasing trend from 2017 to 2019.Euro Surveill. 2023 Mar;28(11):2200114. doi: 10.2807/1560-7917.ES.2023.28.11.2200114. Euro Surveill. 2023. PMID: 36927719 Free PMC article.
-
Present-day monitoring underestimates the risk of exposure to pathogenic bacteria from cold water storage tanks.PLoS One. 2018 Apr 12;13(4):e0195635. doi: 10.1371/journal.pone.0195635. eCollection 2018. PLoS One. 2018. PMID: 29649274 Free PMC article.
-
Impact of climate change on waterborne infections and intoxications.J Health Monit. 2023 Jun 1;8(Suppl 3):62-77. doi: 10.25646/11402. eCollection 2023 Jun. J Health Monit. 2023. PMID: 37342430 Free PMC article.
References
-
- Vergis EN, Akbas E, Yu VL. Legionella as a cause of severe pneumonia. Seminars in Respiratory and Critical Care Medicine 2000; 21: 295–304. - PubMed
-
- Greig JE, et al. An outbreak of Legionnaires'disease at the Melbourne Aquarium, April 2000: Investigation and case-control studies. Medical Journal of Australia 2004; 180: 566–572. - PubMed
-
- Yu VL, et al. Distribution of Legionella species and serogroups isolated by culture in patients with sporadic community-acquired legionellosis: an international collaborative survey. Journal of Infectious Diseases 2002; 186: 127–128. - PubMed
-
- Bartram J, et al. Legionella and the Prevention of Legionellosis. Geneva: World Health Organization, 2007.
Publication types
MeSH terms
LinkOut - more resources
Full Text Sources
Other Literature Sources
Medical
Research Materials
