. 2014;36(1):44-63.
doi: 10.1159/000357840. Epub 2014 Feb 26.

Developmental and adult GAP-43 deficiency in mice dynamically alters hippocampal neurogenesis and mossy fiber volume

Affiliations

Developmental and adult GAP-43 deficiency in mice dynamically alters hippocampal neurogenesis and mossy fiber volume

Sarah E Latchney et al. Dev Neurosci. 2014.

Abstract

Growth-associated protein-43 (GAP-43) is a presynaptic protein that plays key roles in axonal growth and guidance and in modulating synapse formation. Previous work has demonstrated that mice lacking one allele of this gene (GAP-43+/- mice) exhibit hippocampal structural abnormalities, impaired spatial learning and stress-induced behavioral withdrawal and anxiety, behaviors that are dependent on proper hippocampal circuitry and function. Given the correlation between hippocampal function, synaptic connectivity and neurogenesis, we tested if behaviorally naïve GAP-43+/- mice had alterations in either neurogenesis or synaptic connectivity in the hippocampus during early postnatal development and young adulthood, and following behavior testing in older adults. To test our hypothesis, we examined hippocampal cell proliferation (Ki67), number of immature neuroblasts (doublecortin, DCX) and mossy fiber volume (synaptoporin) in behaviorally naïve postnatal day 9 (P9) and P26, and behaviorally experienced 5- to 7-month-old GAP-43+/- and +/+ littermate mice. P9 GAP-43+/- mice had fewer Ki67+ and DCX+ cells compared to +/+ mice, particularly in the posterior dentate gyrus, and smaller mossy fiber volume in the same region. In young adulthood, however, male GAP-43+/- mice had more Ki67+ and DCX+ cells and greater mossy fiber volume in the posterior dentate gyrus relative to male +/+ mice. These increases were not seen in females. In 5- to 7-month-old GAP-43+/- mice (whose behaviors were the focus of our prior publication), there was no global change in the number of proliferating or immature neurons relative to +/+ mice. However, more detailed analysis revealed fewer proliferative DCX+ cells in the anterior dentate gyrus of male GAP-43+/- mice compared to male +/+ mice. This reduction was not observed in females. These results suggest that young GAP-43+/- mice have decreased hippocampal neurogenesis and synaptic connectivity, but slightly older mice have greater hippocampal neurogenesis and synaptic connectivity. In conjunction with our previous study, these findings suggest that GAP-43 is dynamically involved in early postnatal and adult hippocampal neurogenesis and synaptic connectivity, possibly contributing to the GAP-43+/- behavioral phenotype.


Figures

Figure 1
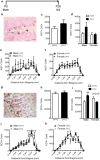
Figure 1. P9 GAP-43(+/-) mice have reduced indices of hippocampal neurogenesis
(a) Experimental timeline. Behaviorally-naïve GAP-43(+/+) and (+/-) mice were killed at P9. (b) Representative photomicrograph of dentate gyrus counterstained with Fast Red (pink) and immunostained with an antibody against Ki67 (brown). (c,d) Ki67+ cell number in GAP-43(+/-) vs. (+/+) mice examined (c) as total number of cells and (d) over the rostro-caudal axis of the dentate gyrus. (e) Representative merged 3D projection image of dentate gyrus immunostained with antibodies against Ki67 (red) and pHisH3 (green). (f, g) The number of single-labeled Ki67+pHisH3- (f) and the proportion of Ki67+ cells that are pHisH3+ (g) in GAP-43(+/-) vs. (+/+) mice. (h) Representative photomicrograph of dentate gyrus counterstained with Fast Red (pink) and immunostained with an antibody against DCX (brown). (i,j) DCX+ cell number in GAP-43(+/-) vs. (+/+) mice examined (i) as total number of cells and (j) over the rostro-caudal axis of the dentate gyrus. Data expressed as means±SEM, n=5/genotype. (c,f,g,i) analyzed by Student's t-test. (d,j) analyzed by 2-way ANOVA with Sidak posthoc test. *p<0.05, **p<0.01 vs. (+/+). Scale bars (b,e,h)= 10μm.
Figure 2
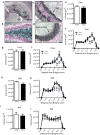
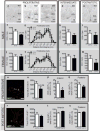
Figure 2. P9 GAP-43(+/-) mice exhibit regional reductions in mossy fiber volume
(a) Representative low magnification image of the hippocampus counterstained with Fast Red (pink) and immunostained with an antibody against synaptoporin (blue-black). (b-d) Representative high magnification images of the (b) hilus, (c) SMF and IMF, and (d) SMF at CA3. (e-l) Mossy fiber volume in GAP-43(+/+) and (+/-) mice over the entire GCL (e), in the GCL across Bregma (f), in the entire hilus (g), SMF (h), and IMF (i), and across Bregma in the hilus (j), SMF (k), IMF (l). Data expressed as means±SEM with n=5/genotype. (e,g,h,i) analyzed by Student's t-test. (f,j,k,l) analyzed by 2-way ANOVA with Sidak posthoc test. *p<0.05, **p<0.01 vs. (+/+). Scale bars: (a)=100μm, (b-d)=25μm.
Figure 3
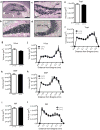
Figure 3. Male P26 GAP-43(+/-) mice have increased indices of neurogenesis
(a) Experimental timeline. Behaviorally-naïve GAP-43(+/+) and (+/-) mice were killed at P26. (b) Representative photomicrograph of dentate gyrus counterstained with Fast Red (pink) and immunostained with an antibody against Ki67 (brown). (c-f) Ki67+ cell number in GAP-43(+/-) and (+/+) mice examined (c) as total number of cells, (d) by sex and genotype, or (e-f) over the rostro-caudal axis of the dentate gyrus. (g) Representative photomicrograph of dentate gyrus counterstained with Fast Red (pink) and immunostained with an antibody against DCX (brown). (h-k) DCX+ cell number in GAP-43(+/-) and (+/+) mice when examined (h) as total number cells, (i) by sex and genotype, (j,k) and across Bregma in male (j) and female (k) mice. Data expressed as means ± SEM, n=5-9/group. (c,h) analyzed by Student's t-test. (d,e,f,i,j,k) analyzed by 2-way ANOVA with Sidak posthoc test. *p<0.05, **p<0.01 vs. (+/+). Scale bars: (b,g)=20μm.
Figure 4
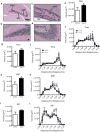
Figure 4. Male P26 GAP-43(+/-) mice have increased mossy fiber volume in the posterior dentate gyrus
(a) Representative low magnification image of the hippocampus counterstained with Fast Red (pink) and immunostained with an antibody against synaptoporin (blue-black). (b-d) Representative high magnification images of the (b) hilus, (c) SMF and IMF, and (d) SMF at CA3. (e-l) Mossy fiber volume in male GAP-43(+/+) and (+/-) mice over the entire GCL (e), in the GCL across Bregma (f), in the entire hilus (g), SMF (h), and IMF (i), and across Bregma in the hilus (j), SMF (k), IMF (l). Data expressed as means±SEM, n=5-7/genotype. (e,g,h,i) analyzed by Student's t-test. (f,j,k,l) analyzed by 2-way ANOVA with Sidak posthoc test. *p<0.05 vs. (+/+). Scale bars: (a)=100μm, (b-d)=25μm.
Figure 5
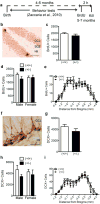
Figure 5. Behaviorally-experienced adult GAP-43(+/-) mice exhibit regionally-specific reduction in a key index of neurogenesis
(a) Experimental timeline. Behavior tests as described in Zaccaria, et al. [17] were performed on male and female GAP-43(+/-) and (+/+) littermates beginning at 4-6 months of age. Following the completion of behavioral tests (5-7 months of age), mice received one BrdU injection (150 mg/kg, i.p.) 2 h prior to sacrifice. (b) Representative photomicrograph of dentate gyrus counterstained with Fast Red (pink) and immunostained with an antibody against BrdU (brown). (c-e) BrdU+ proliferating cells in GAP-43(+/-) and (+/+) mice examined (c) as total number cells, (d) by sex and genotype, or (e) over the rostro-caudal axis of the dentate gyrus. (f) Representative photomicrograph of dentate gyrus counterstained with Fast Red (pink) and immunostaining with an antibody against DCX (brown). (g-i) DCX+ cell number in GAP-43(+/-) and (+/+) mice examined (g) as total number of cells, (h) when analyzed by sex and genotype, or (i) over the rostro-caudal axis of the dentate gyrus (h). Data expressed as means±SEM, n=7/group. (c,g) analyzed by Student's t-test. (d,e,h,i,) analyzed by 2-way ANOVA with Sidak posthoc test. Scale bars: (b,f)=50μm.
Figure 6
Figure 6. Behaviorally-experienced adult male, but not female, GAP-43(+/-) mice have fewer proliferative-type DCX+ neuroblasts in the anterior dentate gyrus
(a-e) Representative images of DCX+ cells classified as (a-c) proliferative, (d) intermediate, and (e) postmitotic based on dendritic morphology. (f-m) Classification of DCX+ cells as proliferative (f-g, j-k), intermediate (h,l) and postmitotic (i,m) in male (f-i) and female (j-m) GAP-43(+/-) vs. (+/+) mice expressed as total cell number (f,h-j,k,l-m) or across Bregma (g,k). (n-u) Confirmation of the proliferative (n-q) vs. postmitotic (r-u) classification of DCX+ cells (red) in male GAP-43 mice by presence (n) or absence (r) of co-localization with Ki67 (green). (o-q) DCX+Ki67+ cells in male GAP-43(+/-) vs. (+/+) mice in the entire GCL (o) or in the anterior (p) and posterior (q) regions of the dentate gyrus. (s-u) DCX+Ki67- cells in male GAP-43(+/-) vs. (+/+) mice in the entire GCL (s) or in the anterior (t) and posterior (u) regions of the dentate gyrus. Data expressed as means±SEM, n=7/group. (f,h,i,j,l,m,o-q, s-u) analyzed by Student's t-test. (g,k) analyzed by 2-way ANOVA with Sidak posthoc test. *p<0.05 vs. (+/+). Scale bars: (a-e,n,r)=20μm.
Figure 7
Figure 7. Hippocampal mossy fiber volume is not altered in behaviorally-experienced 5-7 month GAP-43(+/-) mice
(a) Representative low magnification image of the hippocampus counterstained with Fast Red (pink) and immunostained with an antibody against synaptoporin (blue-black). (b-d) Representative high magnification images of synaptoporin+ staining (blue-black) in the (b) hilus, (c) SMF and IMF, and (d) SMF at CA3. (e-l) Mossy fiber volume in GAP-43(+/+) and (+/-) mice over the entire GCL (e), in the GCL across Bregma (f), in the entire hilus (g), SMF (h), and IMF (i), and across Bregma in the hilus (j), SMF (k), IMF (l). Data expressed as means ± SEM, n=7/group. (e,g-i) analyzed by Student's t-test. (f,j-l) analyzed by 2-way ANOVA with Sidak posthoc test. Scale bars: (a)=100μm, (b-d)=25μm.

Similar articles

Cited by

References

    1. Ebert DH, Greenberg ME. Activity-dependent neuronal signalling and autism spectrum disorder. Nature. 2013;493:327–337. - PMC - PubMed
    1. Duman RS, Aghajanian GK. Synaptic dysfunction in depression: potential therapeutic targets. Science. 2012;338:68–72. - PMC - PubMed
    1. Chakrabarti L, Galdzicki Z, Haydar TF. Defects in embryonic neurogenesis and initial synapse formation in the forebrain of the Ts65Dn mouse model of Down syndrome. J Neurosci. 2007;27:11483–11495. - PMC - PubMed
    1. Bassell GJ, Warren ST. Fragile X syndrome: loss of local mRNA regulation alters synaptic development and function. Neuron. 2008;60:201–214. - PMC - PubMed
    1. Benowitz LI, Routtenberg A. GAP-43: an intrinsic determinant of neuronal development and plasticity. Trends Neurosci. 1997;20:84–91. - PubMed

Publication types

LinkOut - more resources