

Glucose metabolism and hexosamine pathway regulate oncogene-induced senescence
- PMID: 24577087
- PMCID: PMC3944274
- DOI: 10.1038/cddis.2014.63
Glucose metabolism and hexosamine pathway regulate oncogene-induced senescence
Erratum in
- Cell Death Dis. 2014;5:e1376
Abstract
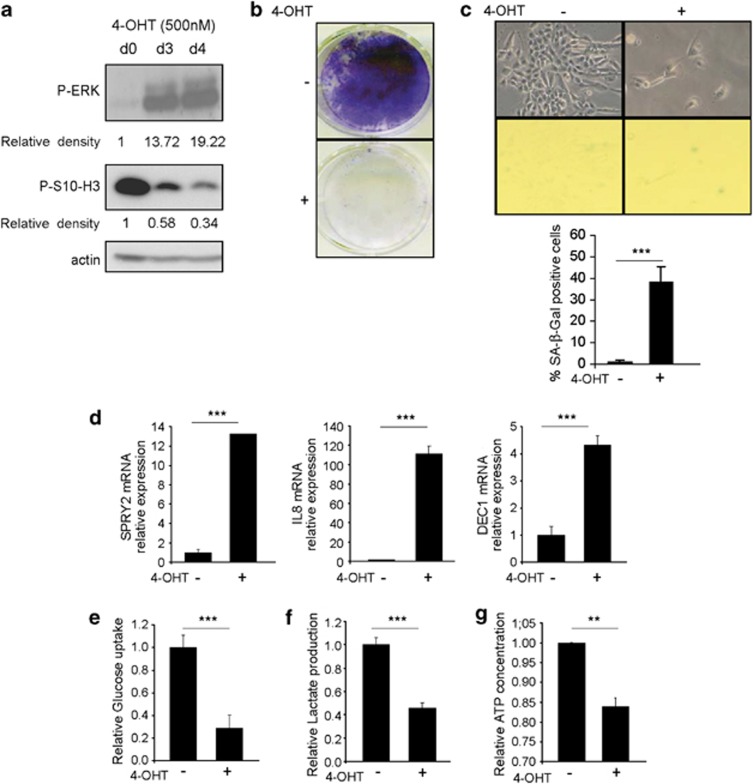
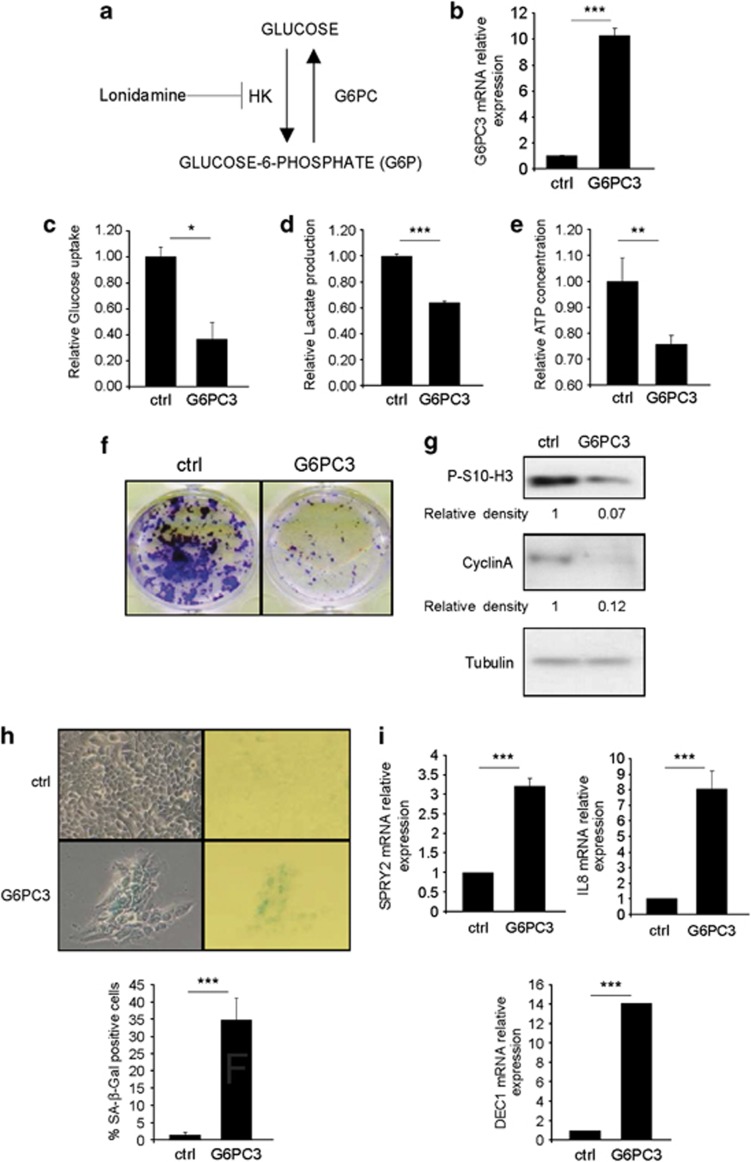
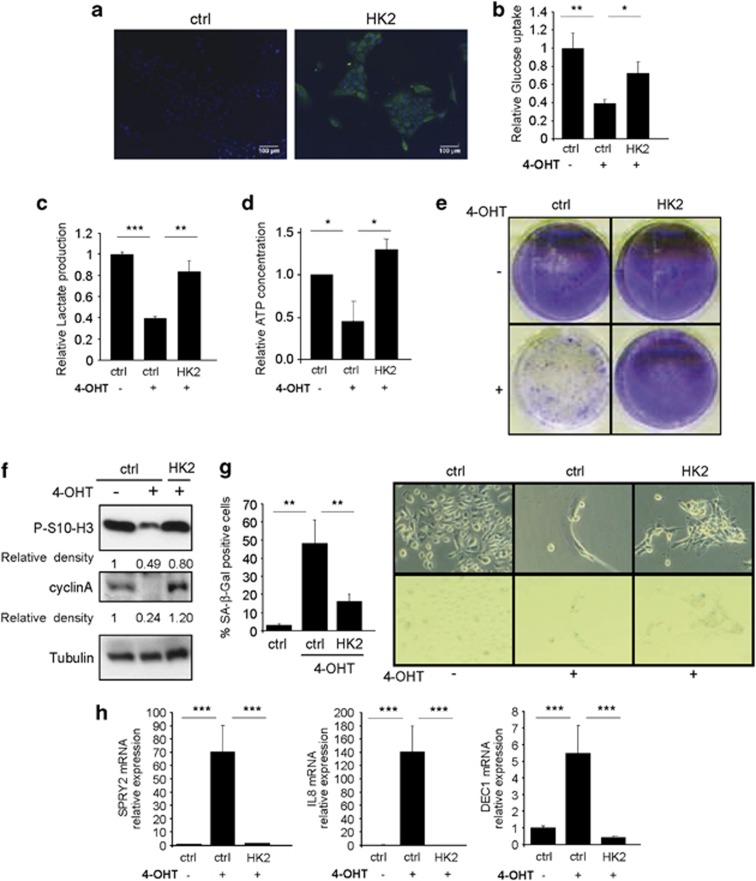
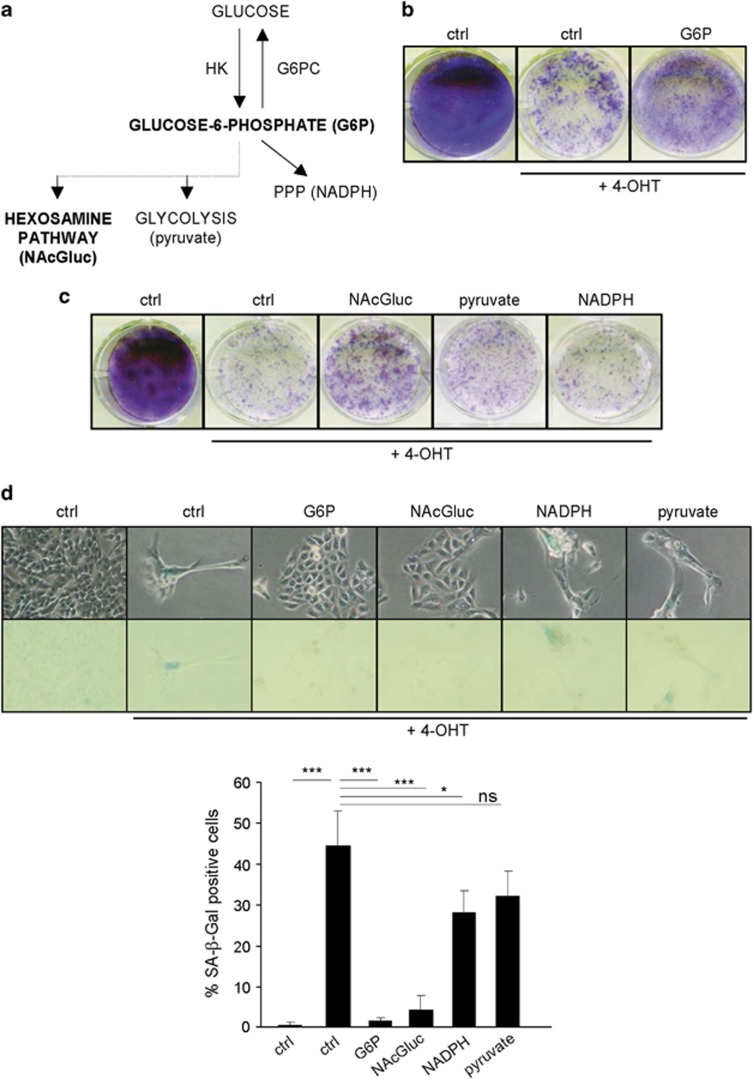
Oncogenic stress-induced senescence (OIS) prevents the ability of oncogenic signals to induce tumorigenesis. It is now largely admitted that the mitogenic effect of oncogenes requires metabolic adaptations to respond to new energetic and bio constituent needs. Yet, whether glucose metabolism affects OIS response is largely unknown. This is largely because of the fact that most of the OIS cellular models are cultivated in glucose excess. In this study, we used human epithelial cells, cultivated without glucose excess, to study alteration and functional role of glucose metabolism during OIS. We report a slowdown of glucose uptake and metabolism during OIS. Increasing glucose metabolism by expressing hexokinase2 (HK2), which converts glucose to glucose-6-phosphate (G6P), favors escape from OIS. Inversely, expressing a glucose-6-phosphatase, [corrected] pharmacological inhibition of HK2, or adding nonmetabolizable glucose induced a premature senescence. Manipulations of various metabolites covering G6P downstream pathways (hexosamine, glycolysis, and pentose phosphate pathways) suggest an unexpected role of the hexosamine pathway in controlling OIS. Altogether, our results show that decreased glucose metabolism occurs during and participates to OIS.
Figures
Similar articles
-
Cardiac-specific hexokinase 2 overexpression attenuates hypertrophy by increasing pentose phosphate pathway flux.J Am Heart Assoc. 2013 Nov 4;2(6):e000355. doi: 10.1161/JAHA.113.000355. J Am Heart Assoc. 2013. PMID: 24190878 Free PMC article.
-
Lysyl oxidase activity regulates oncogenic stress response and tumorigenesis.Cell Death Dis. 2013 Oct 10;4(10):e855. doi: 10.1038/cddis.2013.382. Cell Death Dis. 2013. PMID: 24113189 Free PMC article.
-
A key role for mitochondrial gatekeeper pyruvate dehydrogenase in oncogene-induced senescence.Nature. 2013 Jun 6;498(7452):109-12. doi: 10.1038/nature12154. Epub 2013 May 19. Nature. 2013. PMID: 23685455
-
Metabolic alterations accompanying oncogene-induced senescence.Mol Cell Oncol. 2014 Dec 23;1(3):e963481. doi: 10.4161/23723548.2014.963481. eCollection 2014 Jul-Sep. Mol Cell Oncol. 2014. PMID: 27308349 Free PMC article. Review.
-
HK2/hexokinase-II integrates glycolysis and autophagy to confer cellular protection.Autophagy. 2015;11(6):963-4. doi: 10.1080/15548627.2015.1042195. Autophagy. 2015. PMID: 26075878 Free PMC article. Review.
Cited by
-
Dysregulated glycolysis as an oncogenic event.Cell Mol Life Sci. 2015 May;72(10):1881-92. doi: 10.1007/s00018-015-1840-3. Epub 2015 Jan 22. Cell Mol Life Sci. 2015. PMID: 25609364 Free PMC article. Review.
-
RNA sequencing profiles reveal dynamic signaling and glucose metabolic features during bone marrow mesenchymal stem cell senescence.Cell Biosci. 2022 May 14;12(1):62. doi: 10.1186/s13578-022-00796-5. Cell Biosci. 2022. PMID: 35568915 Free PMC article.
-
Hyperoxia causes senescence and increases glycolysis in cultured lung epithelial cells.Physiol Rep. 2021 May;9(10):e14839. doi: 10.14814/phy2.14839. Physiol Rep. 2021. PMID: 34042288 Free PMC article.
-
Cholesterol biosynthetic pathway induces cellular senescence through ERRα.NPJ Aging. 2024 Jan 12;10(1):5. doi: 10.1038/s41514-023-00128-y. NPJ Aging. 2024. PMID: 38216569 Free PMC article.
-
Branched-Chain Amino Acid Accumulation Fuels the Senescence-Associated Secretory Phenotype.Adv Sci (Weinh). 2024 Jan;11(2):e2303489. doi: 10.1002/advs.202303489. Epub 2023 Nov 15. Adv Sci (Weinh). 2024. PMID: 37964763 Free PMC article.
References
-
- Kondoh H, Lleonart ME, Gil J, Wang J, Degan P, Peters G, et al. Glycolytic enzymes can modulate cellular life span. Cancer Res. 2005;65:177–185. - PubMed
Publication types
MeSH terms
Substances
LinkOut - more resources
Full Text Sources
Other Literature Sources
Research Materials
