. 2014 May;10(5):803-21.
doi: 10.4161/auto.28145. Epub 2014 Feb 26.

FGF7/KGF regulates autophagy in keratinocytes: A novel dual role in the induction of both assembly and turnover of autophagosomes

Affiliations

FGF7/KGF regulates autophagy in keratinocytes: A novel dual role in the induction of both assembly and turnover of autophagosomes

Francesca Belleudi et al. Autophagy. 2014 May.

Abstract

Autophagy is a degradative pathway through which cells overcome stressful conditions and rapidly change their phenotype during differentiation. Despite its protective role, when exacerbated, autophagy may lead to cell death. Several growth factors involved in cell survival and in preventing differentiation are able to inhibit autophagy. Here we investigated the autophagic role of FGF7/KGF, an important player in epithelial cell protection and differentiation. Biochemical and quantitative fluorescence approaches showed that FGF7 and its signaling induce autophagy in human keratinocytes and the use of specific inhibitors indicated that this effect is independent of the PI3K-AKT-MTOR pathway. The selective block of autophagosome-to-lysosome fusion clarified that FGF7 induces autophagy stimulating autophagosome formation. However, quantitative fluorescence approaches also indicated that, upon a prolonged autophagic stimulus, FGF7 is able to accelerate autophagosome turnover. Moreover, in differentiating keratinocytes, the use of the autophagic inhibitor 3-MA as well as the depletion of BECN1 and ATG5, 2 essential regulators of the process, counteracted the FGF7-induced increase of the differentiation marker KRT1/K1, suggesting that autophagy is required for the FGF7-mediated early differentiation. These results provide the first evidence of a role of FGF7 in the regulation of sequential steps of the autophagic process and strengthen the hypothesis of a direct interplay between autophagy and differentiation. On the other hand, the ability of FGF7 to accelerate autophagosome turnover, preventing their dangerous accumulation, is consistent with the well-established protective role played by the growth factor in epithelial cells.

Keywords: FGF7; FGFR2b; KGF; KGFR; autophagy.


Figures

None
Figure 1. Induction of the autophagic flux by serum deprivation in HaCaT cells. (A) HaCaT cells were left in complete medium or serum-starved for different times (4, 8, 24, and 48 h). Western blot analysis using anti-LC3 polyclonal antibodies showed a significant increase of the band at the molecular weight of 16 kDa corresponding to LC3-II after 48 h of serum deprivation. Equal loading was assessed with anti-ACTB antibody. For densitometric analysis the values from 3 independent experiments were normalized, expressed as fold increase and reported in graph as mean values ± standard deviation (SD).The Student t test was performed and significance levels have been defined as P < 0.05: *P < 0.05 vs. the corresponding serum-cultured cells. (B) Western blot analysis using anti-SQSTM1 monoclonal antibody shows that the band at the level of 62 kDa corresponding to SQSTM1 significantly decreased upon 24 h and 48 h of serum-starvation; no significant changes were visible at shorter time points. The densitometric analysis and Student t test were performed and significance levels have been defined as above: *P < 0.05 vs. the corresponding serum-cultured cells; **P < 0.01 vs. the corresponding serum-cultured cells. (C) HaCaT cells were transiently transfected with EGFP-LC3 (HaCaT EGFP-LC3) and then left in complete medium or serum-starved for different times (0.5, 1, 2, 4, 8, 24, and 48 h). Cells were then fixed, permeabilized, and nuclei were stained with DAPI. Quantitative fluorescence analysis showed that a significant increase of LC3-positive fluorescent dots was detectable at 24 h and 48 h of serum deprivation. The quantitative analysis was assessed as reported in Materials and Methods and results are expressed as mean values ± standard errors (SE). Student t test was performed and significance level has been defined as P < 0.05: *, **P < 0.001 vs. the corresponding serum-cultured cells; NS vs. the corresponding serum-cultured cells. Scale bar: 10 μm.
None
Figure 2. FGF7 induces autophagy in human keratinocytes. (A) HaCaT cells were serum-starved for different times (4, 8, 24, and 48 h) in the presence or absence of FGF7 (100 ng/ml). Western blot analysis showed that LC3-II levels were significantly increased by FGF7 after 24 h, while they appeared very high and comparable in FGF7-stimulated and FGF7-unstimulated cells after 48 h. The densitometric analysis and Student t test were performed and significance levels have been defined as above: NS vs. the corresponding serum-starved cells; *P < 0.05 vs. the corresponding serum-starved cells. (B) Western blot analysis using anti-SQSTM1 monoclonal antibody showed that FGF7 decreased the level of SQSTM1 at 24 h and 48 h. The densitometric analysis and Student t test were performed and significance levels have been defined as above: *, **P < 0.05 vs. the corresponding serum-starved cells. (C) HaCaT cells and normal human keratinocytes (HKs) grown in low calcium were transiently transfected with EGFP-LC3 and then serum-starved (24 h or 48 h) in the presence or absence of FGF7 as above. Cells were then fixed, permeabilized and nuclei were stained with DAPI. Quantitative fluorescence analysis showed that, after either 24 h or 48 h, FGF7 increased the number of EGFP-LC3-positive dots per cell in both HaCaT and HKs. The quantitative analysis was assessed as reported in Materials and Methods and results are expressed as mean values ± standard errors (SE). Student t test was performed and significance level has been defined as P < 0.05: *, **P < 0.001 vs. the corresponding unstimulated cells; ***P < 0.005 vs. the corresponding unstimulated cells. Scale bar: 10 μm.
None
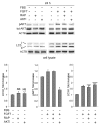
Figure 3. FGF7-mediated autophagy is not dependent on PI3K-AKT signaling or MTOR activation. HaCaT cells were stimulated with or without FGF7 in presence or absence of a specific AKT inhibitor (AKT i) or of the direct MTOR inhibitor rapamycin (RAP) as reported in Materials and Methods. Western blot analysis performed using anti-LC3, anti-phospho-AKT (pAKT) and anti-AKT polyclonal antibodies showed that either AKTi or RAP did not trigger LC3-I conversion to LC3-II in unstimulated cells and they did not affect the increase of LC3-II protein observed in FGF7-stimulated cells; the inhibition of AKT phosphorylation was evident only in cells treated with AKTi. The equal loading was assessed with anti-ACTB antibody. The densitometric analysis and Student t test were performed and significance levels have been defined as above: P < 0.05 vs. the corresponding FGF7-stimulated cells; *, **, ***P < 0.05 vs. the corresponding serum-starved cells; ****, *****NS vs. the corresponding FGF7-stimulated cells; ^, ^^NS vs. the corresponding AKTi and RAP-untreated cells.
None
Figure 4. Block of the autophagic flux by thapsigargin. HaCaT EGFP-LC3 cells were pretreated with or without thapsigargin (TG) for 1 h at 37 °C and then serum-starved for different times (0.5, 1, 2, 4, 8, 24, and 48 h). Quantitative fluorescence analysis showed that TG significantly increased the number of the LC3-positive dots already after 8 h and more evidently after 24 h and 48 h. The quantitative analysis was assessed as reported in Materials and Methods and results are expressed as mean values ± standard errors (SE). The Student t test was performed and significance level has been defined as P < 0.05: *, **, ***P < 0.001 vs. the corresponding serum-starved cells; NS vs. the corresponding serum-starved cells. Scale bar: 10 μm.
None
Figure 5. FGF7 triggers autophagosome formation. (A and B) HaCaT cells were pretreated with or without TG and then serum-starved in the presence or absence of FGF7 for 24 h (B and C) or 48 h (C). Western blot analysis shows that TG treatment increased the basal levels of LC3-II protein. Upon 24 h of serum deprivation FGF7 significantly increased the LC3-II amount either in TG-treated or TG-untreated cells (B and C); while upon 48 h the very high levels of LC3-II were not affected by FGF7 addition (C). Upon 24 h of serum-starvation TG also strongly increased the SQSTM1 amount independently of FGF7 stimulation (B), Equal loading was assessed with anti-ACTB antibody. The densitometric analysis and Student t test were performed and significance levels have been defined as above: *, **, ***P < 0.05 vs. the corresponding unstimulated cells; NS vs. the corresponding unstimulated cells. (C) HaCaT EGFP-LC3 were pretreated with and without TG and serum-starved in the presence or absence of FGF7 for 24 h as above. Fluorescence analysis indicates that serum-starved cells showed very few small LC3-positive dots (< 0.7 μm diameter) and the pretreatment with TG increased the total LC3-positive dots by increasing the number of large vacuoles (> 0.7 μm diameter) (central panels, arrowheads). FGF7 induced a further rise of the total LC3-positive dots exclusively due to a significant increase of the small ones, while the number of larger dots (lower panels, arrowheads) remained unchanged. The quantitative analysis was assessed as reported in Materials and Methods and results are expressed as mean values ± standard errors (SE). Student t test was performed and significance level has been defined as P < 0.05: *,**P < 0.01 vs. the corresponding unstimulated cells. Scale bar: 10 μm.
None
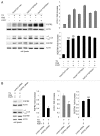
Figure 6. FGF7-induced autophagy requires FGFR2 expression and signaling. (A) HaCaT cells transiently transfected with the empty vector (HaCaT pCI-neo), with FGFR2 (HaCaT FGFR2wt) or whit FGFR2Y656F Y657F kinase-negative mutant (HaCaT FGFR2kin-) were pretreated with TG and serum-starved in the presence or absence of FGF7 as above. Western blot analysis performed using anti-SQSTM1 monoclonal antibody, and anti-LC3 and anti-FGFR2 polyclonal antibodies shows that the overexpression of FGFR2wt (indicated by a visible thickening of the band at the molecular weight of 140 kDa corresponding to the receptor) potentiated the increase of LC3-II amount induced by FGF7, while the overexpression of FGFR2kin- did not affect LC3-II levels independently from FGF7 stimulation. SQSTM1 protein amount appeared increased by TG and remained unchanged, independently from FGFR2wt or FGFR2kin- overexpression. Equal loading was assessed with anti-ACTB antibody. The densitometric analysis and Student t test were performed and significance levels have been defined as above: *P < 0.05 vs. the corresponding unstimulated cells; **P < 0.01 vs. the corresponding unstimulated cells; NS vs. the corresponding HaCaT FGFR2wt. (B) HaCaT cells transfected with an unrelated siRNA (control siRNA) or with a small interfering RNA for FGFR2 (FGFR2 siRNA), to obtain receptor silencing, were treated with TG and stimulated with FGF7 as above. Western blot analysis shows that in FGFR2 siRNA-transfected cells the downregulation of FGFR2 induced a decrease of LC3-II levels in response to FGF7; the level of SQSTM1 protein was unchanged independently from FGFR2 modulation. Equal loading was assessed with anti-ACTB antibody. The densitometric analysis and Student t test were performed and significance levels have been defined as above: *P < 0.001 vs. the control siRNA-transfected cells; **P < 0.01 vs. the control siRNA-transfected cells; NS vs. the control siRNA-transfected cells.
None
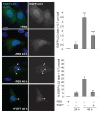
Figure 7. FGF7 counteracts autophagosome clustering. HaCaT EGFP-LC3 cells were left in complete medium, serum-starved for 24 h or 48 h in the presence or absence of FGF7 as above. Cells were then fixed, permeabilized, and nuclei were stained with DAPI. Fluorescence analysis indicates that upon 48 h of serum deprivation the presence of FGF7 reduces the number of big dots visible in the cytoplasm of transfected cells (arrowheads). Quantitative analysis performed as reported above confirms that upon 48 h of serum deprivation FGF7 stimulation increases the number as well as the percentage of LC3-positive dots > 0.7 μm diameter per cell. Student t test was performed and significance levels have been defined as above: *P < 0.001 vs. the corresponding cells starved for 24 h; **P < 0.001 vs. the corresponding unstimulated cells; ***P < 0.001 vs. the corresponding cells starved for 24 h; ****P < 0.005 vs. the corresponding unstimulated cells. Scale bar: 10 μm.
None
Figure 8. FGF7 accelerates autophagosome-to-lysosome fusion. HaCaT EGFP-LC3 cells were subjected to a serum starvation time course (0, 4, 12, 24, 48, and 54) in the presence or absence of FGF7. Parallel experiments were performed pretreating cells with TG. anti-LAMP2 monoclonal antibody was used to visualize the lysosomal compartment, nuclei were stained with DAPI. Quantitative immunofluorescence analysis shows that in serum-starved cells the colocalization between EGFP-LC3-positive dots and LAMP2-positive dots was visible after 24 h and reached a peak at 48 h; the addition of FGF7 accelerated the kinetics of LC3 and LAMP2 colocalization, which at 48 h returned comparable to that detected in control cells. No colocalization was detected in TG-treated cells at all time points. The quantitative analysis of the colocalization of LC3 and LAMP2 signals was assessed as reported in Materials and Methods and results are expressed as mean values ± standard errors (SE). Student t test was performed and significance level has been defined as P < 0.05: *,**P < 0.001 vs. the corresponding unstimulated cells; ***P < 0.05 vs. the corresponding unstimulated cells; NS vs. the corresponding unstimulated cells. Scale bars: 10 μm.
None
Figure 9. Block of autophagosome formation inhibits FGF7-induced early differentiation. (A) HaCaT cells were cultured to reach confluence and then serum-starved or treated with FGF7 for 24 h in presence or absence of 5 mM 3-MA as reported in Materials and Methods. Western blot analysis shows that the presence of 3-MA reduced the FGF7-dependent increase of both LC3-II and KRT1 protein levels and caused a significant rise in the FGF7-dependent decrease of SQSTM1. Equal loading was assessed with anti-ACTB antibody. The densitometric analysis and Student t test were performed and significance levels have been defined as above: *P < 0.05 vs. the corresponding unstimulated cells; **P < 0.05 vs. the corresponding FGF7-stimulated cells; ***NS vs. the corresponding unstimulated cells; ^P < 0.01 vs. the corresponding unstimulated cells; ^^P < 0.05 vs. the corresponding FGF7-stimulated cells; ^^^NS vs. the corresponding unstimulated cells. (B) Confluent HaCaT EGFP-LC3 cells (upper panels) and HKs EGFP-LC3 grown in high Ca2+ (lower panels) were serum-starved and treated with FGF7 and 3-MA as above. Quantitative fluorescence analysis showed that in both cells the presence of 3-MA significantly reduced the increase of either the EGFP-LC3-positive dots per cell and the percentage of KRT1-positive cells observed upon FGF7 stimulation. The quantitative analysis of LC3-positive dots per cell and of the percentage of KRT1-positive cells was assessed as reported in Materials and Methods. Results are expressed as mean values ± standard errors (SE). Student t test was performed and significance level has been defined as P < 0.05: ^, ^^^P < 0.001 vs. the corresponding unstimulated cells; ^^, ^^^^P < 0.001 vs. the corresponding cells stimulated with FGF7 in absence of 3-MA; *, ***P < 0.001 vs. the corresponding unstimulated cells; **, ****P < 0.001 vs. the corresponding cells stimulated with FGF7 in absence of 3-MA. Scale bars: 10 μm.
None
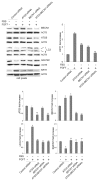
Figure 10. BECN1 and/or ATG5 depletion inhibit the KRT1 protein expression induced by FGF7. HaCaT cells were transiently transfected with small interfering RNA for ATG5 (ATG5 siRNA) or for BECN1 (BECN1 siRNA) or with a mixture of both siRNAs (ATG5 and BECN1 siRNAs). Transfection with an unrelated siRNA was performed as a control. After transfection, cells were serum-starved or stimulated with FGF7 for 24 h. Western blot analysis shows that BECN1 and ATG5 are significantly reduced in cells transfected with the specific siRNAs. In HaCaT BECN1 siRNA, HaCaT ATG5 siRNA and in HaCaT BECN1 and ATG5 siRNAs a strong LC3-II reduction, SQSTM1 accumulation and a significant inhibition of KRT1 increase upon FGF7 stimulation is shown. Equal loading was assessed with anti-ACTB antibody. The densitometric analysis and Student t test were performed and significance levels have been defined as above: *P < 0,05 vs. the corresponding unstimulated cells; **P < 0,05 vs. the corresponding control siRNA-transfected cells.
None
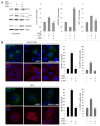
Figure 11. BECN1 and/or ATG5 depletion reduces the percentage of KRT1-positive keratinocytes upon FGF7 treatment. HaCaT cells were coinjected with EGFP-LC3 cDNA and ATG5 siRNA or BECN1 siRNA or both, to obtain specific gene silencing. Microinjection with an unrelated siRNA was performed as control. After injection, cells were serum-starved or treated with FGF7 as above. Quantitative immunofluorescence analysis shows that in cells microinjected (asterisks) with ATG5 siRNA, with BECN1 siRNA or with ATG5 and BECN1 siRNAs mixture, the increase of the percentage of LC3-positive autophagosomes per cell as well as the expression of KRT1 in response to FGF7 appeared significantly reduced compared with the surrounding uninjected cells in the same microscopic fields or to cells injected with control siRNA. The quantitative analysis was assessed as reported in Materials and Methods, results are expressed as mean values ± standard errors (SE). Student t test was performed and significance level has been defined as P < 0.05: *P < 0,001 vs. the corresponding control siRNA-injected cells. Scale bar: 10 μm.

Similar articles

Cited by

References

    1. Ravikumar B, Sarkar S, Davies JE, Futter M, Garcia-Arencibia M, Green-Thompson ZW, Jimenez-Sanchez M, Korolchuk VI, Lichtenberg M, Luo S, et al. . . Regulation of mammalian autophagy in physiology and pathophysiology. Physiol Rev 2010; 90:1383 - 435; http://dx.doi.org/10.1152/physrev.00030.2009; PMID: 20959619 - DOI - PubMed
    1. Rubinsztein DC, Mariño G, Kroemer G. . Autophagy and aging. Cell 2011; 146:682 - 95; http://dx.doi.org/10.1016/j.cell.2011.07.030; PMID: 21884931 - DOI - PubMed
    1. Cecconi F, Levine B. . The role of autophagy in mammalian development: cell makeover rather than cell death. Dev Cell 2008; 15:344 - 57; http://dx.doi.org/10.1016/j.devcel.2008.08.012; PMID: 18804433 - DOI - PMC - PubMed
    1. Yang Z, Klionsky DJ. . Mammalian autophagy: core molecular machinery and signaling regulation. Curr Opin Cell Biol 2010; 22:124 - 31; http://dx.doi.org/10.1016/j.ceb.2009.11.014; PMID: 20034776 - DOI - PMC - PubMed
    1. Maiuri MC, Zalckvar E, Kimchi A, Kroemer G. . Self-eating and self-killing: crosstalk between autophagy and apoptosis. Nat Rev Mol Cell Biol 2007; 8:741 - 52; http://dx.doi.org/10.1038/nrm2239; PMID: 17717517 - DOI - PubMed

Publication types

Substances