Comparative Study
. 2014 Apr;24(4):464-81.
doi: 10.1038/cr.2014.25. Epub 2014 Feb 28.

Species-dependent neuropathology in transgenic SOD1 pigs

Affiliations
Comparative Study

Species-dependent neuropathology in transgenic SOD1 pigs

Huaqiang Yang et al. Cell Res. 2014 Apr.

Abstract

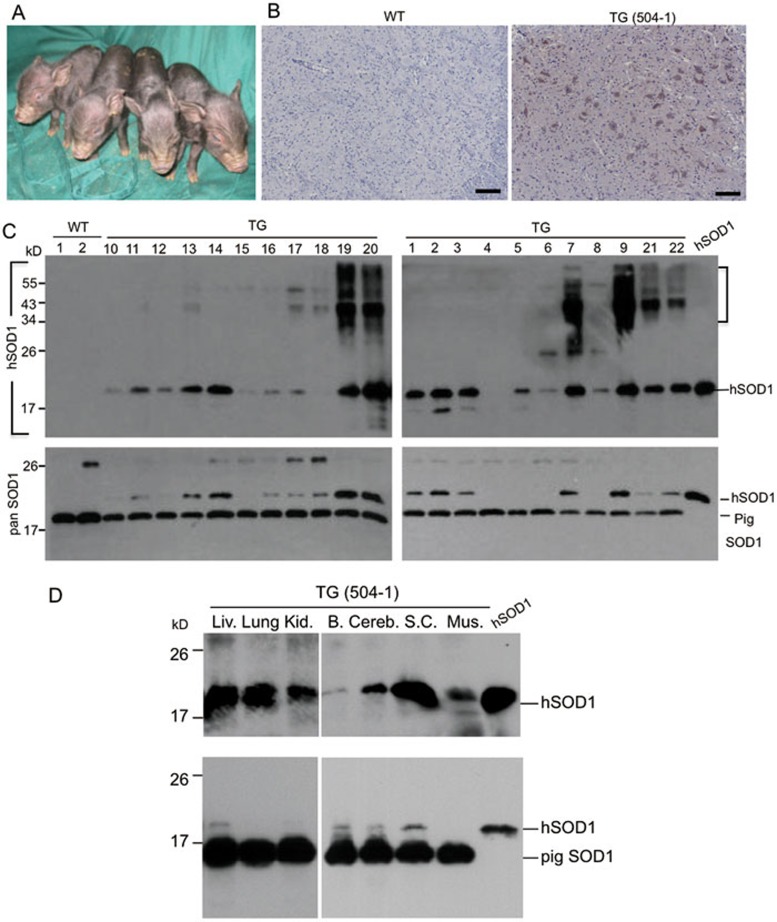
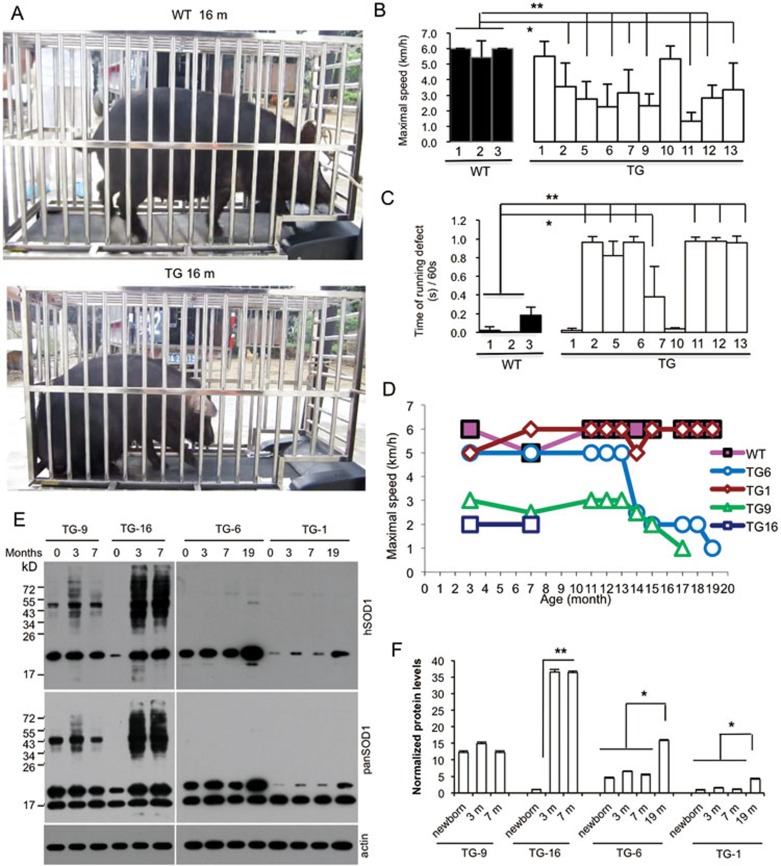
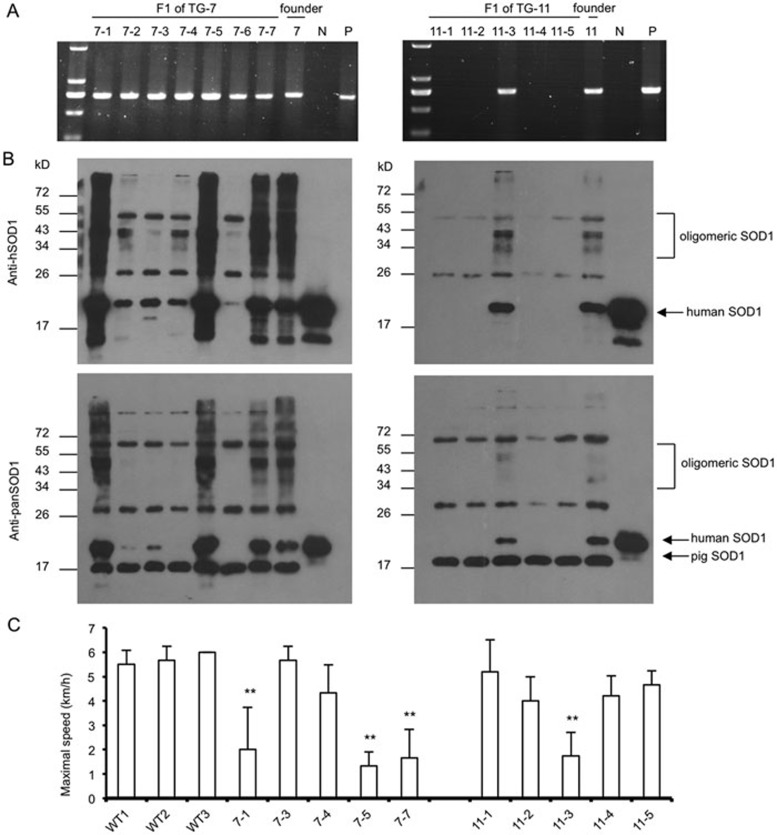
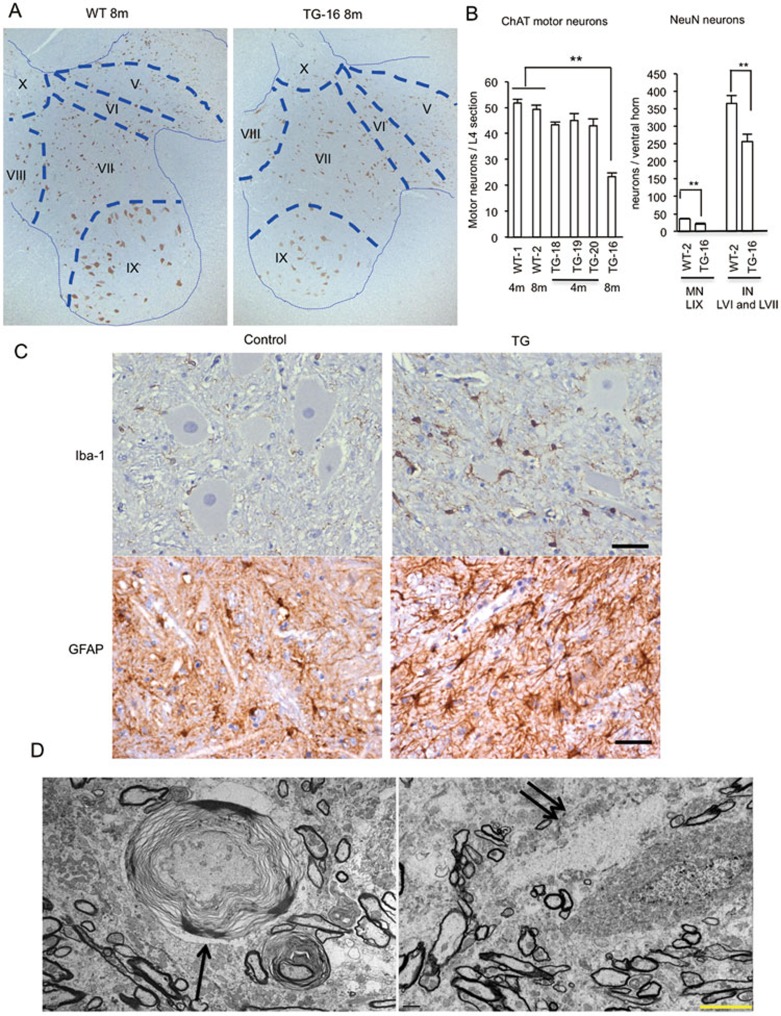
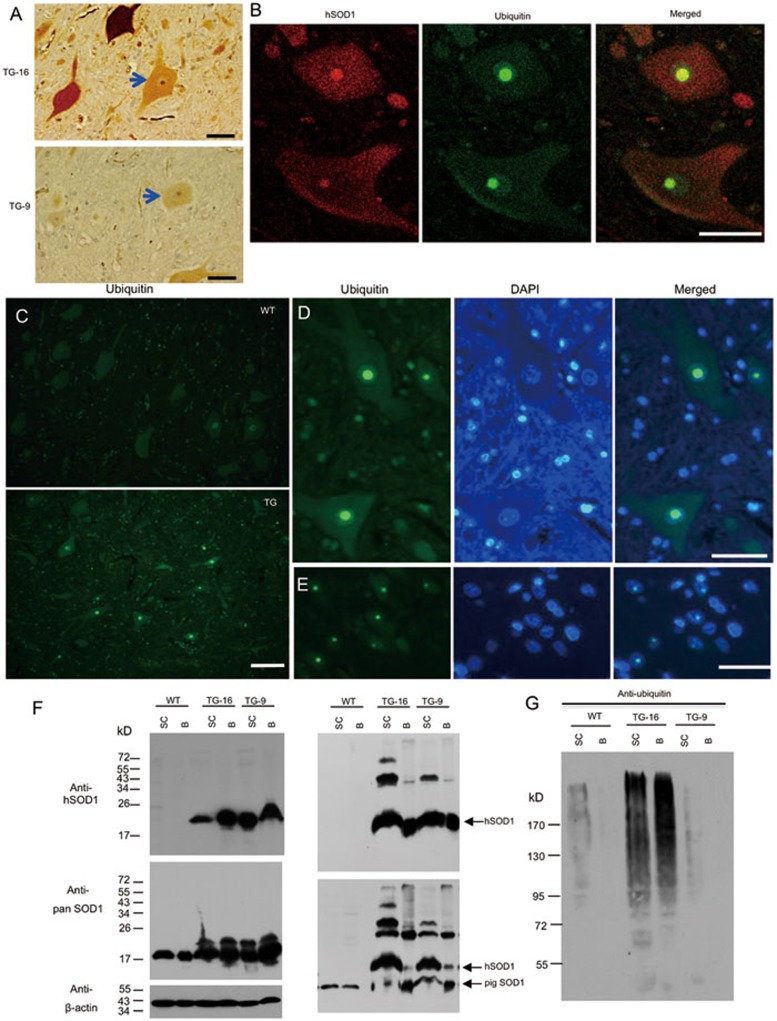
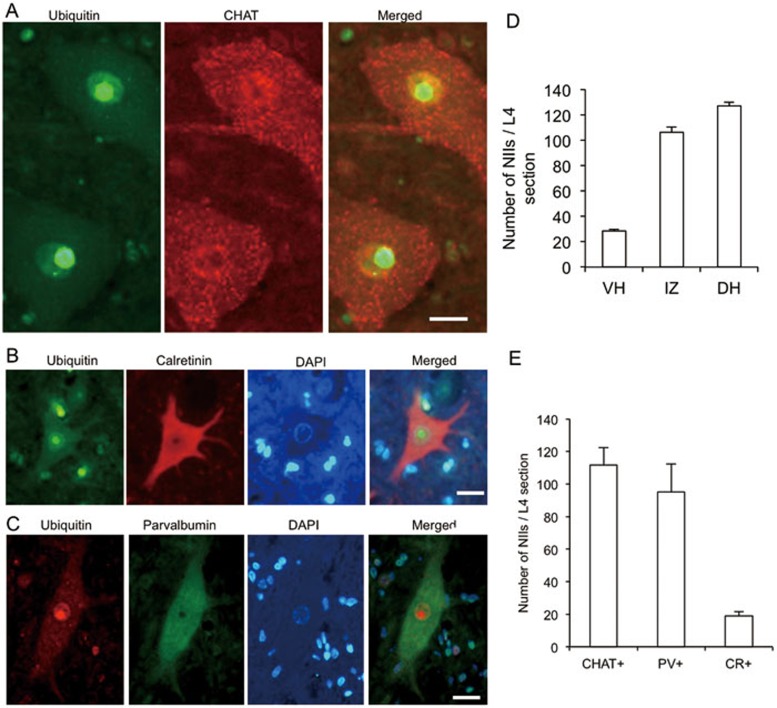
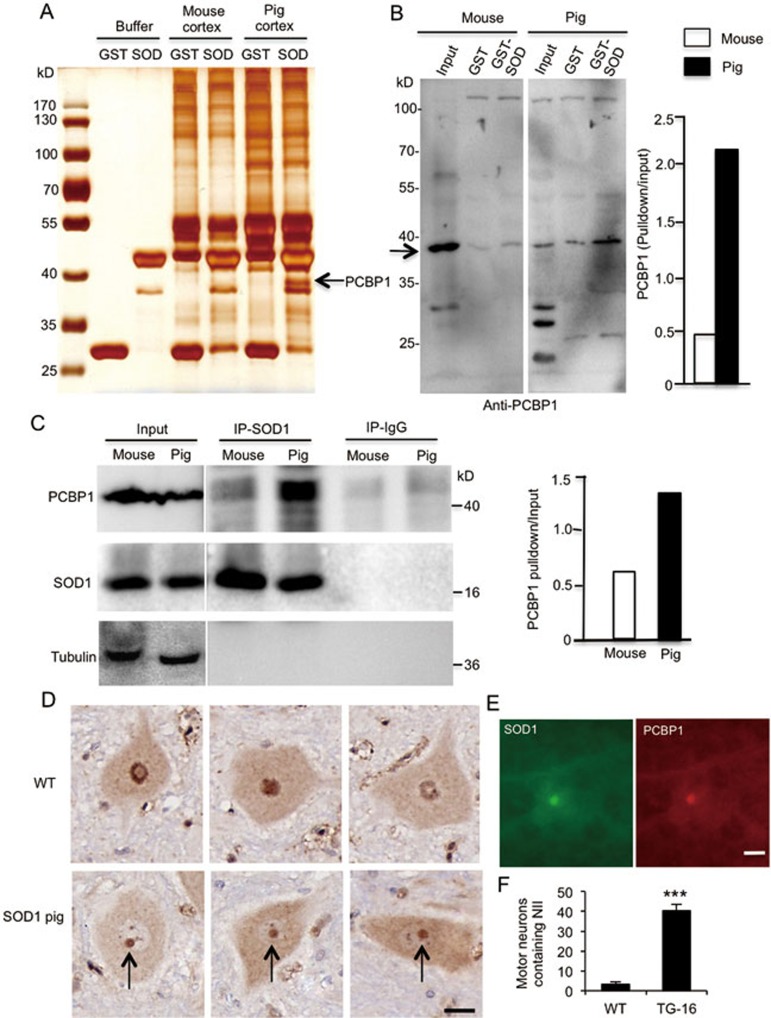
Mutations in the human copper/zinc superoxide dismutase 1 (hSOD1) gene cause familial amyotrophic lateral sclerosis (ALS). It remains unknown whether large animal models of ALS mimic more pathological events seen in ALS patients via novel mechanisms. Here, we report the generation of transgenic pigs expressing mutant G93A hSOD1 and showing hind limb motor defects, which are germline transmissible, and motor neuron degeneration in dose- and age-dependent manners. Importantly, in the early disease stage, mutant hSOD1 did not form cytoplasmic inclusions, but showed nuclear accumulation and ubiquitinated nuclear aggregates, as seen in some ALS patient brains, but not in transgenic ALS mouse models. Our findings revealed that SOD1 binds PCBP1, a nuclear poly(rC) binding protein, in pig brain, but not in mouse brain, suggesting that the SOD1-PCBP1 interaction accounts for nuclear SOD1 accumulation and that species-specific targets are key to ALS pathology in large mammals and in humans.


Figures

Figure 1
Figure 1
Generation of hSOD1 (G93A) transgenic pigs. (A) A photograph of four newborn transgenic pigs (TG-16, 17, 18, and 19) was taken on the first day after birth. (B) Immunohistochemical staining of lumbar spinal cord of a stillborn transgenic pig (#504-1) with anti-human SOD1 antibody showing the expression of hSOD1 protein in the lumbar spinal cord of transgenic pig. Scale bars, 200 μm. (C) Western blots of ear biopsy lysates from WT and 22 transgenic pigs using antibodies that detect either hSOD1 only (upper panel) or both endogenous pig SOD1 and transgenic hSOD1 (lower panel, pan SOD1). Endogenous pig SOD1 immunoreactivity shows equal protein loading in each lane. hSOD1-transfected HeLa cell lysates served as the positive control. Note that hSOD1 in transgenic pig tissues shows a dimerized form (∼40 kDa) and oligomeric forms with high molecular weight. (D) Western blot analysis showing hSOD1 ubiquitously expressed in the brain regions and peripheral tissues. In a stillborn transgenic pig (TG #504-1), transgenic hSOD1 is expressed at levels lower than endogenous pig SOD1. Liv., liver; Kid,, kidney; B, whole brain; Cereb., cerebellum; S.C., spinal cord; Mus., muscle; hSOD1, transfected hSOD1.
Figure 2
Figure 2
Limb movement defects in hSOD1 transgenic pigs. (A) Representative photos of wild-type (WT) and hSOD1 transgenic (TG-11) pigs at 16 months of age on treadmill (also see Supplementary information, Movies S1-S4). (B, C) The accelerating (B) and constant (C) speed treadmill running tests revealed obvious motor defects of hSOD1 transgenic pigs in the maximum speed and duration in treadmill running tests. Accelerating speed treadmill running data are the means of nine tests from 11 to 19 months for each living pig. Constant speed treadmill running data are the means of three tests from 17 to 19 months for each living pig. Values are reported as mean ± SEM. *P < 0.01, **P < 0.001, by one-way ANOVA with Bonferroni's post hoc test. (D) Maximal speed of transgenic pigs in treadmill running test also demonstrates progressive motor defects with age (months) for hSOD1 transgenic pigs. (E) Representative SOD1 immunoblots of hSOD1 levels in ear biopsy homogenates of hSOD1 transgenic pigs showing the age-dependent accumulation of misfolded hSOD1 and different levels of transgenic hSOD1 in pigs. (F) hSOD1 levels (oligomeric and monomeric) in western blots are normalized by β-actin levels and shown as ratio to β-actin (means ± SEM, *P < 0.01, **P < 0.001 by Student's paired t-test), which indicate that transgenic hSOD1 of TG-16 pig increases and accumulates rapidly over 3 months.
Figure 3
Figure 3
Germline transmission of mutant SOD1 and motor deficit in transgenic F1 pigs. (A) Genotyping analysis results of F1 pigs born by TG-7 and TG-11 transgenic pigs. P is the PCR result from hSOD1 plasmid, which served as a positive control. N is negative control. (B) Western blot analysis of the expression of mutant SOD1 in transgenic F1 pig ear tissues. Antibodies to human SOD1 (upper panel) and both pig and human SOD1 (pan-SOD1, lower panel) were used to probe western blots. (C) Treadmill tests showing the impairment of hind limb movement of F1 transgenic hSOD pigs. F1 transgenic pigs with higher transgene expression (7-1, 7-7, 11-3 are male; 7-5 is female) showed more severe motor defects than those expressing lower levels of mutant SOD1. Data (mean ± SEM, n = 4) of WT and F1 of TG-7 or TG-11 are the average value from pigs at the age of 5-8 months. **P < 0.001 vs WT by one-way ANOVA with Bonferroni's post hoc test.
Figure 4
Figure 4
Skeletal muscle atrophy in hSOD1 transgenic pigs. (A) Hematoxylin and eosin (HE) stain of muscle from 8-month-old TG-16 transgenic and WT pigs showing a significant reduction in the cross-sectional area of gastrocnemius muscle fibers in TG-16 muscle compared with WT muscle. Immunohistochemical studies also show enhanced NCAM and Nogo-A levels in the muscle of TG-16 pig, but not in WT pig. Scale bars, 100 μm. (B) Double immunostaining showing that Nogo-A is localized in the fast-twitch (type II) fibers that also contain MyHC-II staining signals. Scale bars, 100 μm. (C) Western blot analysis of expression levels of Nogo-A, NCAM, Myosin, β-actin, skeletal muscle actin (m-actin), Murf1, MAFbx, ubiquitin, and SOD1 in the gastrocnemius muscle homogenates from two wild-type (WT-1 and WT-2), TG-16, and TG-9 transgenic pigs. Note that TG-16 pig shows obvious muscle myofibrillar protein degradation, and upregulation of ubiquitin as well as muscle-specific E3 ubiquitin ligases atrogin-1/MAFbx and MuRF1. (D) Electromyography of tibialis anterior muscles or sternocleidomastoid muscles revealing frequent fibrillation potentials (arrows) in transgenic (TG) pigs, but not in WT controls. MUP parameters show increased potential duration, amplitude, and polyphasia. (E) Quantitative analysis of MUP parameter data in transgenic pigs and WT pigs. Two transgenic pigs show increases in duration, amplitude, and polyphasia of MUPs compared with WT pig. At least 20 MUPs were recorded and analyzed for each pig. Data are presented as means ± SEM. *P< 0.001 vs WT group by one-way ANOVA with Bonferroni's post hoc test.
Figure 5
Figure 5
Neuropathology in hSOD1 transgenic pigs. (A) Reduced NeuN immunoreactivity is present in the ventral horn of TG-16 pig at the age of 8 months compared with the age-matched WT pig. Blue broken arrow lines define different regions in the ventral horn (LIX) and intermediate zone (LVI and LVII) of the spinal cord. (B) Quantitative assessment of the number of ChAT- and NeuN-positive cells. More data are also provided in Supplementary information, Figure S3. Data are the means ± SEM of three L4 slices; **P < 0.001, as assessed by a Student's t-test. (C) Enhanced Iba-1 and GFAP immunoreactivity indicating activated microglia and reactive astrogliosis, respectively, in the spinal cord of TG-16, but not WT, pig. (D) Electron microcopy showing demyelinating axon (arrow in left panel) and degenerated neuronal cell (double arrows in right panel) in the spinal cord of TG-16 transgenic pig. Scale bars: 50 μm in C and 5 μm in D.
Figure 6
Figure 6
Nuclear accumulation and inclusions of hSOD1 in transgenic pig brain and spinal cord. (A) Immunocytochemical studies revealing that, in addition to its cytoplasmic distribution, hSOD1 forms intranuclear inclusions (arrows) in the spinal cord of TG-16 and TG-9 pigs. (B) Double immunofluorescence staining of the lumbar spinal cord of TG-16 pig revealing the colocalization of the nuclear hSOD1 inclusions with ubiquitin. (C) The nuclear inclusions are present in the spinal cord of transgenic hSOD1, but not WT, pig. We examined 677 neurons in three L4 spinal cord slices. (D, E) Immunofluorescent staining showing the presence of nuclear inclusions in the spinal cord (D) and cortex (E) of hSOD1 transgenic pig. Scale bars, A, B, D, and E, 50 μm; C, 100 μm. (F) Spinal cord (SC) and brain (B) cortex were isolated from TG-16 and TG-9 transgenic pigs and lysed in RIPA buffer (left panel) or 2% SDS buffer (right panel). Western blotting with antibodies to hSOD1 or pan SOD1 shows that RIPA-treated lysates only display hSOD1 monomer bands, but 2% SDS-treated lysates yielded hSOD1 oligomers. TG-16 pig had more hSOD1 oligomers than TG-9 pig. (G) Anti-ubiquitin probing the blot showing an increase in protein ubiquitination in the SC and brain cortex (B) from TG-16 pig.
Figure 7
Figure 7
Distribution of nuclear inclusions (NIIs) in the lumbar spinal cord of TG-16 transgenic pig. (A-C) NIIs are located in the (A) ChAT-, (B) CR-, and (C) Parvalbumin-positive neurons. (D) Quantitation of NIIs in the L4 spinal cord showing that more NIIs are distributed in the dorsal horn (DH) and intermediate zone (IZ) than ventral horn (VH). (E) Quantitation of the distribution of NIIs in ChAT-, CR-, and Parvalbumin-positive neurons, respectively. Data shown are means ± SEM of three L4 slices. Scale bars, 20 μm.
Figure 8
Figure 8
SOD1 interacts with PCBP1 in the pig brain. (A) GST-hSOD1 was used to pull down proteins from mouse and pig brain cortex tissue lysates. The pull-downs were analyzed by SDS PAGE. Silver staining revealed a band (arrow) specific to the pull-down from the pig brain tissue. Mass spectrometry identified the presence of PCBP1 in the band. (B) Western blot analysis with anti-PCBP1 verified that GST-hSOD1 binds more PCBP1 in the pig brain cortex lysates. The ratio of PCBP1 in pull-down to the input is presented (right panel). (C) Immunoprecipitation of SOD1 from mouse and pig brain cortex showing that more PCBP1 was coprecipitated with SOD1 in the pig brain tissue than in the mouse brain tissue. The ratios of precipitated proteins to input are also shown (right panel). (D) Immunostaining of the spinal cord of WT and hSOD1 transgenic pigs. While PCBP1 is diffuse in WT motor neurons, it is distributed in nuclear inclusions (arrows) in transgenic hSOD1 pig motor neurons. (E) Double immunofluorescent staining showing that both transgenic hSOD1 and endogenous PCBP1 are localized in the nuclear inclusions in the spinal cord. (F) Quantitation of the numbers of motor neurons containing PCBP1 nuclear inclusions in the spinal cord of WT and TG-16 transgenic pigs. Data are the mean ± SEM of 3 L4 slices per group. ***P <0.001 compared with WT. Scale bar, 20 μm.

References

    1. Dion PA, Daoud H, Rouleau GA. Genetics of motor neuron disorders: new insights into pathogenic mechanisms. Nat Rev Genet. 2009;10:769–782. - PubMed
    1. Boillée S, Vande Velde C, Cleveland DW. ALS: a disease of motor neurons and their nonneuronal neighbors. Neuron. 2006;52:39–59. - PubMed
    1. Rosen DR, Siddique T, Patterson D, et al. Mutations in Cu/Zn superoxide dismutase gene are associated with familial amyotrophic lateral sclerosis. Nature. 1993;362:59–62. - PubMed
    1. Turner BJ, Talbot K. Transgenics, toxicity and therapeutics in rodent models of mutant SOD1-mediated familial ALS. Prog Neurobiol. 2008;85:94–134. - PubMed
    1. Gurney ME, Pu H, Chiu AY, et al. Motor neuron degeneration in mice that express a human Cu,Zn superoxide dismutase mutation. Science. 1994;264:1772–1775. - PubMed

Publication types

MeSH terms

Supplementary concepts