. 2014 Jun;42(6):1148-57.
doi: 10.1007/s10439-014-0992-x. Epub 2014 Feb 28.

Role of the basement membrane in regulation of cardiac electrical properties

Affiliations

Role of the basement membrane in regulation of cardiac electrical properties

Huaxiao Yang et al. Ann Biomed Eng. 2014 Jun.

Abstract

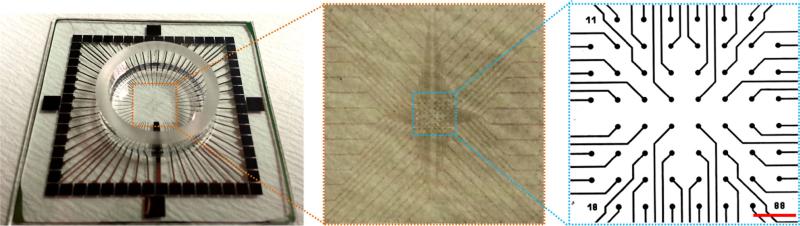
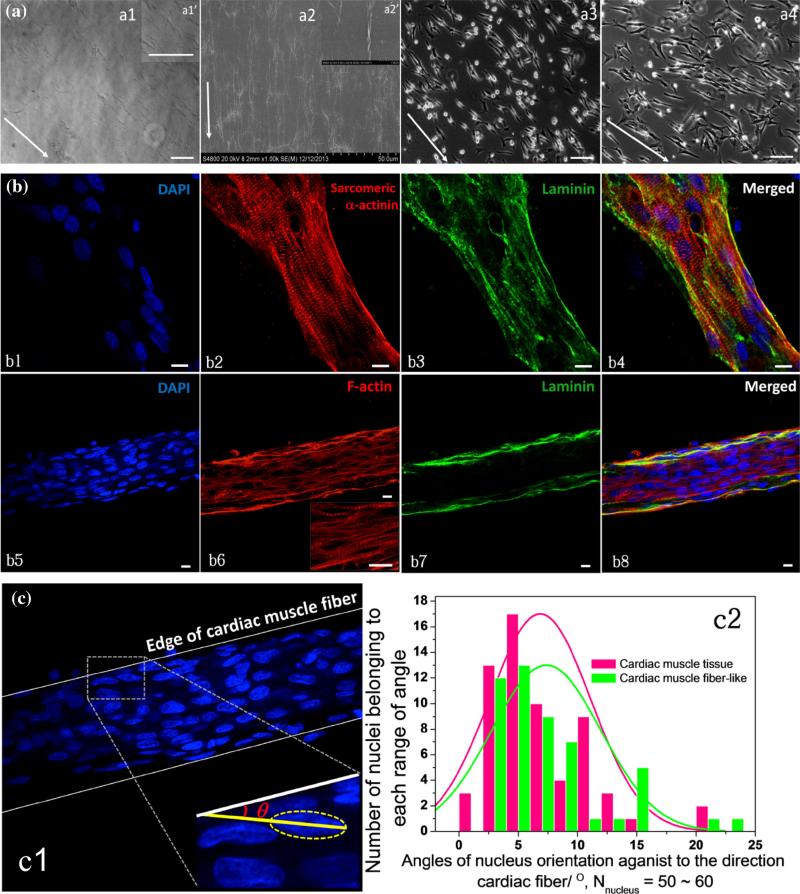
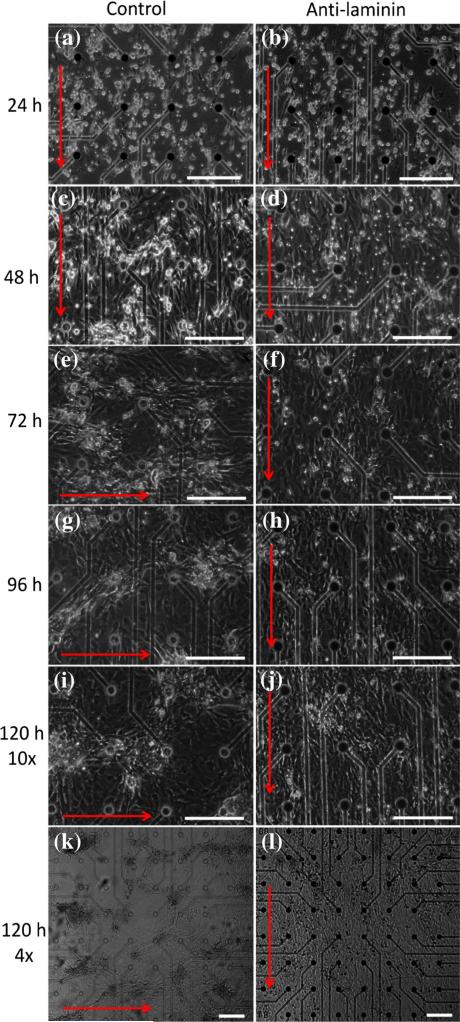
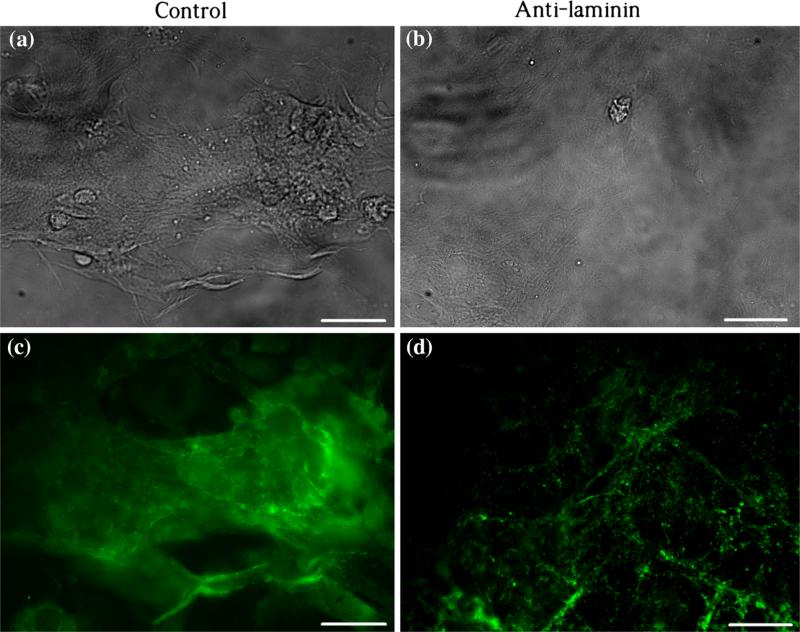
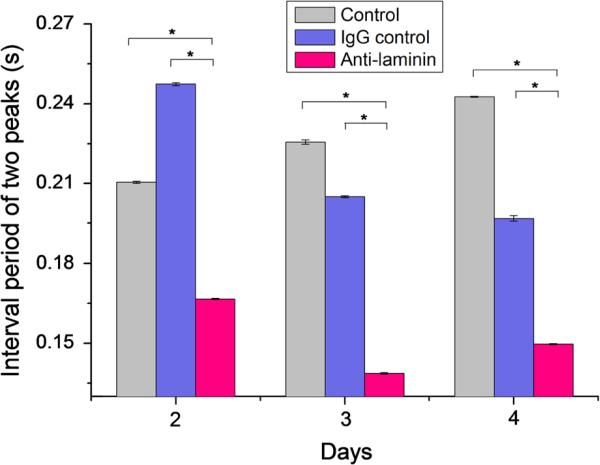
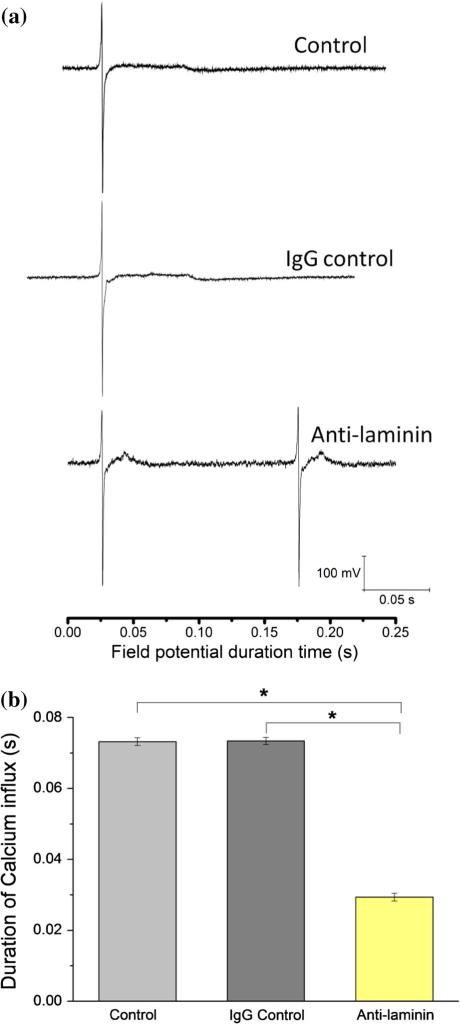
In the heart muscle, each adult cardiomyocyte is enclosed by a basement membrane (BM). This innermost extracellular matrix is a layered assembly of laminin, collagen IV, glycoproteins, and proteoglycans. In this study, the role of the BM network in regulation of the electrical properties of neonatal cardiomyocytes (NCMs) cultured on an aligned collagen I gel was investigated using a multielectrode array (MEA). A laminin antibody was added to the culture medium for 48-120 h to conjugate newly secreted laminin. Then, morphology of the NCMs on an MEA was monitored using a phase contrast microscope, and the BM network that was immunocytostained for laminin was imaged using a fluorescence microscope. When the BM laminin was absent in this culture model, dramatic changes in NCM morphology were observed. Simultaneously, the MEA-recorded cardiac field potential showed changes compared to that from the control groups: The period of contraction shortened to 1/2 of that from the control groups, and the waveform of the calcium influx shifted from a flat plateau to a peak-like waveform, indicating that the electrical properties of the NCMs were closely related to the components and distribution of the BM network.


Figures

FIGURE 1
FIGURE 1
View of MEA chip and distribution of 60 microelectrodes on the chip. Scale bar: 300 μm.
FIGURE 2
FIGURE 2
(a) a1: Morphologies of ACG coating on a glass coverslip; a1′: Upper-right box: enlarged image of aligned collagen I fibrils. a2: Collagen fibrils formed on ACG-coated coverslip imaged by SEM; a2′: Upper-right box: enlarged image of aligned collagen I fibrils imaged by SEM. a3 and a4: NCMs cultured on ACG at 24 and 48 h, arrows indicate orientations of ACG, scale bars: 100 μm. (b) Confocal images of immunocytostaining of nucleus (DAPI in blue, b1 and b5), sarcomeric α-actinin (red, b2), F-actin (red, b6), and laminin (green, b3 and b7) of NCMs cultured on ACG at 192 h, scale bars: 10 μm. (c) Evaluation of angle θ c1) of nucleus orientation to the edge of cardiac muscle fiber-like structure comparing it to cardiac muscle tissue, 50–60 nuclei were evaluated in each group, their distributions of θ are shown in the histogram of c2, p = 0.24 > 0.05.
FIGURE 3
FIGURE 3
Morphologies of NCMs growing on the ACG-coated MEA chip in control and anti-laminin groups from 24 to 120 h. (a, c, e, g, i and k) Control group cultured at 24, 48, 72, 96, 120 (10×) and 120 (4×) h, respectively. (b, d, f, h, j and l) Anti-laminin group cultured at 24, 48, 72, 96, 120 (10×) and 120 (4×) h, respectively. Red arrows indicate the directions of collagen fibrils. Scale bars: 200 μm.
FIGURE 4
FIGURE 4
Immuocytostaining of laminin on NCMs being cultured at 120 h. (a and c) Phase and fluorescent images in the control group, respectively. (b and d) Phase and fluorescent images in the anti-laminin group, respectively. Scale bars: 20 μm.
FIGURE 5
FIGURE 5
Interval periods of two adjacent upper peaks of three groups: Control, IgG control, and anti-laminin at Days 2, 3, and 4. N = 12, *p < 0.01.
FIGURE 6
FIGURE 6
(a) Patterns of field potential of NCMs cultured on MEA chips at Day 4 of three groups: Laminin—rabbit-anti-rat IgG laminin antibody added into culture medium; CD105—rabbit-anti-rat IgG CD105 added into culture medium as IgG control; control—only culture medium without addition of antibodies. Plateau is highlighted as calcium ion influx. (b) Durations of calcium influx of three groups: Laminin, CD105, and control at day 4. * P < 0.01, n = 12.

References

    1. Baudino TA, Carver W, Giles W, Borg TK. Cardiac fibroblasts: friend or foe? Am. J. Physiol. Heart Circ. Physiol. 2006;291:H1015–H1026. - PubMed
    1. Bers DM, Shannon TR. Calcium movements inside the sarcoplasmic reticulum of cardiac myocytes. J. Mol. Cell Cardiol. 2013;58:59–66. - PMC - PubMed
    1. Borg TK, Gay RE, Johnson LD. Changes in the distribution of fibronectin and collagen during development of the neonatal rat heart. Coll. Relat. Res. 1982;2:211–218. - PubMed
    1. Bray MA, Adams WJ, Geisse NA, Feinberg AW, Sheehy SP, Parker KK. Nuclear morphology and deformation in engineered cardiac myocytes and tissues. Biomaterials. 2010;31:5143–5150. - PMC - PubMed
    1. Brette F, Salle L, Orchard CH. Quantification of calcium entry at the T-tubules and surface membrane in rat ventricular myocytes. Biophys. J. 2006;90:381–389. - PMC - PubMed

Publication types

Substances