

Review
doi: 10.1002/acr.22316.
Quantitative radiologic imaging techniques for articular cartilage composition: toward early diagnosis and development of disease-modifying therapeutics for osteoarthritis
Affiliations
- PMID: 24578345
- PMCID: PMC4321941
- DOI: 10.1002/acr.22316
Item in Clipboard
Review
Quantitative radiologic imaging techniques for articular cartilage composition: toward early diagnosis and development of disease-modifying therapeutics for osteoarthritis
Arthritis Care Res (Hoboken).
2014 Aug.
No abstract available
Figures
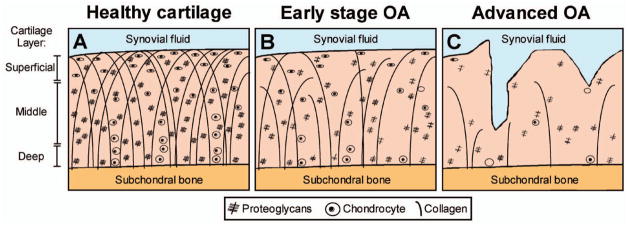
Schematic representation of articular cartilage composition and morphology in healthy (A), early-stage osteoarthritic (B), and advanced-stage osteoarthritic cartilage (C). In healthy cartilage (A), the orientation and density of the collagen fibers varies by location within the cartilage layer and regionally within the joint. Relative to the articular surface, their prevailing orientation is parallel in the superficial layer, oblique in the transitional (middle) layer, and perpendicular in the deep radial zone. Similarly, the concentration of proteoglycans varies according to location and is highest in the middle layer. In early osteoarthritis (OA) (B), proteoglycans and glycosaminoglycans leak from the cartilage and the collagen fibers change in size and orientation. These initial disease processes occur without macroscopic alterations in cartilage morphology. When OA progresses (C), morphologic changes (thinning and defects) of the cartilage appear. Color figure can be viewed in the online issue, which is available at http://onlinelibrary.wiley.com/doi/10.1002/acr.22316/abstract .
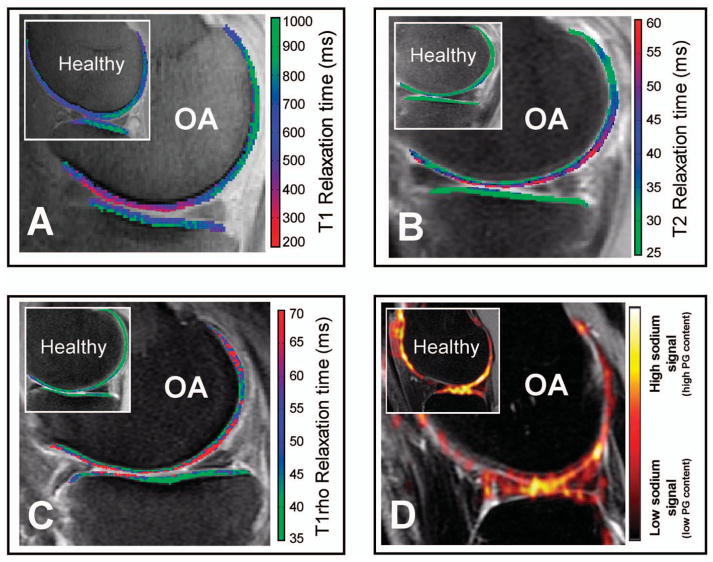
Delayed gadolinium-enhanced magnetic resonance imaging (MRI) of cartilage (dGEMRIC), T2 mapping, T1rho mapping, and sodium imaging differentiate between healthy and early-stage knee osteoarthritis (OA). Sagittal slices through the center of the medial or lateral tibiofemoral compartment of knee OA patients and healthy volunteers (insets) acquired using different quantitative MRI techniques (all images acquired in different subjects). None of the early OA patients showed clear abnormalities on the conventional MRI sequences (not shown). A, dGEMRIC color map shows a clear decrease in T1 relaxation times (purple/red) in early OA, representing loss of glycosaminoglycans. B, T2 mapping demonstrates increased T2 relaxation times (blue/purple/red) in early OA due to disorganization of the collagen matrix and increase in water content. C, T1rho mapping shows increased T1rho relaxation times (red) in a patient with moderate knee OA. D, Sodium MRI detects less sodium signal in OA compared to healthy knee cartilage (inset). PG = proteoglycan. Color figure can be viewed in the online issue, which is available at http://onlinelibrary.wiley.com/doi/10.1002/acr.22316/abstract .
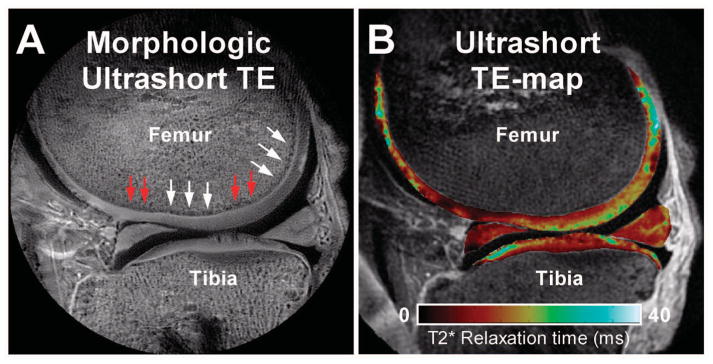
Morphologic and quantitative ultrashort echo time (TE) images of the knee. Ultrashort TE morphologic (A) and quantitative T2* (B) magnetic resonance images of a cadaveric knee (male donor, age 77 years). Note that the deepest layer of articular cartilage is clearly visible as a line of high signal intensity (A, white arrows), along with focal areas of diminished signal intensity (A, red arrows) that may suggest abnormality of the deep region. (Courtesy of Christine Chung, University of California, San Diego).
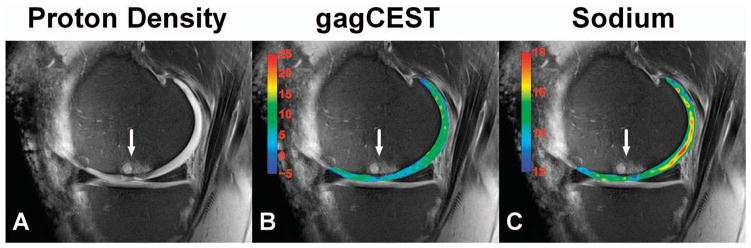
Glycosaminoglycans (GAGs)–specific chemical exchange saturation transfer (gagCEST) and sodium magnetic resonance imaging (MRI) to followup cartilage repair. Proton density (A), gagCEST (B), and sodium (C) MRIs acquired at 7T of a patient 8.7 years after autologous osteochondral transplantation (white arrow). The color overlay in (B) represents the gagCEST asymmetries in percentages (the lower the values, the less GAGs are present in the cartilage). The color overlay in (C) represents the sodium signal-to-noise ratio values (the lower the values, the less GAGs are present in the cartilage). The transplantation region (white arrow) clearly contains less GAGs compared to the posterior femoral cartilage (B and C). The CEST image (B) has a relatively high spatial resolution compared to the sodium image (C), which makes the technique promising as an outcome measure for cartilage GAG content in future research. (Courtesy of Benjamin Schmitt and Siegfried Trattnig, Medical University of Vienna, MR Center of Excellence, Vienna, Austria [154]).
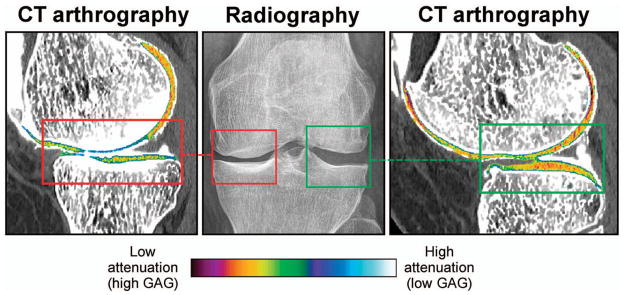
Quantitative computed tomography (CT) arthrography detects Glycosaminoglycans (GAGs) reduction in osteoarthritis. Representative image of a knee with medial joint space narrowing (red box, middle panel) and a normal lateral joint space (green box, middle panel). CT arthrography clearly shows higher radiographic attenuation values, indicating less GAGs in the medial knee compartment (red box, left panel) compared to the lateral tibiofemoral compartment (green box, right panel) (34). Color figure can be viewed in the online issue, which is available at http://onlinelibrary.wiley.com/doi/10.1002/acr.22316/abstract .
Similar articles
-
Plain radiography or magnetic resonance imaging (MRI): Which is better in assessing outcome in clinical trials of disease-modifying osteoarthritis drugs? Summary of a debate held at the World Congress of Osteoarthritis 2014.Semin Arthritis Rheum. 2015 Dec;45(3):251-6. doi: 10.1016/j.semarthrit.2015.06.001. Epub 2015 Jun 5. Semin Arthritis Rheum. 2015. PMID: 26142321 Review.
-
Noninvasive study of human cartilage structure by MRI.Methods Mol Med. 2004;101:191-217. doi: 10.1385/1-59259-821-8:191. Methods Mol Med. 2004. PMID: 15299216
-
Plain radiography in the evaluation of knee osteoarthritis.Curr Opin Rheumatol. 1997 May;9(3):263-7. doi: 10.1097/00002281-199705000-00015. Curr Opin Rheumatol. 1997. PMID: 9204264 Review.
-
How can one develop disease-modifying drugs in osteoarthritis?Curr Rheumatol Rep. 2005 Mar;7(1):22-8. doi: 10.1007/s11926-005-0005-z. Curr Rheumatol Rep. 2005. PMID: 15760577 Review.
-
Quantitative magnetic resonance imaging of articular cartilage in osteoarthritis.Eur Cell Mater. 2007 May 15;13:76-86. doi: 10.22203/ecm.v013a08. Eur Cell Mater. 2007. PMID: 17506024 Review.
Cited by
-
Evaluation of articular cartilage with quantitative MRI in an equine model of post-traumatic osteoarthritis.J Orthop Res. 2021 Jan;39(1):63-73. doi: 10.1002/jor.24780. Epub 2020 Jun 24. J Orthop Res. 2021. PMID: 32543748 Free PMC article.
-
Image Registration in Longitudinal Bone Assessment Using Computed Tomography.Curr Osteoporos Rep. 2023 Aug;21(4):372-385. doi: 10.1007/s11914-023-00795-6. Epub 2023 Jun 2. Curr Osteoporos Rep. 2023. PMID: 37264231 Free PMC article. Review.
-
Stem Cells for Cartilage Repair: Preclinical Studies and Insights in Translational Animal Models and Outcome Measures.Stem Cells Int. 2018 Feb 5;2018:9079538. doi: 10.1155/2018/9079538. eCollection 2018. Stem Cells Int. 2018. PMID: 29535784 Free PMC article. Review.
-
T2 mapping of healthy knee cartilage: multicenter multivendor reproducibility.Quant Imaging Med Surg. 2021 Apr;11(4):1247-1255. doi: 10.21037/qims-20-674. Quant Imaging Med Surg. 2021. PMID: 33816164 Free PMC article.
-
Effect of intra-articular injection of intermediate-weight hyaluronic acid on hip and knee cartilage: in-vivo evaluation using T2 mapping.Eur Radiol. 2018 Jun;28(6):2345-2355. doi: 10.1007/s00330-017-5186-0. Epub 2018 Jan 9. Eur Radiol. 2018. PMID: 29318429
References
-
- Buckwalter JA, Saltzman C, Brown T. The impact of osteoarthritis: implications for research [review] Clin Orthop Relat Res. 2004;427 (Suppl):S6–15. - PubMed
-
- Hermans J, Koopmanschap MA, Bierma-Zeinstra SM, van Linge JH, Verhaar JA, Reijman M, et al. Productivity costs and medical costs among working patients with knee osteoarthritis. Arthritis Care Res (Hoboken) 2012;64:853–61. - PubMed
Publication types
MeSH terms
Substances
Grants and funding
LinkOut - more resources
Full Text Sources
Other Literature Sources
Medical
