

Defects in GABA metabolism affect selective autophagy pathways and are alleviated by mTOR inhibition
- PMID: 24578415
- PMCID: PMC3992080
- DOI: 10.1002/emmm.201303356
Defects in GABA metabolism affect selective autophagy pathways and are alleviated by mTOR inhibition
Abstract
In addition to key roles in embryonic neurogenesis and myelinogenesis, γ-aminobutyric acid (GABA) serves as the primary inhibitory mammalian neurotransmitter. In yeast, we have identified a new role for GABA that augments activity of the pivotal kinase, Tor1. GABA inhibits the selective autophagy pathways, mitophagy and pexophagy, through Sch9, the homolog of the mammalian kinase, S6K1, leading to oxidative stress, all of which can be mitigated by the Tor1 inhibitor, rapamycin. To confirm these processes in mammals, we examined the succinic semialdehyde dehydrogenase (SSADH)-deficient mouse model that accumulates supraphysiological GABA in the central nervous system and other tissues. Mutant mice displayed increased mitochondrial numbers in the brain and liver, expected with a defect in mitophagy, and morphologically abnormal mitochondria. Administration of rapamycin to these mice reduced mTOR activity, reduced the elevated mitochondrial numbers, and normalized aberrant antioxidant levels. These results confirm a novel role for GABA in cell signaling and highlight potential pathomechanisms and treatments in various human pathologies, including SSADH deficiency, as well as other diseases characterized by elevated levels of GABA.
Figures
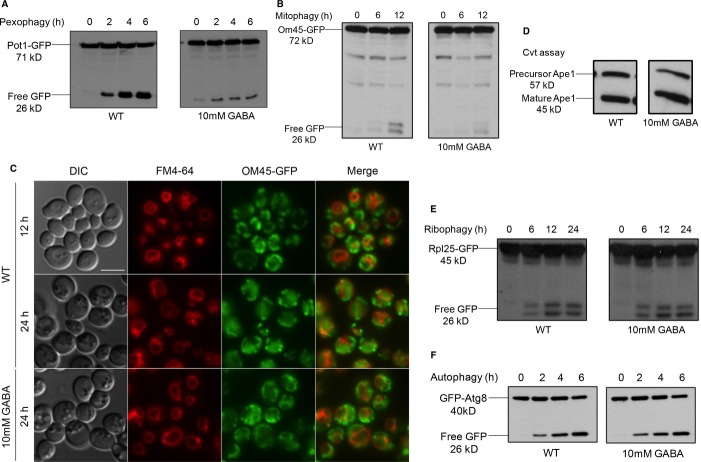
Peroxisomes were induced by growing the WT strain expressing Pot1-GFP in oleate medium to mid-log-phase, then transferred to SD-N starvation medium with or without GABA to trigger pexophagy for 6 h. GFP cleavage was analyzed at the indicated time points by immunoblotting.
Mitochondria were induced by growing the WT strain expressing OM45-GFP in YPL medium to mid-log-phase and subsequently transferring cells to either SD-N with or without GABA to trigger mitophagy for 12 h. GFP cleavage was analyzed at the indicated time points by immunoblotting.
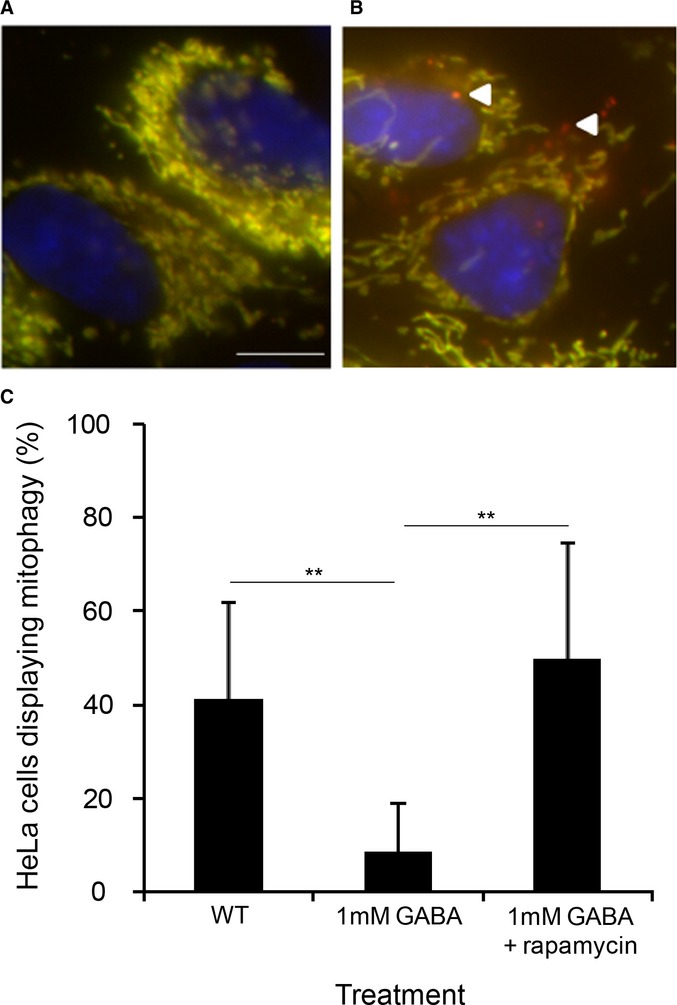
Mitophagy was monitored by fluorescence microscopy using a WT strain expressing OM45-GFP grown in YPL medium for 12 h to mid-log-phase in the presence of FM4-64, and transferred to either SD-N medium with or without GABA for 24 h. Bar, 5 μm.
The Cvt pathway was monitored using the WT strain in SD medium with or without GABA, grown to mid-log-phase, after which samples were analyzed for Ape1 maturation.
Ribophagy was monitored by growing the WT strain expressing Rpl25-GFP in SD medium to mid-log-phase and transferring cells to SD-N either with or without GABA for 24 h.
Autophagy was monitored by growing the WT strain expressing GFP-Atg8 in SD medium to mid-log-phase and transferring cells to SD-N either with or without GABA for 6 h.
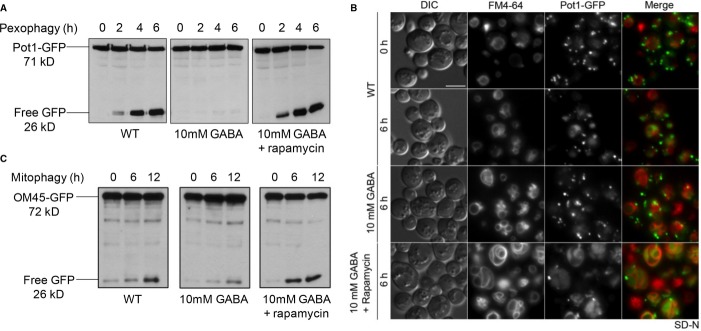
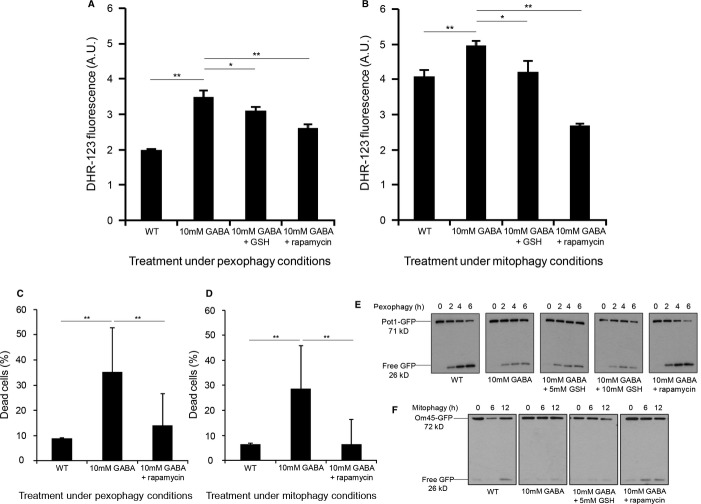
Peroxisomes were induced in oleate medium and pexophagy was monitored as described for Fig 1.
Pexophagy was monitored by fluorescence microscopy using a WT strain expressing Pot1-GFP grown in oleate medium to mid-log-phase in the presence of FM4-64, and transferred to either SD-N medium with or without GABA or to SD-N with GABA and rapamycin for 6 h. Bar, 5 μm.
Mitochondria were induced in YPL medium and mitophagy was assessed as described for Fig 1.
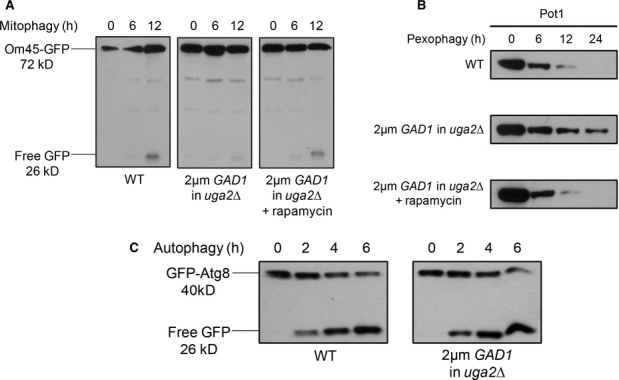
WT cells expressing OM45-GFP, along with the uga2Δ strain over-expressing the GAD1 gene and expressing OM45-GFP were grown in YPL medium to mid-log-phase. To monitor mitophagy, strains were transferred to SD-N starvation medium (with or without rapamycin).
WT strain along with the uga2Δ strain over-expressing the GAD1 gene was grown in oleate medium and pexophagy was monitored as described in Fig 1, with or without rapamycin. Samples were taken at the indicated time points, and Pot1 degradation was analyzed by immunoblotting (45 kD).
To monitor autophagy, WT cells expressing GFP-Atg8 along with the uga2Δ strain over-expressing the GAD1 gene and expressing GFP-Atg8 were grown in SD medium and transferred to SD-N.
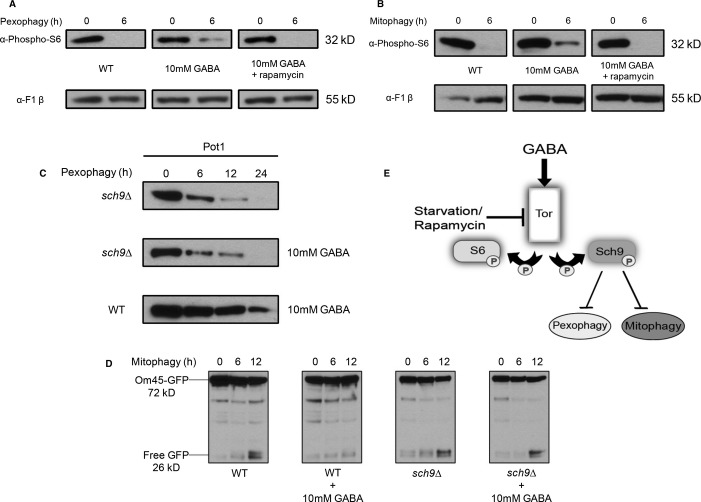
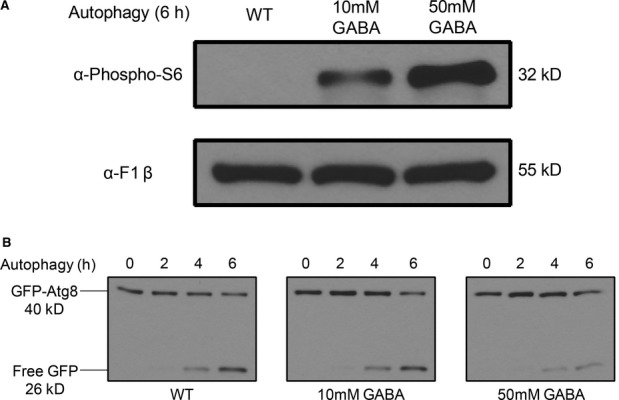
S6 phosphorylation after 6 h in SD-N was analyzed by immunoblotting with a loading control.
GFP production monitoring autophagy at the indicated time points was analyzed by immunoblotting.
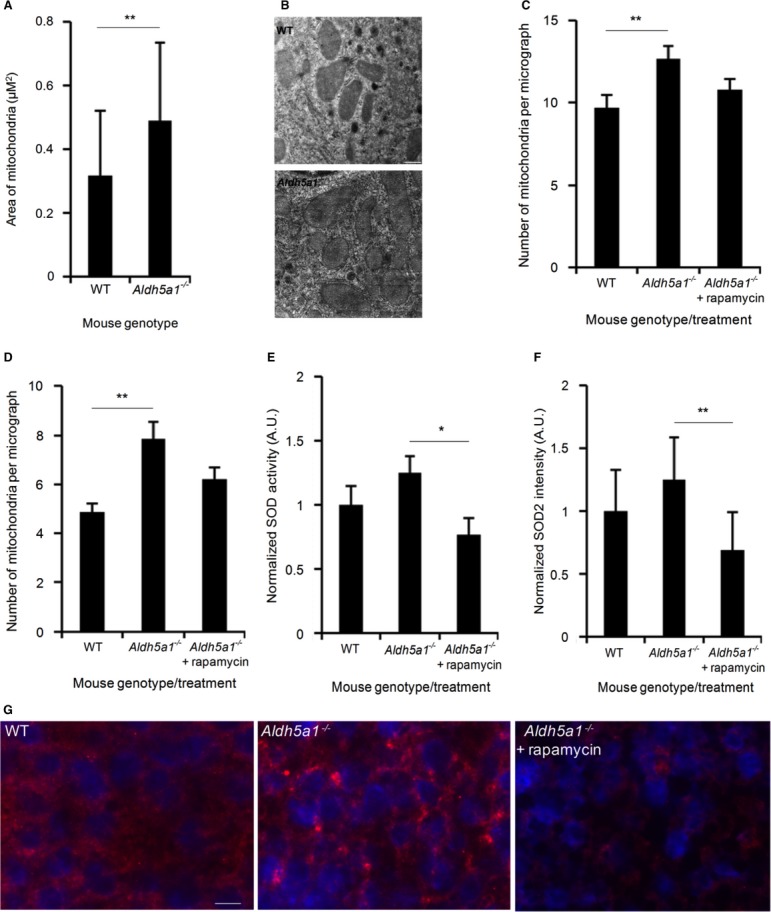
Electron microscopy images of mitochondria from WT (n = 44) and SSADH-deficient mice (Aldh5a1−/−) (n = 80) were calculated for area size.
Electron microscopy images showing typical sizes of WT and Aldh5a1−/− mice liver mitochondria. Bar, 0.5 μm.
Quantification of mitochondrial numbers from electron microscopy images of liver from WT (n = 31) and Aldh5a1−/− mice treated with vehicle (n = 39) or rapamycin (n = 34) (5 mg/kg body weight per day) via intraperitoneal injections for 3 successive days starting at day 7 of life.
Quantification of mitochondrial numbers from electron microscopy images of brain from WT (n = 23) and Aldh5a1−/− mice treated with vehicle (n = 30) or rapamycin (n = 41) (5 mg/kg body weight per day) via intraperitoneal injections for 3 successive days starting at day 7 of life.
Aldh5a1−/− mice were treated with vehicle or rapamycin (10 mg/kg body weight per day) via intraperitoneal injections for 10 successive days starting at day 10 of life. WT mice served as non-disease controls (set to 1). After sacrifice, liver homogenates were used to measure SOD enzyme activity using a colorimetric SOD activity assay.
Mitochondrial SOD2 protein levels were quantified from liver microsections using immunofluorescence microscopy and automated image analysis (WT set to 1).
Immunofluorescence images showing typical nuclear staining (DAPI, blue) and SOD2 staining (red) from WT, Aldh5a1−/− mice treated with vehicle and Aldh5a1−/− mice treated with rapamycin. Bar, 10 μm.
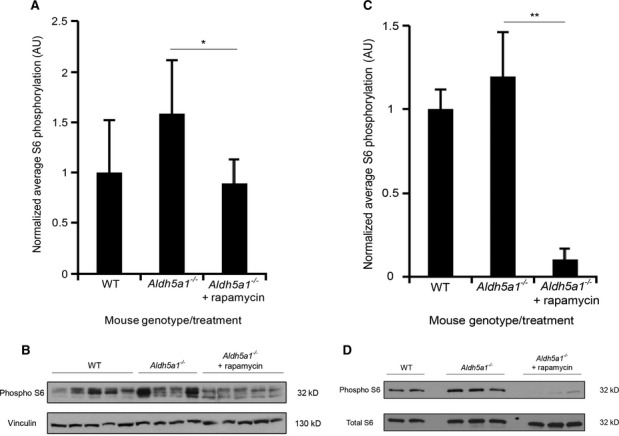
Quantification of S6 phosphorylation of liver lysates from WT (n = 5) and Aldh5a1−/− mice treated with vehicle (n = 4) or rapamycin (n = 5) after normalization (WT set to 1).
S6 phosphorylation of liver lysates analyzed by immunoblotting.
Quantification of S6 phosphorylation of brain lysates from WT (n = 2) and Aldh5a1−/− mice treated with vehicle (n = 3) or rapamycin (n = 3) after normalization (WT set to 1).
S6 phosphorylation of brain lysates analyzed by immunoblotting.
References
-
- Arnulf I, Konofal E, Gibson KM, Rabier D, Beauvais P, Derenne JP, Philippe A. Effect of genetically caused excess of brain γ-hydroxybutyric acid and GABA on sleep. Sleep. 2005;28:418–424. - PubMed
-
- Ayer A, Tan SX, Grant CM, Meyer AJ, Dawes IW, Perrone GG. The critical role of glutathione in maintenance of the mitochondrial genome. Free Radic Biol Med. 2010;49:1956–1968. - PubMed
-
- Blommaart EF, Luiken JJ, Blommaart PJ, van Woerkom GM, Meijer AJ. Phosphorylation of ribosomal protein S6 is inhibitory for autophagy in isolated rat hepatocytes. J Biol Chem. 1995;270:2320–2326. - PubMed
Publication types
MeSH terms
Substances
Supplementary concepts
Grants and funding
LinkOut - more resources
Full Text Sources
Other Literature Sources
Molecular Biology Databases
Miscellaneous
