. 2014 Apr;164(4):1905-17.
doi: 10.1104/pp.113.232660. Epub 2014 Feb 27.

Divergent roles for maize PAN1 and PAN2 receptor-like proteins in cytokinesis and cell morphogenesis

Affiliations

Divergent roles for maize PAN1 and PAN2 receptor-like proteins in cytokinesis and cell morphogenesis

Dena Sutimantanapi et al. Plant Physiol. 2014 Apr.

Abstract

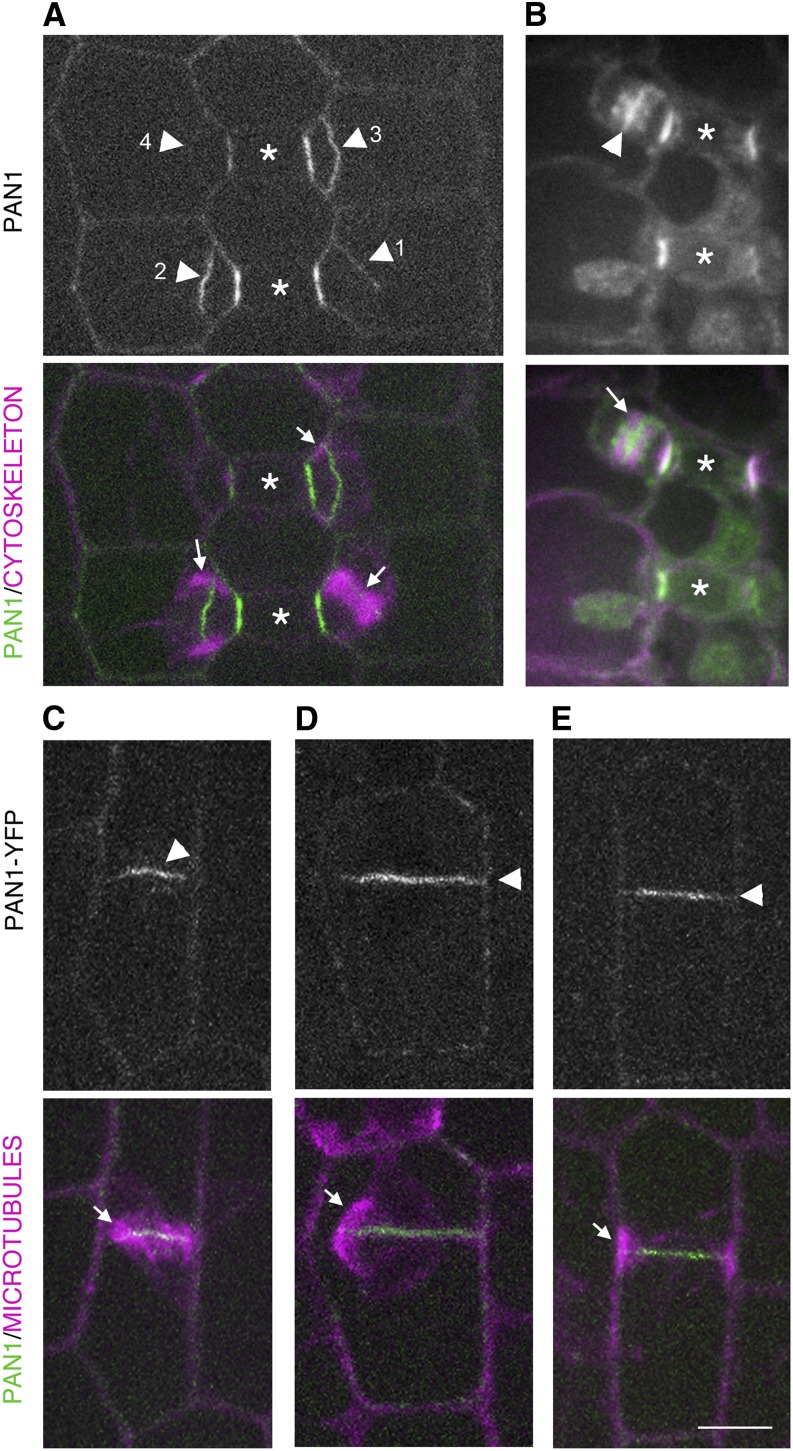
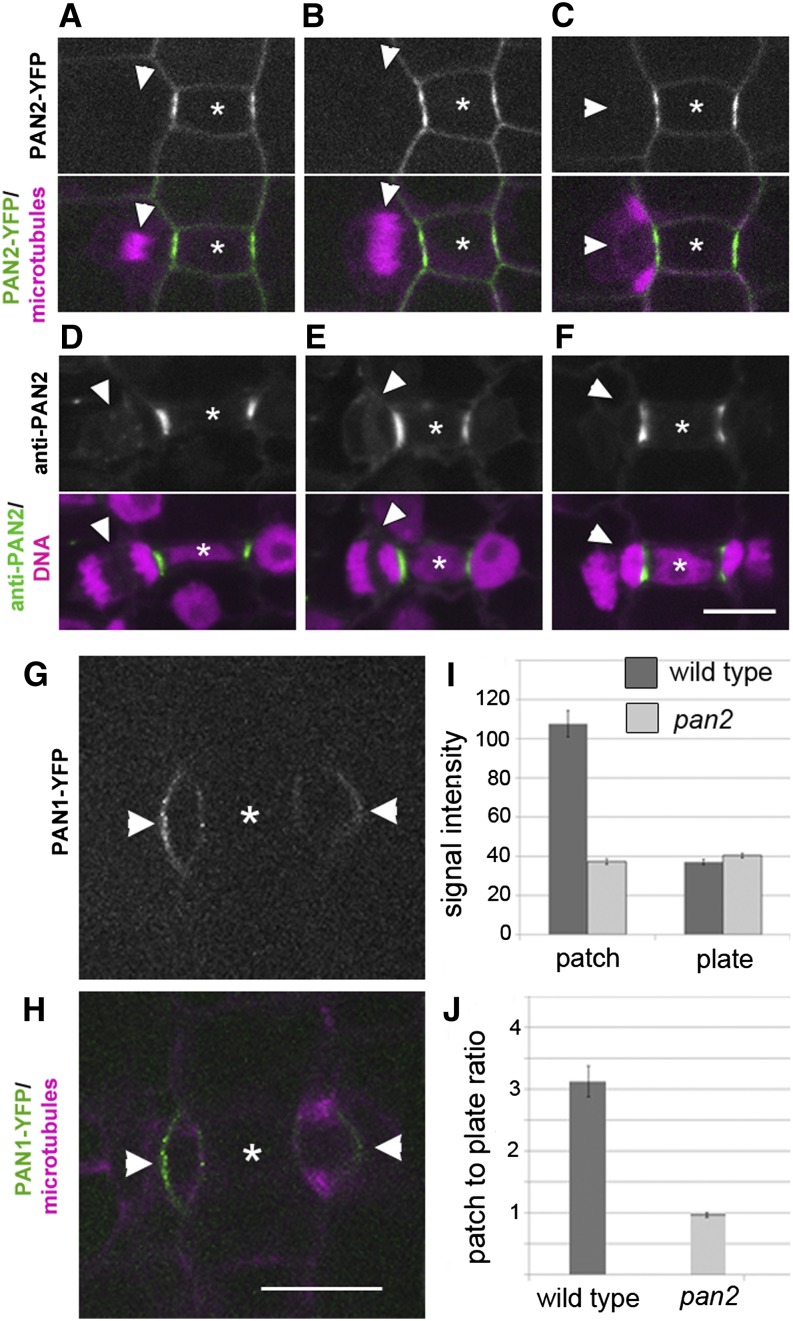
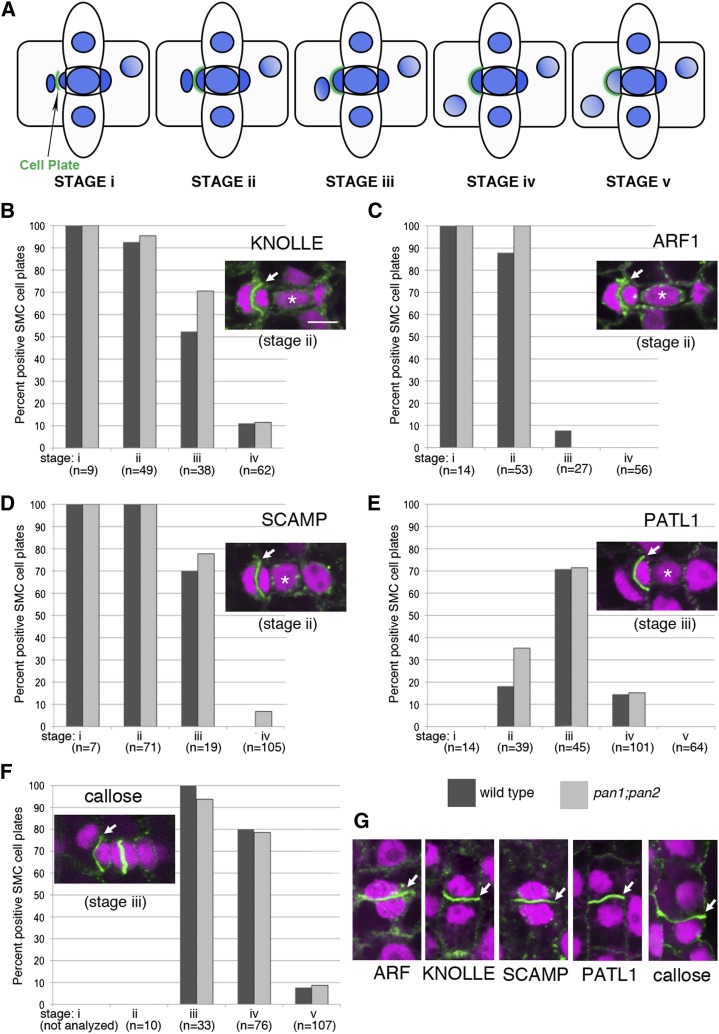
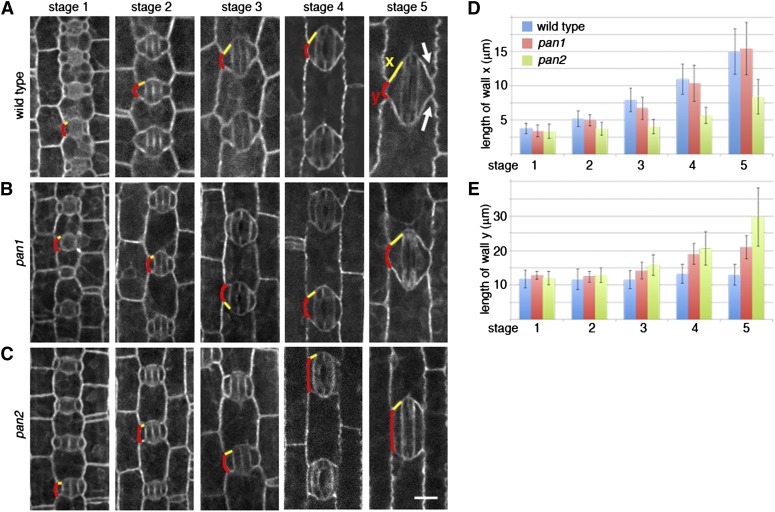
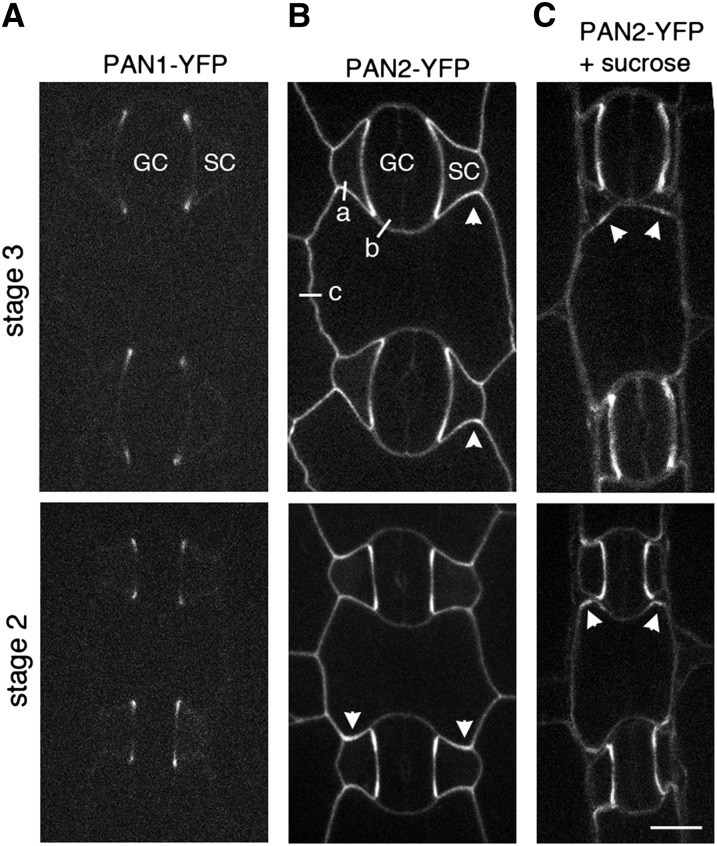
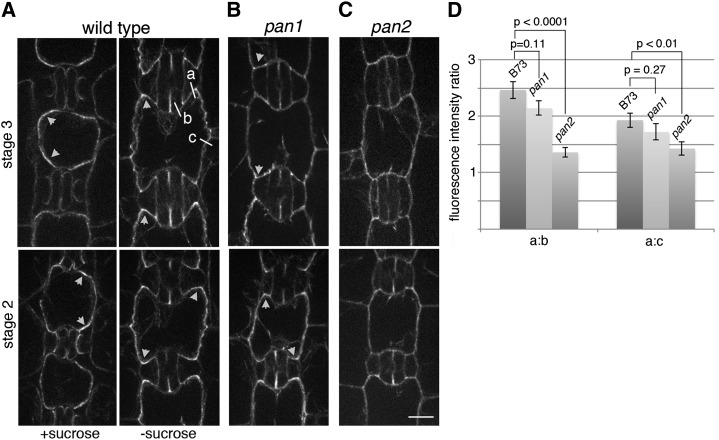
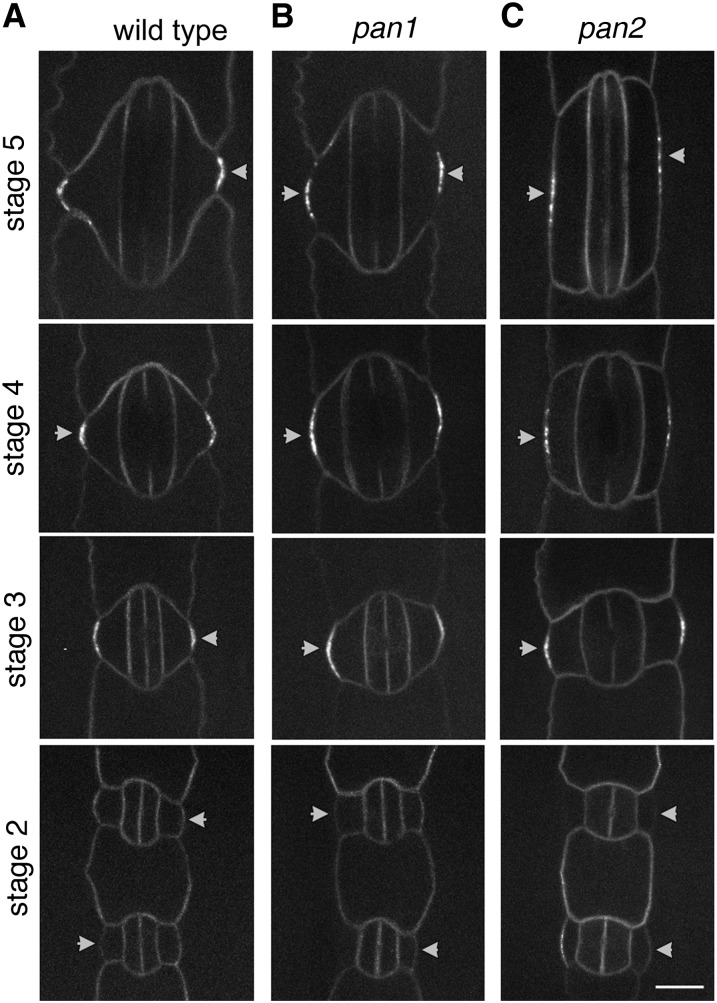
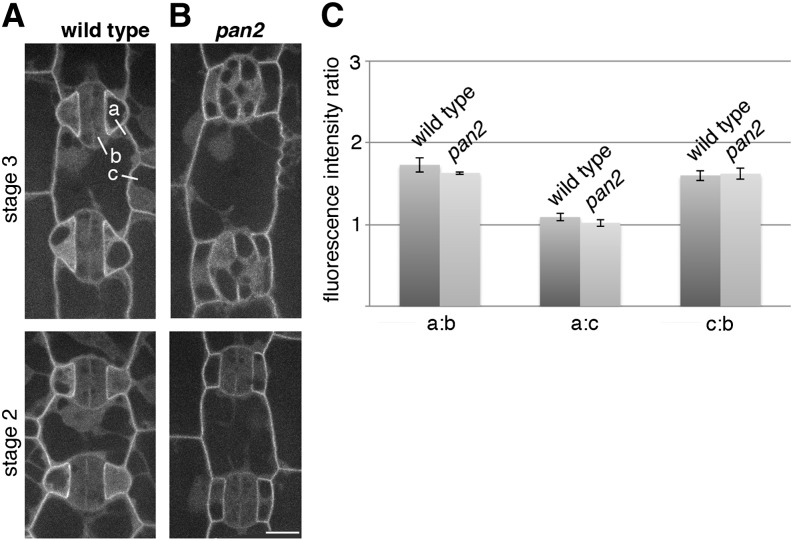
Pangloss1 (PAN1) and PAN2 are leucine-rich repeat receptor-like proteins that function cooperatively to polarize the divisions of subsidiary mother cells (SMCs) during stomatal development in maize (Zea mays). PANs colocalize in SMCs, and both PAN1 and PAN2 promote polarization of the actin cytoskeleton and nuclei in these cells. Here, we show that PAN1 and PAN2 have additional functions that are unequal or divergent. PAN1, but not PAN2, is localized to cell plates in all classes of dividing cells examined. pan1 mutants exhibited no defects in cell plate formation or in the recruitment or removal of a variety of cell plate components; thus, they did not demonstrate a function for PAN1 in cytokinesis. PAN2, in turn, plays a greater role than PAN1 in directing patterns of postmitotic cell expansion that determine the shapes of mature stomatal subsidiary cells and interstomatal cells. Localization studies indicate that PAN2 impacts subsidiary cell shape indirectly by stimulating localized cortical actin accumulation and polarized growth in interstomatal cells. Localization of PAN1, Rho of Plants2, and PIN1a suggests that PAN2-dependent cell shape changes do not involve any of these proteins, indicating that PAN2 function is linked to actin polymerization by a different mechanism in interstomatal cells compared with SMCs. Together, these results demonstrate that PAN1 and PAN2 are not dedicated to SMC polarization but instead play broader roles in plant development. We speculate that PANs may function in all contexts to regulate polarized membrane trafficking either directly or indirectly via their influence on actin polymerization.


Figures

Figure 1.
Figure 1.
PAN1 is enriched at cell plates. A, PAN1-YFP shown in monochrome (top) and green (bottom). Asterisks mark GMCs. Arrowheads 1 to 4 point to SMC cell plates at successive stages, as indicated by the associated phragmoplast (magenta and marked with arrows at bottom). PAN1-YFP is enriched relative to mother cell walls in plates 2 and 3. B, Immunolocalization of endogenous PAN1 shown in monochrome (top) and green (bottom), with actin labeling via phalloidin staining shown in magenta at bottom. Asterisks mark GMCs. PAN1 staining of an SMC cell plate is marked by the arrowhead (top), with the associated phragmoplast marked by the arrow at bottom. Staining of the phragmoplast itself does not exceed the background observed when pan1 protein null mutants are labeled in parallel. C to E, PAN1-YFP localization (monochrome at top and green at bottom) in three separate cells illustrating successive stages of cell plate formation, as indicated by the associated phragmoplasts (magenta) in transversely dividing epidermal cells. Arrowheads at top mark cell plates; arrows at bottom mark phragmoplasts. PAN1-YFP is enriched at cell plates relative to the surrounding mother cell surface to an approximately equal degree at all stages of cell plate development shown. Bar = 10 µm for all images.
Figure 2.
Figure 2.
PAN2 is undetectable at cell plates and not required for cell plate localization of PAN1. A to C, PAN2-YFP shown in monochrome (top) and green (bottom), along with CFP-tubulin in magenta, at successive stages of cell plate formation seen in three separate SMCs. Asterisks mark GMCs, which are flanked by PAN2-YFP patches in adjacent SMCs. Arrowheads point to the locations of cell plates (with no detectable PAN2-YFP), as indicated by the positions of the associated phragmoplasts seen at bottom. D to F, Anti-PAN2 staining shown in monochrome (top) and green (bottom), along with propidium iodide-stained nuclei shown in magenta, at successive stages of cytokinesis seen in three separate SMCs. Asterisks mark GMCs, which are flanked by PAN2 patches in adjacent SMCs. Arrowheads point to the locations of cell plates (with no detectable PAN2 staining), as indicated by the positions of associated nuclei. Bar = 10 µm for A to F. G and H, PAN1-YFP (monochrome in A and green in B) in two pan2-2 mutant SMCs flanking GMCs (asterisks), with arrowheads pointing to cell plates. As indicated by the presence of a late-stage phragmoplast (CFP-tubulin signal; magenta in H), the SMC on the right is nearing the point of cell plate attachment while the SMC on the left has a recently attached cell plate. Although these SMCs lack PAN1-YFP patches of normal intensity at the site of GMC contact (e.g. as seen for the wild type in Fig. 1), the PAN1-YFP signal level at cell plates is similar to that of the wild type. Bar = 10 µm. I, Quantitative analysis of PAN1-YFP signal intensity (arbitrary units as measured via ImageJ) in SMCs at GMC contact sites (patch) and the cell plate (plate). J, As in I, but with results shown as a ratio of signal measured at GMC contact sites versus the cell plate. n = 62 cells analyzed for the wild type and 72 cells analyzed for pan2 mutants; error bars show se. In wild-type SMCs, PAN1-YFP signal is approximately 3-fold stronger at GMC contact sites than at cell plates (patch-to-plate ratio of approximately 3). In pan2 mutant SMCs, PAN1-YFP signal intensity is reduced at GMC contact sites but not at cell plates, reducing the patch-to-plate signal ratio to approximately 1.
Figure 3.
Figure 3.
Analysis of cell plate markers in wild-type versus pan1;pan2 mutant cell plates. A, Schematic illustration of the stages of SMC cytokinesis defined for this analysis. At stages i and ii, both daughter nuclei are condensed. At stage i, the cell plate is not yet fully attached, whereas at stage ii, it is fully attached to the mother cell wall. Stages iii, iv, and v are distinguished by the positions and degrees of condensation of daughter nuclei as illustrated (with darker blue and smaller size indicating a higher degree of SMC daughter nuclei condensation). B to F, Representative images of SMC cell plate labeling and the proportion of SMC cell plates at each stage (among n examined as indicated) in the wild type (dark gray bars) versus the pan1;pan2 double mutant (light gray bars) labeled with anti-KNOLLE (B), anti-ARF1 (C), anti-SCAMP (D), anti-PATL1 (E), and aniline blue (F). The results indicate that the timing of the recruitment and removal of these cell plate markers is similar in mutant SMC plates compared with the wild type. G, Sample images showing cell plates in symmetrically dividing leaf epidermal cells labeled with the same reagents used in B to F, further illustrating the specificity of each label for cell plates. Bar = 10 µm for all images.
Figure 4.
Figure 4.
Analysis of stomatal morphogenesis in the wild type versus pan mutants. A to C, Midplane confocal slices through the epidermal layer of leaves of the indicated genotypes expressing YFP-tubulin to permit the visualization of cell outlines. Stomatal morphogenesis is divided into five stages. At stage 1, subsidiary cells have just formed; at stage 5, all cells are fully expanded. All images are shown at the same magnification to illustrate how cell shapes change as they expand. The wall produced by asymmetric cytokinesis in SMCs is defined as wall y, and one example in each image is highlighted in red. The subsidiary wall segment linking wall y to the guard cells is defined as wall x, with one example in each image highlighted in yellow. Arrows in the stage 5 wild-type image indicate points that form on the ends of interstomatal cells as subsidiary cells acquire a triangular shape. Bar = 14 µm for all images. D and E, Analysis of the lengths of wall x (D) and wall y (E) at each stage of stomatal morphogenesis in plants of the indicated genotypes (n = 24–45 cells analyzed at each stage for each genotype; error bars show sd). The altered shapes of subsidiary cells in pan2 mutants result from increased elongation of wall y and decreased elongation of wall x.
Figure 5.
Figure 5.
Enrichment of PAN2-YFP in points that emerge at the corners of interstomatal cells. Stages illustrated refer to those defined in Figure 6. Guard cells and subsidiary cells are labeled GC and SC, respectively. A, PAN1-YFP is expressed weakly at the developmental stages illustrated, and almost all detectable signal is found at the interface between subsidiary cells and guard cells. B, PAN2-YFP is detectable at the surfaces of all cells but is enriched at the interface between interstomatal cells and subsidiary cells (arrowheads), reaching a maximum signal intensity at the position marked a. Fluorescence intensity values at positions a, b, and c were analyzed quantitatively as described in the text. C, Tissues were mounted in 0.7 m Suc to achieve the separation of subsidiary and interstomatal cell surfaces, revealing PAN2-YFP enrichments in interstomatal cells (arrowheads). Bar = 10 µm for all images.
Figure 6.
Figure 6.
Cortical F-actin enrichment at the corners of interstomatal cells is reduced in pan2 mutants. A to C, YFP-ABD2-YFP labeling illustrates the distribution of F-actin in expanding stomata and interstomatal cells at stages 2 and 3 in the wild type (A), pan1 (B), and pan2 (C). Arrowheads in A and B point to areas of cortical F-actin enrichment seen at the interface between interstomatal cells and subsidiary cells in the absence of Suc. Mounting of wild-type tissue in 0.7 m Suc to achieve separation between subsidiary and interstomatal cells reveals that these cortical F-actin enrichments are in the interstomatal cells (arrowheads). D, Quantitative analysis of YFP-ABD2-YFP signal intensity ratios at position a versus b and position a versus c as defined in A (n = 34–42 cells analyzed per genotype; error bars show se). P values illustrate the significance of the differences seen for each pan mutant relative to the wild type obtained via Student’s t test. Cortical F-actin enrichment at interstomatal cell corners is significantly reduced (P < 0.01) in pan2 but not in pan1.
Figure 7.
Figure 7.
PAN1- and PAN2-independent polarization of ZmPIN1a-YFP in expanding subsidiary cells. All images are shown at the same magnification to illustrate cell enlargement at successive stages of stomatal morphogenesis, numbered as illustrated in Figure 4. Arrowheads point to subsidiary cell surface segment y produced by the asymmetric cytokinesis of subsidiary mother cells. ZmPIN1a-YFP becomes polarized toward this segment of the cell surface shortly after its formation in the wild type (A). In pan1 (B) and especially in pan2 (C), where wall segment y elongates more than in the wild type, ZmPIN1a-YFP remains concentrated at the center of this segment, maintaining a polarized distribution similar to that seen in the wild type. Bar = 10 µm for all images.
Figure 8.
Figure 8.
YFP-ROP2 localization in expanding stomata and interstomatal cells. A and B, The wild type (A) and the pan2 mutant (B) at stage 2 (bottom) and stage 3 (top). YFP-ROP2 distribution was not analyzed in pan1 mutants because there was very little difference in the shapes of subsidiary and interstomatal cells in pan1 mutants compared with the wild type. The distribution of YFP-ROP2 on subsidiary versus interstomatal cell surfaces could not be determined via plasmolysis experiments, because YFP-ROP2 signal was lost very rapidly from the cell surface in the presence of Suc at concentrations sufficient to cause plasmolysis. Bar = 10 µm for all images. C, Ratios of fluorescence intensities measured at positions a, b, and c as marked in A (n ≥ 25 cells analyzed per genotype). Error bars show se. In both genotypes and stages, a modest enrichment of YFP-ROP2 was observed at positions a and c relative to position b. However, in contrast to YFP-ABD2-YFP and PAN2-YFP, no enrichment of YFP-ROP2 was evident at position a versus position c. Moreover, no significant difference was observed in any of the measured ratios when comparing the wild type versus the pan2 mutant (P > 0.2 by Student’s t test for all three comparisons).

Similar articles

Cited by

References

    1. Apodaca G, Gallo LI, Bryant DM. (2012) Role of membrane traffic in the generation of epithelial cell asymmetry. Nat Cell Biol 14: 1235–1243 - PMC - PubMed
    1. Boudeau J, Miranda-Saavedra D, Barton GJ, Alessi DR. (2006) Emerging roles of pseudokinases. Trends Cell Biol 16: 443–452 - PubMed
    1. Cárdenas L, Lovy-Wheeler A, Kunkel JG, Hepler PK. (2008) Pollen tube growth oscillations and intracellular calcium levels are reversibly modulated by actin polymerization. Plant Physiol 146: 1611–1621 - PMC - PubMed
    1. Cartwright HN, Humphries JA, Smith LG. (2009) PAN1: a receptor-like protein that promotes polarization of an asymmetric cell division in maize. Science 323: 649–651 - PubMed
    1. Castells E, Casacuberta JM. (2007) Signalling through kinase-defective domains: the prevalence of atypical receptor-like kinases in plants. J Exp Bot 58: 3503–3511 - PubMed

Publication types

LinkOut - more resources