. 2014 Feb 27:5:73.
doi: 10.3389/fphys.2014.00073. eCollection 2014.

Monitoring training status with HR measures: do all roads lead to Rome?

Affiliations

Monitoring training status with HR measures: do all roads lead to Rome?

Martin Buchheit. Front Physiol. .

Abstract

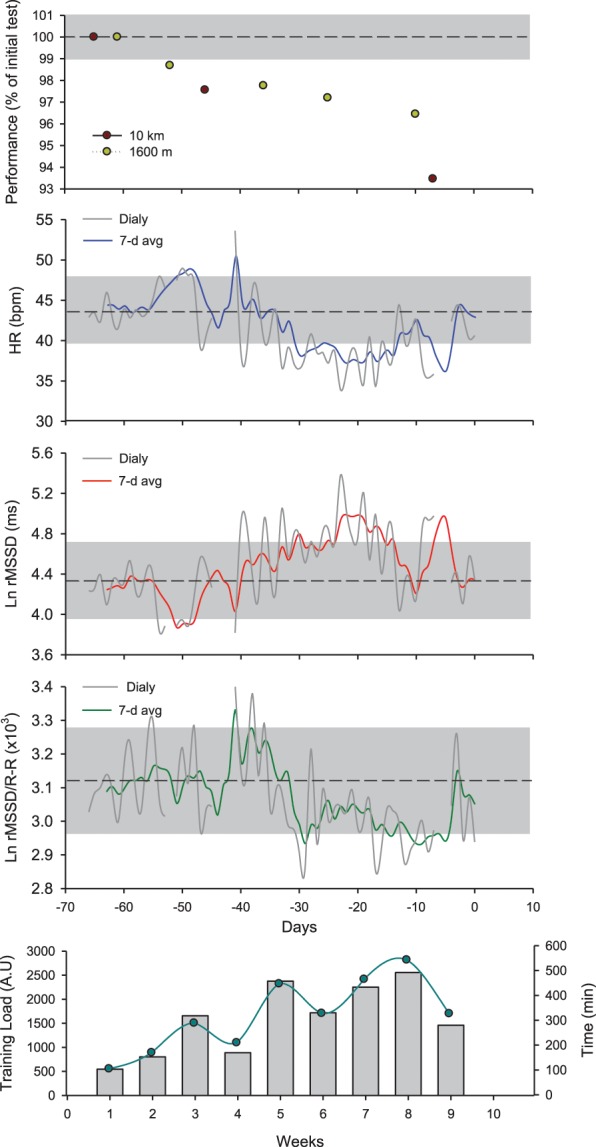
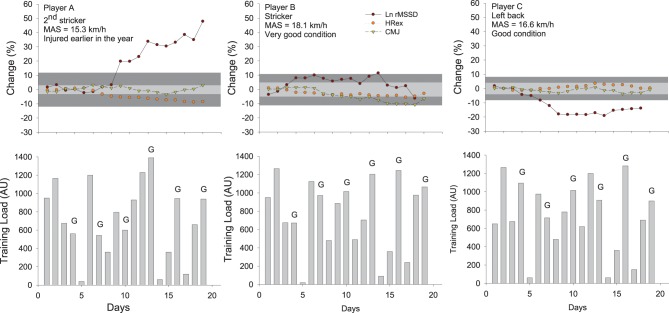
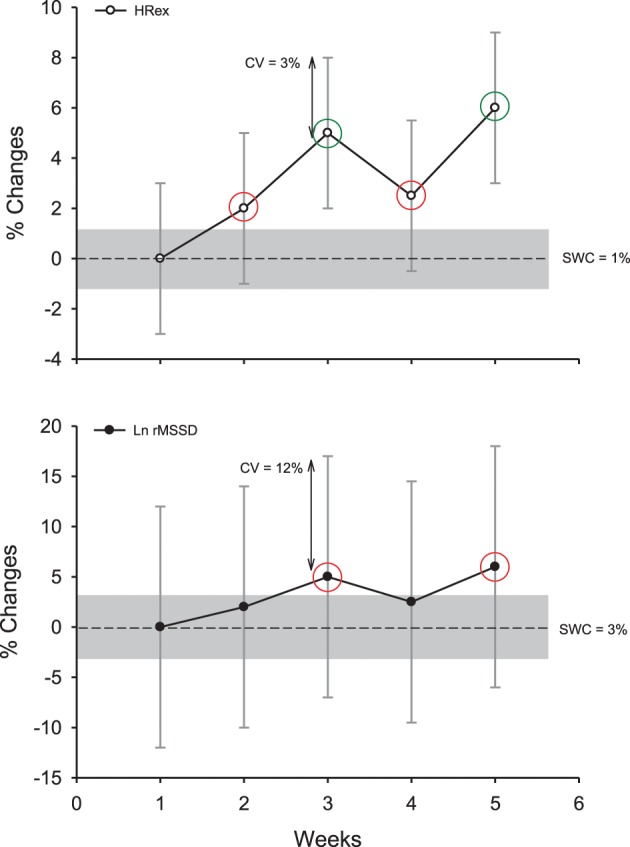
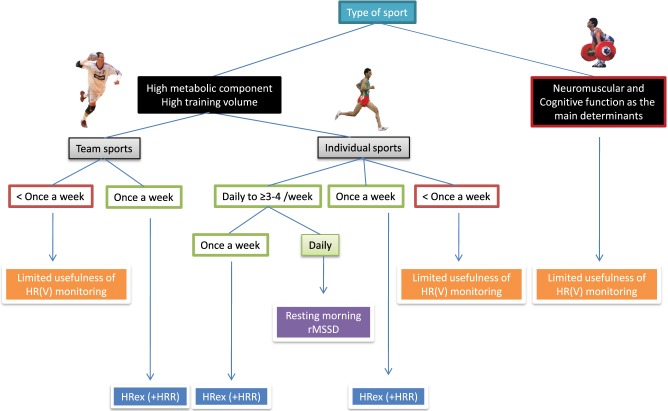
Measures of resting, exercise, and recovery heart rate are receiving increasing interest for monitoring fatigue, fitness and endurance performance responses, which has direct implications for adjusting training load (1) daily during specific training blocks and (2) throughout the competitive season. However, these measures are still not widely implemented to monitor athletes' responses to training load, probably because of apparent contradictory findings in the literature. In this review I contend that most of the contradictory findings are related to methodological inconsistencies and/or misinterpretation of the data rather than to limitations of heart rate measures to accurately inform on training status. I also provide evidence that measures derived from 5-min (almost daily) recordings of resting (indices capturing beat-to-beat changes in heart rate, reflecting cardiac parasympathetic activity) and submaximal exercise (30- to 60-s average) heart rate are likely the most useful monitoring tools. For appropriate interpretation at the individual level, changes in a given measure should be interpreted by taking into account the error of measurement and the smallest important change of the measure, as well as the training context (training phase, load, and intensity distribution). The decision to use a given measure should be based upon the level of information that is required by the athlete, the marker's sensitivity to changes in training status and the practical constrains required for the measurements. However, measures of heart rate cannot inform on all aspects of wellness, fatigue, and performance, so their use in combination with daily training logs, psychometric questionnaires and non-invasive, cost-effective performance tests such as a countermovement jump may offer a complete solution to monitor training status in athletes participating in aerobic-oriented sports.

Keywords: assessing changes; endurance sports; fatigue; heart rate recovery; heart rate variability; progressive statistics; team sports; training response.


Figures

Figure 1
Figure 1
Overnight hypnogram and heart rate (HR) patterns during two nights subjectively rated as very good (i.e., 5/5 on a 5-point scale) by a 25-year old team sport athlete. Physical activity (no intense exercise) preceding each night was similar (resting day, i.e., 2809 vs. 2826 Kcal, as measured by Tri-axial accelerometers) (Buchheit et al., ; Brandenberger et al., 2005). Note that while both sleep efficiency (SE) and total slow wave sleep (SWS) time are similar over the two complete nights (which is consistent with the subjective rating of the night), the actual sleep stage distribution and fragmentation between the first 4 h of the 2 nights differ markedly [i.e., greater proportion of SWS during the first part of Night A, 43 vs. 24%, and more arousals (Ar, changes in sleep stages), 59 vs. 35]. The greater sleep fragmentation during night A is associated with more HR arousals, which directly increases (1) the number of rapid (beat-by-beat) changes in HR [reflected by both the power density in the high frequencies (HF) or the square root of the mean of the sum of the squares of differences between adjacent normal R-R intervals, Ln rMSSD] and (2) more importantly, the power spectral density in the low frequencies (LF), which, in turn, increases dramatically the LF/HF ratio. Compared with Night B, this results in a paradoxical autonomic response, where a greater vagal activity (Ln rMSSD) is super-imposed to a greater sympathetic background (greater HR and LF/HF ratio). Autonomic co-activation may explain these observations (Tulppo et al., 1998a), however, this is more likely a limitation of the HRV analysis methods to capture the actual ANS state during non-stationary periods such as sleep. Additionally, the greater Ln rMSSD and LF/HF values are inconsistent with the greater proportion of SWS during the first part of Night A, since SWS is generally is generally associated with both reduced Ln rMSSD and LF/HF (Otzenberger et al., ; Brandenberger et al., 2005). Therefore, the calculation and interpretation of HRV indices over a large period of sleep, with no consideration of the actual sleep stage patterns, is particularly challenging and remains questionable for monitoring purposes. REM: rapid eye movements.
Figure 2
Figure 2
Example of the different heart rate (HR) recording conditions during the day time. HRex, exercise HR; HRR, HR recovery over 60s; HRV, HR variability.
Figure 3
Figure 3
Effect of an ectopic beat on traditional heart rate (HR) variability (HRV) indices. R-R intervals recorded in supine position for 5 min with data either non-edited (upper left panel) or with beat removal and linear interpolation with adjacent values (upper right panel). Middle panels show the associated power spectral density (PSD) distribution on a spectrogram (Kubio HRV, 2.1, Biosignal Analysis and Medical Imaging Group, Kuopio, Finland) and lower panels, the common HRV indices derived from those two R-R series. SDNN, standard deviation of normal R-R intervals; rMSSD, square root of the mean of the sum of the squares of differences between adjacent normal R-R intervals; SD1, standard deviation of instantaneous beat-to-beat R-R interval variability measured from Poincaré plots; SD2, standard deviation of long-term beat-to-beat R-R interval variability measured from Poincaré plots; LF, low-frequency oscillations, HF, high-frequency oscillations.
Figure 4
Figure 4
Average changes (90% confidence intervals) in the logarithm of the square root of the mean of the sum of the squares of differences between adjacent normal R–R intervals (Ln rMSSD) measured at rest after awakening in 6 runners (4M-2F, 38.2 ± 1.8 years, 170.7 ± 7.9 cm, 65.0 ± 11.6 kg, 6.8 ± 2.1 h of training per week) before, during and following the 20th “Marathon des sables” (2005, 253 km in 7 days under hot environment, with temperature sometimes exceeding 50°C). The increase in Ln rMSSD after the 4th day of race is unlikely reflective of general fatigue and fitness (which were actually reported to be deteriorated by the runners) but rather reflects changes in plasma volume consecutive to the combination of exercise-induced hypervolemia (Buchheit et al., 2009) and heat acclimatization responses (Ladell, ; Buchheit et al., 2013a). Unpublished data (Buchheit et al.).
Figure 5
Figure 5
Changes in running performance (best time over a self-paced 5 × 1600-m interval training session and an all-out 10-km run), resting heart rate (HR), logarithm of the square root of the mean of the sum of the squares of differences between adjacent normal R-R intervals measured at rest after awakening (Ln rMSSD), the Ln rMSSD to mean R-R interval (Ln rMSSD/R-R) and training load (perceived exertion, CR-10 Borg scale × training duration Impellizzeri et al., 2004) and volume in a distance runner (32 year-old, VO2max = 59 ml/min/kg, vVO2max = 18 km/h) over the 9-week training program leading to his first marathon (3 h 15 min). The shaded areas represent trivial changes (see Table 2). Ln rMSSD and running performance change as a function of the training progression. While running performance improves continuously throughout, Ln rMSSD changes follow a bell-shaped relationship, with an initial increase followed by 2 consecutive reductions during the last phase of training. Interesting, while the decrease in Ln rMSSD during week 7–8 is concomitant with a plateau of the Ln rMSSD/R-R ratio, the decrease observed during week 9 occurs with an increase of the Ln rMSSD/R-R ratio. This suggests that the decrease during week 7–8 is likely related to a saturation phenomenon (further increase in vagal activity), while that seen at week 9 is more likely related to a decreased vagal activity/increased sympathetic activity (which might be needed to reach greater exercise intensity during competition). This interpretation has important implications when using HRV to guide the training process, and is only possible when using the combination of both indices.
Figure 6
Figure 6
Changes in the logarithm of the square root of the mean of the sum of the squares of differences between adjacent normal R-R intervals measured after exercise (Ln rMSSD), submaximal exercise heart rate (HRex), counter movement jump height (CMJ) and training load (session-rate of perceived exertion load × training/match duration Impellizzeri et al., 2004) in three highly-trained young soccer players during a competitive training camp. The gray areas represent trivial changes (See Table 2) for HRex and CMJ (light gray) and HRV (dark gray). Errors bars (typical error of measurement, see Figure 7) have been omitted for clarity. While this might not be that clear when considering the actual spread of the TE, any change that is outside the gray areas is considered here as substantial (section Interpreting Changes in Heart Rate Measures: “Statistics are our weapons”). The changes in these variables in the three different players show different scenarios and illustrate how these indices can be used in combination to infer on training status and adaptations. Player A likely showed a positive adaptation to the camp (decrease in HRex and increase in Ln rMSSD), probably related to the fact that he arrived fresh and was a little bit detrained at the start following his previous injury. Playing at his position didn't require large high-intensity running demands (Buchheit et al., 2010c), so the balance between daily load and recovery was likely optimal for his fitness to improve (decrease in HRex) without compromising neuromuscular performance (CMJ remained stable). Player B, who was used to perform a very large amount of high-intensity actions during games as a striker, presented a stable fitness (HRex) and managed to maintain his ANS status into normal ranges, probably due to his very high fitness levels that may have allowed him to partially cope with the camp load (reduced relative intensity during games Mendez-Villanueva et al., 2013). However, neuromuscular fatigue progressively increased (decreased CMJ), consistent with the large playing demands. Finally, player C showed stable fitness and CMJ performance, but a clear decrease in HRV. He played the entire duration of games and in relation to his average fitness level, might not have completely coped with the load by the end of the camp. Nevertheless, the fact that his CMJ performance remained stable is consistent with the moderate neuromuscular demands of playing wide defender within his team's system of play (Buchheit et al., 2010c). MAS: maximal aerobic speed.
Figure 7
Figure 7
Example of the decision process to interpret changes in exercise heart rate (HRex) and the logarithm of the square root of the mean of the sum of the squares of differences between adjacent normal R-R intervals (Ln rMSSD) in an individual athlete, while accounting for the uncertainty or the noise of each measure (expressed as a coefficient of variation, CV) and the so-called smallest worthwhile change (SWC; Table 2, where the gray areas represent trivial changes). Green circles show clear and substantial changes; red circles show unclear changes although being out of the “trivial zone” (the CV overlaps both zero and the SWC). Note that despite similar percentage changes for the two HR-derived indexes, only changes in HRex are interpreted as substantial.
Figure 8
Figure 8
Decision chart for the selection of heart rate (HR) measures based on sport participation and implementation possibilities. HRV, heart rate variability; rMSSD, logarithm of the square root of the mean of the sum of the squares of differences between adjacent normal R-R intervals measured after exercise; HRex, submaximal exercise heart rate; HRR, heart rate recovery.
Figure 9
Figure 9
Time course of the logarithm of the square root of the mean of the sum of the squares of differences between adjacent normal R-R intervals measured supine at rest in the morning (Ln rMSSD) and perceived muscle soreness (Soreness, 0–10 scale) in a distance runner (32 year-old, VO2max = 59 ml/min/kg, vVO2max = 18 km/h) before and after his first mountain trail (53 km, 4400 m of positive ascent in 8 h 22 min). Training/competitive load was provided as perceived exertion (CR-10 Borg scale) × training/race duration (Impellizzeri et al., 2004). All sessions were run-based except the one at post-race +5 days which was a bike session. The green area represents the post-race recovery period. Gray areas represent trivial changes for both Ln RMSSD and Soreness. Note that post-race Ln rMSSD recovers within 2 days and rebounds above pre-race levels within 5 days. The recovery time course of Ln rMSSD unexpectedly mirrors the dramatic increase in post-race Soreness. The impressive increase in Soreness (12/10 scale!) is likely related to the fact that the runner was only used to run on flat courses (i.e., marathon training, Figure 5) and not specially prepared for mountain running at that time. The post-race changes in HRV follow initially the expected hemostasis recovery (rebound), and then likely reflect a detraining state after the first week of inactivity.

Similar articles

Cited by

References

    1. Achten J., Jeukendrup A. E. (2003). Heart rate monitoring: applications and limitations. Sports Med. 33, 517–538 10.2165/00007256-200333070-00004 - DOI - PubMed
    1. Al Haddad H., Laursen P. B., Chollet D., Ahmaidi S., Buchheit M. (2011). Reliability of resting and postexercise heart rate measures. Int. J. Sports Med. 32, 598–605 10.1055/s-0031-1275356 - DOI - PubMed
    1. Al Haddad H., Parouty J., Buchheit M. (2012). Effect of daily CWI on HRV and subjective ratings of well-being in highly trained swimmers. Int. J. Sports Physiol. Perform. 7, 33–38 - PubMed
    1. Aubert A. E., Seps B., Beckers F. (2003). Heart rate variability in athletes. Sports Med. 33, 889–919 10.2165/00007256-200333120-00003 - DOI - PubMed
    1. Bangsbo J., Iaia F. M., Krustrup P. (2008). The Yo-Yo intermittent recovery test: a useful tool for evaluation of physical performance in intermittent sports. Sports Med. 38, 37–51 10.2165/00007256-200838010-00004 - DOI - PubMed