

Radioembolization and the Dynamic Role of (90)Y PET/CT
- PMID: 24579065
- PMCID: PMC3936249
- DOI: 10.3389/fonc.2014.00038
Radioembolization and the Dynamic Role of (90)Y PET/CT
Abstract
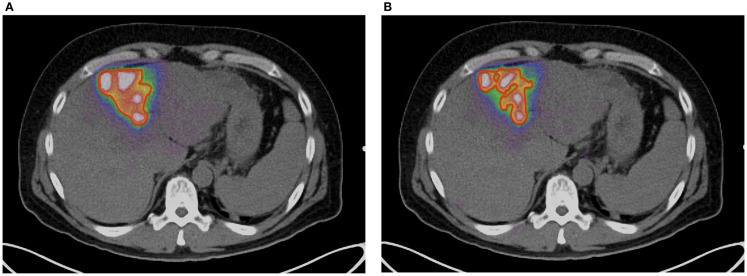
Before the advent of tomographic imaging, it was postulated that decay of (90) Y to the 0(+) excited state of (90)Zr may result in emission of a positron-electron pair. While the branching ratio for pair-production is small (~32 × 10(-6)), PET has been successfully used to image (90) Y in numerous recent patients and phantom studies. (90) Y PET imaging has been performed on a variety of PET/CT systems, with and without time-of-flight (TOF) and/or resolution recovery capabilities as well as on both bismuth-germanate and lutetium yttrium orthosilicate (LYSO)-based scanners. On all systems, resolution and contrast superior to bremsstrahlung SPECT has been reported. The intrinsic radioactivity present in LYSO-based PET scanners is a potential limitation associated with accurate quantification of (90) Y. However, intrinsic radioactivity has been shown to have a negligible effect at the high activity concentrations common in (90) Y radioembolization. Accurate quantification is possible on a variety of PET scanner models, with or without TOF, although TOF improves accuracy at lower activity concentrations. Quantitative (90) Y PET images can be transformed into 3-dimensional (3D) maps of absorbed dose based on the premise that the (90) Y activity distribution does not change after infusion. This transformation has been accomplished in several ways, although the most common is with the use of 3D dose-point-kernel convolution. From a clinical standpoint, (90) Y PET provides a superior post-infusion evaluation of treatment technical success owing to its improved resolution. Absorbed dose maps generated from quantitative PET data can be used to predict treatment efficacy and manage patient follow-up. For patients who receive multiple treatments, this information can also be used to provide patient-specific treatment-planning for successive therapies, potentially improving response. The broad utilization of (90) Y PET has the potential to provide a wealth of dose-response information, which may lead to development of improved radioembolization treatment-planning models in the future.
Keywords: 90 Y PET; post-treatment imaging; quantitative imaging; radioembolization; radioembolization dosimetry.
Figures
References
-
- Kappadath SC. SU-GG-I-163: a scatter correction algorithm for quantitative yttrium-90 SPECT imaging. Med Phys (2010) 37(6):3139.10.1118/1.3468199 - DOI
-
- Johnson OE, Johnson RG, Langer LM. Evidence for a 0+ first excited state in Zr90. Phys Rev (1955) 98:1517–810.1103/PhysRev.98.1517 - DOI
-
- Ford KW. Predicted 0+ level in Zr90. Phys Rev (1955) 98:1516–710.1103/PhysRev.98.1516 - DOI
Publication types
LinkOut - more resources
Full Text Sources
Other Literature Sources