

Comparative Study
doi: 10.1186/gb-2014-15-3-r46.
Kraken: ultrafast metagenomic sequence classification using exact alignments
- PMID: 24580807
- PMCID: PMC4053813
- DOI: 10.1186/gb-2014-15-3-r46
Item in Clipboard
Comparative Study
Kraken: ultrafast metagenomic sequence classification using exact alignments
Genome Biol.
.
Abstract
Kraken is an ultrafast and highly accurate program for assigning taxonomic labels to metagenomic DNA sequences. Previous programs designed for this task have been relatively slow and computationally expensive, forcing researchers to use faster abundance estimation programs, which only classify small subsets of metagenomic data. Using exact alignment of k-mers, Kraken achieves classification accuracy comparable to the fastest BLAST program. In its fastest mode, Kraken classifies 100 base pair reads at a rate of over 4.1 million reads per minute, 909 times faster than Megablast and 11 times faster than the abundance estimation program MetaPhlAn. Kraken is available at http://ccb.jhu.edu/software/kraken/.
Figures
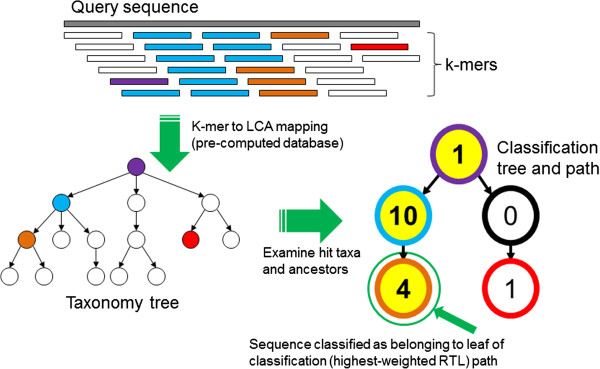
The Kraken sequence classification algorithm. To classify a sequence, each k-mer in the sequence is mapped to the lowest common ancestor (LCA) of the genomes that contain that k-mer in a database. The taxa associated with the sequence’s k-mers, as well as the taxa’s ancestors, form a pruned subtree of the general taxonomy tree, which is used for classification. In the classification tree, each node has a weight equal to the number of k-mers in the sequence associated with the node’s taxon. Each root-to-leaf (RTL) path in the classification tree is scored by adding all weights in the path, and the maximal RTL path in the classification tree is the classification path (nodes highlighted in yellow). The leaf of this classification path (the orange, leftmost leaf in the classification tree) is the classification used for the query sequence.
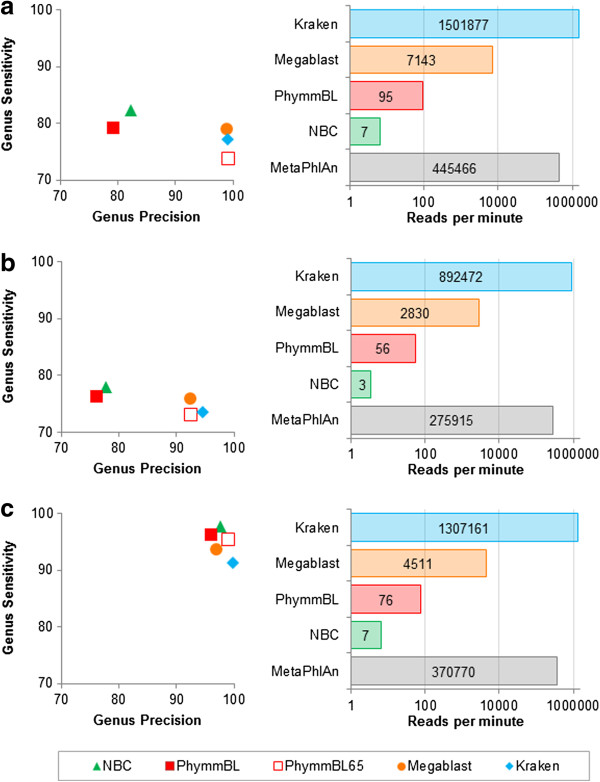
Classification accuracy and speed comparison of classification programs for three simulated metagenomes. For each metagenome, genus precision and sensitivity are shown for five classifiers, and speed is shown for five programs (PhymmBL65 is simply a confidence-filtered version of PhymmBL’s results, and MetaPhlAn only classifies a subset of reads that map to one of its marker genes, as it is an abundance estimation program). Results shown are for: (a) the HiSeq metagenome, consisting of HiSeq reads (mean length μ = 92 bp) in equal proportion from ten bacterial sequencing projects; (b) the MiSeq metagenome, consisting of MiSeq reads (μ = 156 bp) in equal proportion from ten bacterial projects; and (c) the simBA-5 metagenome, consisting of simulated 100-bp reads with a high error rate from 1,967 bacterial and archaeal taxa. Note that the horizontal axes in all speed graphs have a logarithmic scale.
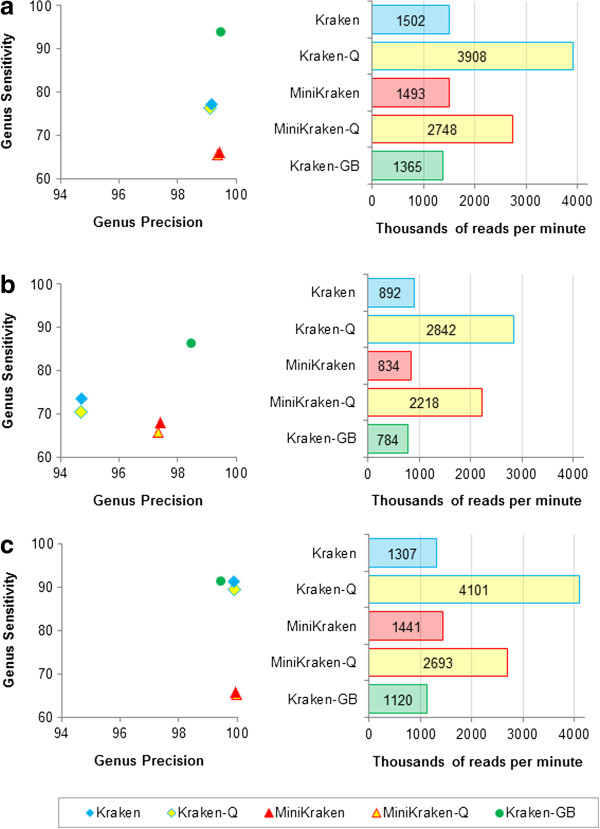
Classification accuracy and speed comparison of variants of Kraken for three simulated metagenomes. For each metagenome, genus precision and sensitivity are shown for five classifiers, and speed is shown for Kraken, along with a reduced memory version of Kraken (MiniKraken), quick execution versions of both (Kraken-Q and MiniKraken-Q), and Kraken run with a database containing draft and completed microbial genomes from GenBank (Kraken-GB). Results shown are for the same metagenomes used in Figure 2. Note that the scales of the axes differ from Figure 2, as the precision and speed of Kraken (and its variants) exceed that of the other classifiers used. (a) HiSeq metagenome. (b) MiSeq metagenome. (c) simBA-5 metagenome.
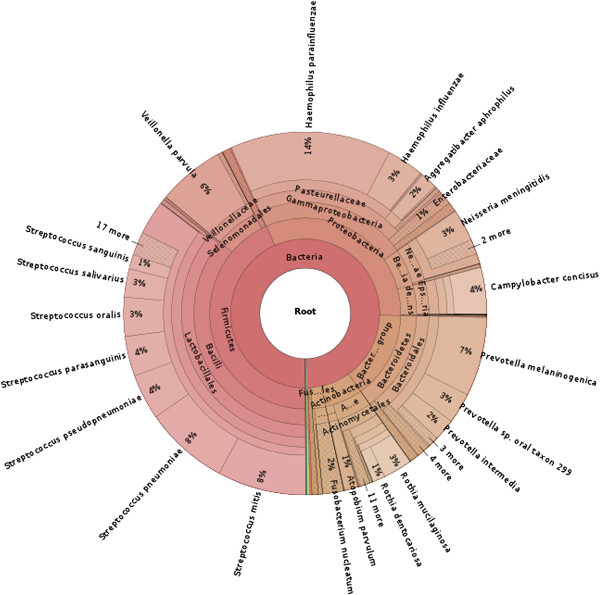
Taxonomic distribution of saliva microbiome reads classified by Kraken. Sequences from saliva samples collected from three individuals were classified by Kraken. The distribution of those reads that were classified by Kraken is shown.
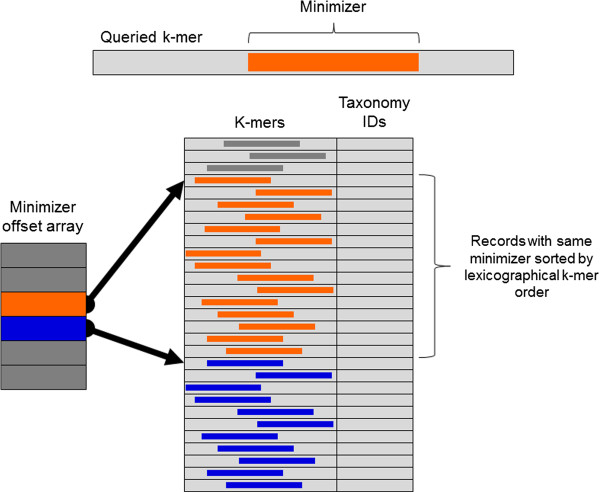
Kraken database structure. Each k-mer to be queried against the database has a specific substring that is its minimizer. To search for a k-mer in the database, the positions in the database that contain k-mers with the same minimizer are examined. These positions are quickly found by examining the minimizer offset array for the start positions of records with the k-mer’s minimizer (orange) and the next possible minimizer (blue). Within a range of records associated with a given minimizer, records are sorted by lexicographical ordering of their k-mers, allowing a query to be completed by using a binary search over this range.
References
-
- Venter C, Remington K, Heidelberg J, Halpern A, Rusch D, Eisen J, Wu D, Paulsen I, Nelson K, Nelson W, Fouts D, Levy S, Knap A, Lomas M, Nealson K, White O, Peterson J, Hoffman J, Parsons R, Baden-Tillson H, Pfannkoch C, Rogers Y-H, Smith H. Environmental genome shotgun sequencing of the Sargasso Sea. Science. 2004;304:66–74. doi: 10.1126/science.1093857. - DOI - PubMed
-
- Huttenhower C, Gevers D, Knight R, Abubucker S, Badger JH, Chinwalla AT, Creasy HH, Earl AM, FitzGerald MG, Fulton RS, Giglio MG, Hallsworth-Pepin K, Lobos EA, Madupu R, Magrini V, Martin JC, Mitreva M, Muzny DM, Sodergren EJ, Versalovic J, Wollam AM, Worley KC, Wortman JR, Young SK, Zeng Q, Aagaard KM, Abolude OO, Allen-Vercoe E, Alm EJ, Alvarado L. et al. Structure, function and diversity of the healthy human microbiome. Nature. 2012;486:207–214. doi: 10.1038/nature11234. - DOI - PMC - PubMed
-
- Altschul S, Gish W, Miller W, Myers E, Lipman D. Basic local alignment search tool. J Mol Biol. 1990;215:403–410. - PubMed
Publication types
MeSH terms
Grants and funding
LinkOut - more resources
Full Text Sources
Other Literature Sources
Medical
Molecular Biology Databases
Research Materials
