

Revealing spatio-spectral electroencephalographic dynamics of musical mode and tempo perception by independent component analysis
- PMID: 24581119
- PMCID: PMC3941612
- DOI: 10.1186/1743-0003-11-18
Revealing spatio-spectral electroencephalographic dynamics of musical mode and tempo perception by independent component analysis
Abstract
Background: Music conveys emotion by manipulating musical structures, particularly musical mode- and tempo-impact. The neural correlates of musical mode and tempo perception revealed by electroencephalography (EEG) have not been adequately addressed in the literature.
Method: This study used independent component analysis (ICA) to systematically assess spatio-spectral EEG dynamics associated with the changes of musical mode and tempo.
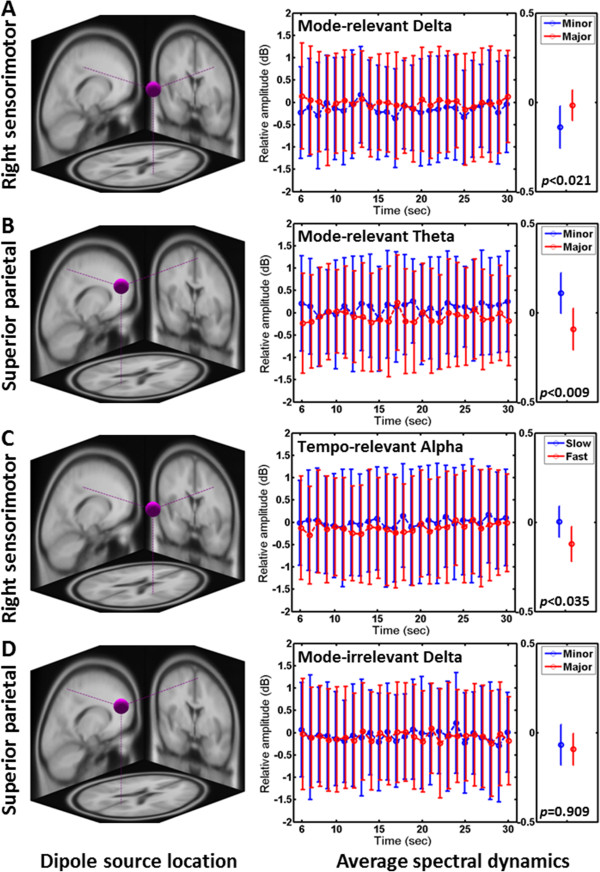
Results: Empirical results showed that music with major mode augmented delta-band activity over the right sensorimotor cortex, suppressed theta activity over the superior parietal cortex, and moderately suppressed beta activity over the medial frontal cortex, compared to minor-mode music, whereas fast-tempo music engaged significant alpha suppression over the right sensorimotor cortex.
Conclusion: The resultant EEG brain sources were comparable with previous studies obtained by other neuroimaging modalities, such as functional magnetic resonance imaging (fMRI) and positron emission tomography (PET). In conjunction with advanced dry and mobile EEG technology, the EEG results might facilitate the translation from laboratory-oriented research to real-life applications for music therapy, training and entertainment in naturalistic environments.
Figures


Similar articles
-
Electroencephalographic dynamics of musical emotion perception revealed by independent spectral components.Neuroreport. 2010 Apr 21;21(6):410-5. doi: 10.1097/WNR.0b013e32833774de. Neuroreport. 2010. PMID: 20300041
-
Exploring Frequency-Dependent Brain Networks from Ongoing EEG Using Spatial ICA During Music Listening.Brain Topogr. 2020 May;33(3):289-302. doi: 10.1007/s10548-020-00758-5. Epub 2020 Mar 2. Brain Topogr. 2020. PMID: 32124110 Free PMC article.
-
Capturing the musical brain with Lasso: Dynamic decoding of musical features from fMRI data.Neuroimage. 2014 Mar;88:170-80. doi: 10.1016/j.neuroimage.2013.11.017. Epub 2013 Nov 19. Neuroimage. 2014. PMID: 24269803
-
Exploring the functional neuroanatomy of music performance, perception, and comprehension.Ann N Y Acad Sci. 2001 Jun;930:211-31. doi: 10.1111/j.1749-6632.2001.tb05735.x. Ann N Y Acad Sci. 2001. PMID: 11458831 Review.
-
Neural basis of music perception.Handb Clin Neurol. 2015;129:187-205. doi: 10.1016/B978-0-444-62630-1.00011-1. Handb Clin Neurol. 2015. PMID: 25726270 Review.
Cited by
-
Fractality of sensations and the brain health: the theory linking neurodegenerative disorder with distortion of spatial and temporal scale-invariance and fractal complexity of the visible world.Front Aging Neurosci. 2015 Jul 15;7:135. doi: 10.3389/fnagi.2015.00135. eCollection 2015. Front Aging Neurosci. 2015. PMID: 26236232 Free PMC article.
-
Spatial Connectivity and Temporal Dynamic Functional Network Connectivity of Musical Emotions Evoked by Dynamically Changing Tempo.Front Neurosci. 2021 Aug 5;15:700154. doi: 10.3389/fnins.2021.700154. eCollection 2021. Front Neurosci. 2021. PMID: 34421523 Free PMC article.
-
Independent component processes underlying emotions during natural music listening.Soc Cogn Affect Neurosci. 2016 Sep;11(9):1428-39. doi: 10.1093/scan/nsw048. Epub 2016 Apr 11. Soc Cogn Affect Neurosci. 2016. PMID: 27217116 Free PMC article.
-
Challenge for Affective Brain-Computer Interfaces: Non-stationary Spatio-spectral EEG Oscillations of Emotional Responses.Front Hum Neurosci. 2019 Oct 30;13:366. doi: 10.3389/fnhum.2019.00366. eCollection 2019. Front Hum Neurosci. 2019. PMID: 31736727 Free PMC article.
-
Alteration of perceived emotion and brain functional connectivity by changing the musical rhythmic pattern.Exp Brain Res. 2019 Oct;237(10):2607-2619. doi: 10.1007/s00221-019-05616-w. Epub 2019 Aug 1. Exp Brain Res. 2019. PMID: 31372689
References
-
- Gomez P, Danuser B. Relationships between musical structure and psychophysiological measures of emotion. Emotion. 2007;7:377–387. - PubMed
Publication types
MeSH terms
LinkOut - more resources
Full Text Sources
Other Literature Sources
Miscellaneous
