

Altered miRNA expression in canine retinas during normal development and in models of retinal degeneration
- PMID: 24581223
- PMCID: PMC4029133
- DOI: 10.1186/1471-2164-15-172
Altered miRNA expression in canine retinas during normal development and in models of retinal degeneration
Abstract
Background: Although more than 246 loci/genes are associated with inherited retinal diseases, the mechanistic events that link genetic mutations to photoreceptor cell death are poorly understood. miRNAs play a relevant role during retinal development and disease. Thus, as a first step in characterizing miRNA involvement during disease expression and progression, we examined miRNAs expression changes in normal retinal development and in four canine models of retinal degenerative disease.
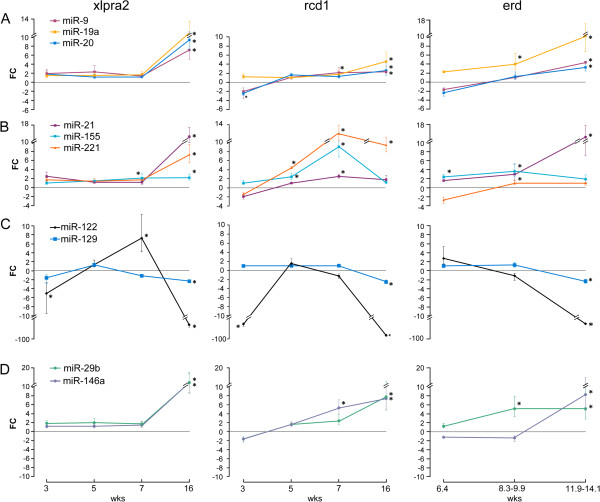
Results: The initial microarray analysis showed that 50 miRNAs were differentially expressed (DE) early (3 vs. 7 wks) in normal retina development, while only 2 were DE between 7 and 16 wks, when the dog retina is fully mature. miRNA expression profiles were similar between dogs affected with xlpra2, an early-onset retinal disease caused by a microdeletion in RPGRORF15, and normal dogs early in development (3 wks) and at the peak of photoreceptor death (7 wks), when only 2 miRNAs were DE. However, the expression varied much more markedly during the chronic cell death stage at 16 wks (118 up-/55 down-regulated miRNAs). Functional analyses indicated that these DE miRNAs are associated with an increased inflammatory response, as well as cell death/survival. qRT-PCR of selected apoptosis-related miRNAs ("apoptomirs") confirmed the microarray results in xlpra2, and extended the analysis to the early-onset retinal diseases rcd1 (PDE6B-mutation) and erd (STK38L-mutation), as well as the slowly progressing prcd (PRCD-mutation). The results showed up-regulation of anti-apoptotic (miR-9, -19a, -20, -21, -29b, -146a, -155, -221) and down-regulation of pro-apoptotic (miR-122, -129) apoptomirs in the early-onset diseases and, with few exceptions, also in the prcd-mutants.
Conclusions: Our results suggest that apoptomirs might be expressed by diseased retinas in an attempt to counteract the degenerative process. The pattern of expression in diseased retinas mirrored the morphology and cell death kinetics previously described for these diseases. This study suggests that common miRNA regulatory mechanisms may be involved in retinal degeneration processes and provides attractive opportunities for the development of novel miRNA-based therapies to delay the progression of the degenerative process.
Figures


Similar articles
-
Up-regulation of tumor necrosis factor superfamily genes in early phases of photoreceptor degeneration.PLoS One. 2013 Dec 19;8(12):e85408. doi: 10.1371/journal.pone.0085408. eCollection 2013. PLoS One. 2013. PMID: 24367709 Free PMC article.
-
FAM161A and TTC8 are Differentially Expressed in Non-Allelelic Early Onset Retinal Degeneration.Adv Exp Med Biol. 2016;854:201-7. doi: 10.1007/978-3-319-17121-0_27. Adv Exp Med Biol. 2016. PMID: 26427412 Free PMC article.
-
Nonallelism of erd and prcd and exclusion of the canine RDS/peripherin gene as a candidate for both retinal degeneration loci.Invest Ophthalmol Vis Sci. 1996 Apr;37(5):783-94. Invest Ophthalmol Vis Sci. 1996. PMID: 8603863
-
The impact of microRNA gene regulation on the survival and function of mature cell types in the eye.FASEB J. 2016 Jan;30(1):23-33. doi: 10.1096/fj.15-279745. Epub 2015 Sep 23. FASEB J. 2016. PMID: 26399786 Free PMC article. Review.
-
Retinal miRNA Functions in Health and Disease.Genes (Basel). 2019 May 17;10(5):377. doi: 10.3390/genes10050377. Genes (Basel). 2019. PMID: 31108959 Free PMC article. Review.
Cited by
-
The genetics of inherited retinal disorders in dogs: implications for diagnosis and management.Vet Med (Auckl). 2016 Mar 15;7:41-51. doi: 10.2147/VMRR.S63537. eCollection 2016. Vet Med (Auckl). 2016. PMID: 30050836 Free PMC article. Review.
-
Sophisticated Gene Regulation for a Complex Physiological System: The Role of Non-coding RNAs in Photoreceptor Cells.Front Cell Dev Biol. 2021 Jan 18;8:629158. doi: 10.3389/fcell.2020.629158. eCollection 2020. Front Cell Dev Biol. 2021. PMID: 33537317 Free PMC article. Review.
-
Optical coherence tomography and molecular analysis of sudden acquired retinal degeneration syndrome (SARDS) eyes suggests the immune-mediated nature of retinal damage.Vet Ophthalmol. 2019 May;22(3):305-327. doi: 10.1111/vop.12597. Epub 2018 Aug 15. Vet Ophthalmol. 2019. PMID: 30109754 Free PMC article.
-
Photoreceptor proliferation and dysregulation of cell cycle genes in early onset inherited retinal degenerations.BMC Genomics. 2016 Mar 11;17:221. doi: 10.1186/s12864-016-2477-9. BMC Genomics. 2016. PMID: 26969498 Free PMC article.
-
Multimodal Regulation Orchestrates Normal and Complex Disease States in the Retina.Sci Rep. 2017 Apr 6;7(1):690. doi: 10.1038/s41598-017-00788-3. Sci Rep. 2017. PMID: 28386079 Free PMC article.
References
-
- Retinal Information Network (RetNet) [http://www.sph.uth.tmc.edu/RetNet/]
Publication types
MeSH terms
Substances
Associated data
- Actions
Grants and funding
LinkOut - more resources
Full Text Sources
Other Literature Sources
Molecular Biology Databases
