

Angiotensin converting enzyme 2/Ang-(1-7)/mas axis protects brain from ischemic injury with a tendency of age-dependence
- PMID: 24581232
- PMCID: PMC4840841
- DOI: 10.1111/cns.12233
Angiotensin converting enzyme 2/Ang-(1-7)/mas axis protects brain from ischemic injury with a tendency of age-dependence
Abstract
Background: The angiotensin (Ang) converting enzyme 2 (ACE2)/Ang-(1-7)/Mas receptor pathway is an important component of the renin-angiotensin system and has been suggested to exert beneficial effects in ischemic stroke.
Aims: This study explored whether the ACE2/Ang-(1-7)/Mas pathway has a protective effect on cerebral ischemic injury and whether this effect is affected by age.
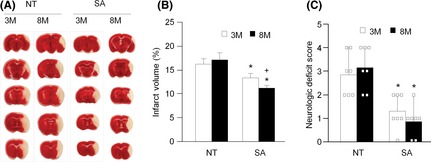
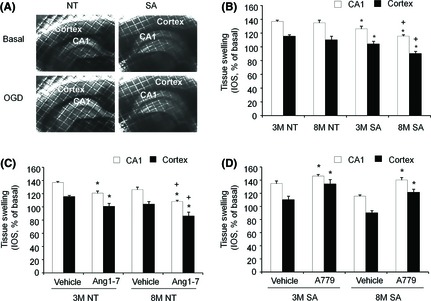
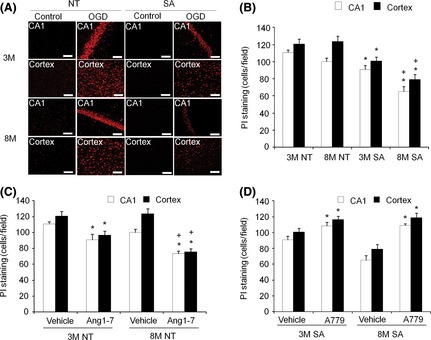
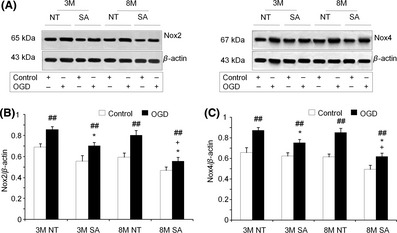
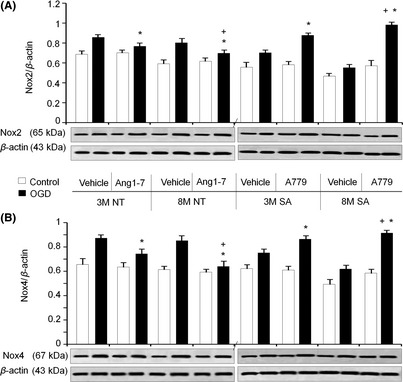
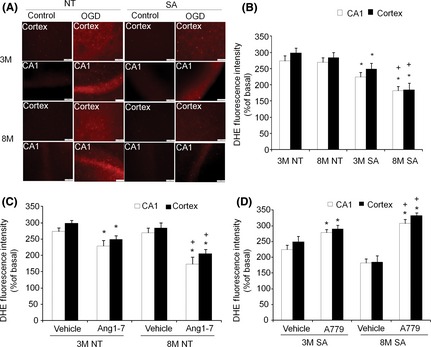
Methods: We used three-month and eight-month transgenic mice with neural over-expression of ACE2 (SA) and their age-matched nontransgenic (NT) controls. Neurological deficits and ischemic stroke volume were determined following middle cerebral artery occlusion (MCAO). In oxygen and glucose deprivation (OGD) experiments on brain slices, the effects of the Mas receptor agonist (Ang1-7) or antagonist (A779) on tissue swelling, Nox2/Nox4 expression reactive oxygen species (ROS) production and cell death were measured.
Results: (1) Middle cerebral artery occlusion -induced ischemic injury and neurological deficit were reduced in SA mice, especially in eight-month animals; (2) OGD-induced tissue swelling and cell death were decreased in SA mice with a greater reduction seen in eight-month mice; (3) Ang-(1-7) and A779 had opposite effects on OGD-induced responses, which correlated with changes in Nox2/Nox4 expression and ROS production.
Conclusions: Angiotensin converting enzyme 2/Ang-(1-7)/Mas axis protects brain from ischemic injury via the Nox/ROS signaling pathway, with a greater effect in older animals.
Keywords: Aging; Angiotensin; Angiotensin-converting enzyme 2; Ischemic stroke; NADPH oxidase.
© 2014 John Wiley & Sons Ltd.
Conflict of interest statement
No conflict of interests, financial, or otherwise, are declared by the authors.
Figures
Similar articles
-
Activation of the ACE2/Ang-(1-7)/Mas pathway reduces oxygen-glucose deprivation-induced tissue swelling, ROS production, and cell death in mouse brain with angiotensin II overproduction.Neuroscience. 2014 Jul 25;273:39-51. doi: 10.1016/j.neuroscience.2014.04.060. Epub 2014 May 9. Neuroscience. 2014. PMID: 24814023 Free PMC article.
-
Neuronal over-expression of ACE2 protects brain from ischemia-induced damage.Neuropharmacology. 2014 Apr;79:550-8. doi: 10.1016/j.neuropharm.2014.01.004. Epub 2014 Jan 15. Neuropharmacology. 2014. PMID: 24440367 Free PMC article.
-
The expression of angiotensin-converting enzyme 2-angiotensin-(1-7)-Mas receptor axis are upregulated after acute cerebral ischemic stroke in rats.Neuropeptides. 2013 Oct;47(5):289-95. doi: 10.1016/j.npep.2013.09.002. Epub 2013 Sep 18. Neuropeptides. 2013. PMID: 24090950
-
Counter-regulatory effects played by the ACE - Ang II - AT1 and ACE2 - Ang-(1-7) - Mas axes on the reactive oxygen species-mediated control of vascular function: perspectives to pharmacological approaches in controlling vascular complications.Vasa. 2014 Nov;43(6):404-14. doi: 10.1024/0301-1526/a000387. Vasa. 2014. PMID: 25339158 Review.
-
Role of renin-angiotensin system in liver diseases: an outline on the potential therapeutic points of intervention.Expert Rev Gastroenterol Hepatol. 2016 Nov;10(11):1279-1288. doi: 10.1080/17474124.2016.1207523. Epub 2016 Jul 14. Expert Rev Gastroenterol Hepatol. 2016. PMID: 27352778 Review.
Cited by
-
Angiotensin-(1-7) improves cognitive function and reduces inflammation in mice following mild traumatic brain injury.Front Behav Neurosci. 2022 Aug 4;16:903980. doi: 10.3389/fnbeh.2022.903980. eCollection 2022. Front Behav Neurosci. 2022. PMID: 35990729 Free PMC article.
-
The ACE2/Angiotensin-(1-7)/MAS Axis of the Renin-Angiotensin System: Focus on Angiotensin-(1-7).Physiol Rev. 2018 Jan 1;98(1):505-553. doi: 10.1152/physrev.00023.2016. Physiol Rev. 2018. PMID: 29351514 Free PMC article. Review.
-
Activation of the Neuroprotective Angiotensin-Converting Enzyme 2 in Rat Ischemic Stroke.Hypertension. 2015 Jul;66(1):141-8. doi: 10.1161/HYPERTENSIONAHA.115.05185. Epub 2015 May 4. Hypertension. 2015. PMID: 25941346 Free PMC article.
-
How Does SARS-CoV-2 Affect the Central Nervous System? A Working Hypothesis.Front Psychiatry. 2020 Nov 16;11:582345. doi: 10.3389/fpsyt.2020.582345. eCollection 2020. Front Psychiatry. 2020. PMID: 33304284 Free PMC article.
-
Brain Imaging Changes in Patients Recovered From COVID-19: A Narrative Review.Front Neurosci. 2022 Apr 22;16:855868. doi: 10.3389/fnins.2022.855868. eCollection 2022. Front Neurosci. 2022. PMID: 35527821 Free PMC article.
References
-
- Mayhan WG, Arrick DM, Sharpe GM, Sun H. Age‐related alterations in reactivity of cerebral arterioles: role of oxidative stress. Microcirculation 2008;15:225–236. - PubMed
-
- Park L, Anrather J, Girouard H, Zhou P, Iadecola C. Nox2‐derived reactive oxygen species mediate neurovascular dysregulation in the aging mouse brain. J Cereb Blood Flow Metab 2007;27:1908–1918. - PubMed
Publication types
MeSH terms
Substances
Grants and funding
LinkOut - more resources
Full Text Sources
Other Literature Sources
Molecular Biology Databases
Research Materials
Miscellaneous
