

Analysis of the causes of spawning of large-scale, severe malarial epidemics and their rapid total extinction in western Provence, historically a highly endemic region of France (1745-1850)
- PMID: 24581282
- PMCID: PMC3939818
- DOI: 10.1186/1475-2875-13-72
Analysis of the causes of spawning of large-scale, severe malarial epidemics and their rapid total extinction in western Provence, historically a highly endemic region of France (1745-1850)
Abstract
Background: The two main puzzles of this study are the onset and then sudden stopping of severe epidemics in western Provence (a highly malaria-endemic region of Mediterranean France) without any deliberate counter-measures and in the absence of significant population flux.
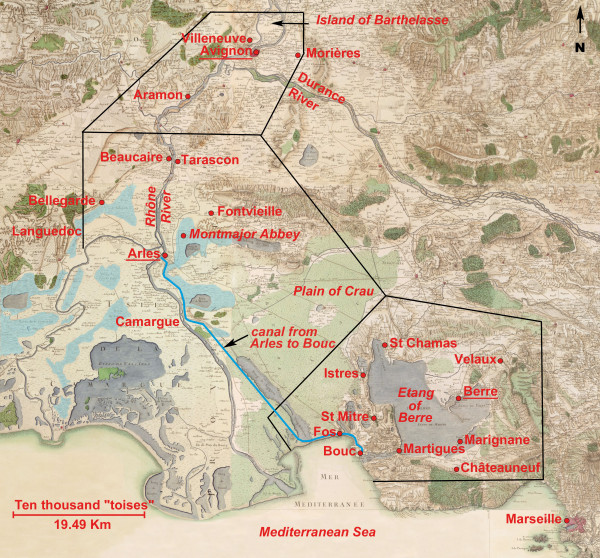
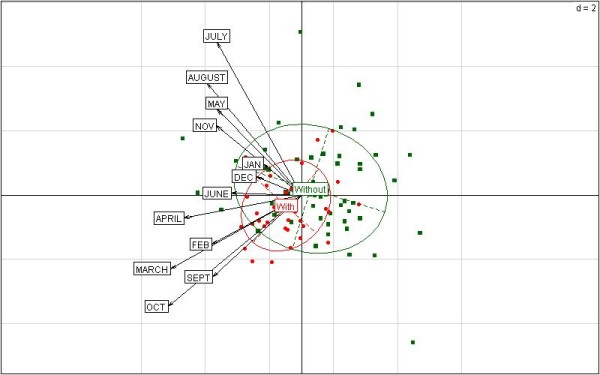
Methods: Malaria epidemics during the period from 1745 to 1850 were analysed against temperature and rainfall records and several other potentially relevant factors.
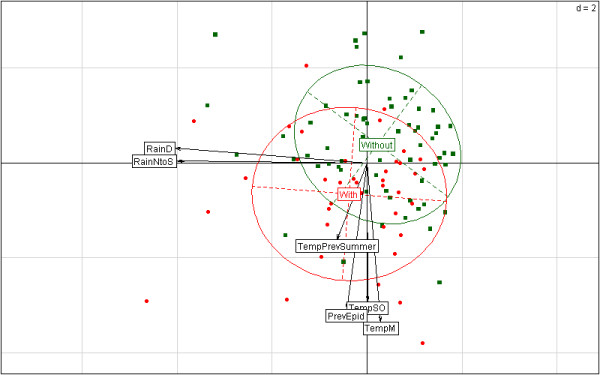
Results: Statistical analyses indicated that relatively high temperatures in early spring and in September/October, rainfall during the previous winter (principally December) and even from November to September and epidemics during the previous year could have played a decisive role in the emergence of these epidemics. Moreover, the epidemics were most likely not driven by other parameters (e.g., social, cultural, agricultural and geographical). Until 1776, very severe malarial epidemics affected large areas, whereas after this date, they were rarer and generally milder for local people and were due to canal digging activities. In the latter period, decreased rainfall in December, and more extreme and variable temperatures were observed. It is known that rainfall anomalies and temperature fluctuations may be detrimental to vector and parasite development.
Conclusion: This study showed the particular characteristics of malaria in historical Provence. Contrary to the situation in most other Mediterranean areas, Plasmodium falciparum was most likely not involved (during the years with epidemics, the mean temperature during the months of July and August, among other factors, did not play a role) and the population had no protective mutation. The main parasite species was Plasmodium vivax, which was responsible for very severe diseases, but contrary to in northern Europe, it is likely that transmission occurred only during the period where outdoor sporogony was possible, and P. vivax sporogony was always feasible, even during colder summers. Possible key elements in the understanding of the course of malaria epidemics include changes in the virulence of P. vivax strains, the refractoriness of anophelines and/or the degree or efficiency of acquired immunity. This study could open new lines of investigation into the comprehension of the conditions of disappearance/emergence of severe malaria epidemics in highly endemic areas.
Figures


Similar articles
-
Endemic malaria: an 'indoor' disease in northern Europe. Historical data analysed.Malar J. 2005 Apr 25;4:19. doi: 10.1186/1475-2875-4-19. Malar J. 2005. PMID: 15847704 Free PMC article.
-
Temperate climate malaria in nineteenth century Denmark.BMC Infect Dis. 2022 May 4;22(1):432. doi: 10.1186/s12879-022-07422-2. BMC Infect Dis. 2022. PMID: 35509020 Free PMC article.
-
Five years following first detection of Anopheles stephensi (Diptera: Culicidae) in Djibouti, Horn of Africa: populations established-malaria emerging.Parasitol Res. 2019 Mar;118(3):725-732. doi: 10.1007/s00436-019-06213-0. Epub 2019 Jan 22. Parasitol Res. 2019. PMID: 30671729
-
Hypothesis: dynamics of classical malaria epidemics show Plasmodium falciparum's survival strategy.Am J Trop Med Hyg. 2015 Mar;92(3):561-4. doi: 10.4269/ajtmh.14-0541. Epub 2015 Jan 26. Am J Trop Med Hyg. 2015. PMID: 25624407 Free PMC article. Review.
-
[Malaria in the Mediterranean world. The historical and present-day distribution].Bull Soc Pathol Exot Filiales. 1988;81(5):854-60. Bull Soc Pathol Exot Filiales. 1988. PMID: 3071432 Review. French.
Cited by
-
Pernicious Plasmodium vivax as a Historical Cause of Malarial Cachexia?Am J Trop Med Hyg. 2023 Apr 17;108(6):1093-1095. doi: 10.4269/ajtmh.22-0761. Print 2023 Jun 7. Am J Trop Med Hyg. 2023. PMID: 37068752 Free PMC article.
-
Malarial pathocoenosis: beneficial and deleterious interactions between malaria and other human diseases.Front Physiol. 2014 Nov 21;5:441. doi: 10.3389/fphys.2014.00441. eCollection 2014. Front Physiol. 2014. PMID: 25484866 Free PMC article. Review.
References
-
- Montfalcon J-B. Histoire médicale des Marais et traité des fièvres intermittentes causées par les émanations des eaux stagnantes. 2. Paris: Béchet; 1826.
-
- Lavéran A. Traité du Paludisme. 2. Paris: Masson; 1907.
-
- Bruce-Chwatt LJ, De Zulueta J. The rise and fall of malaria in Europe. A historico-epidemiological study. Oxford: Oxford University Press; 1980.
-
- Crosnier R, Merle F, Tabusse L. Paludisme autochtone. Bull Soc Pathol Exot. 1948;41:681–690.
-
- Leproux P. Le paludisme autochtone en Charente-Maritime. University of Bordeaux, Faculty of Medicine and Pharmacy; 1952. (MD thesis). - PubMed
Publication types
MeSH terms
LinkOut - more resources
Full Text Sources
Other Literature Sources
Medical
