. 2014 Feb 27;156(5):1002-16.
doi: 10.1016/j.cell.2014.01.040.

Serpins promote cancer cell survival and vascular co-option in brain metastasis

Affiliations

Serpins promote cancer cell survival and vascular co-option in brain metastasis

Manuel Valiente et al. Cell. .

Abstract

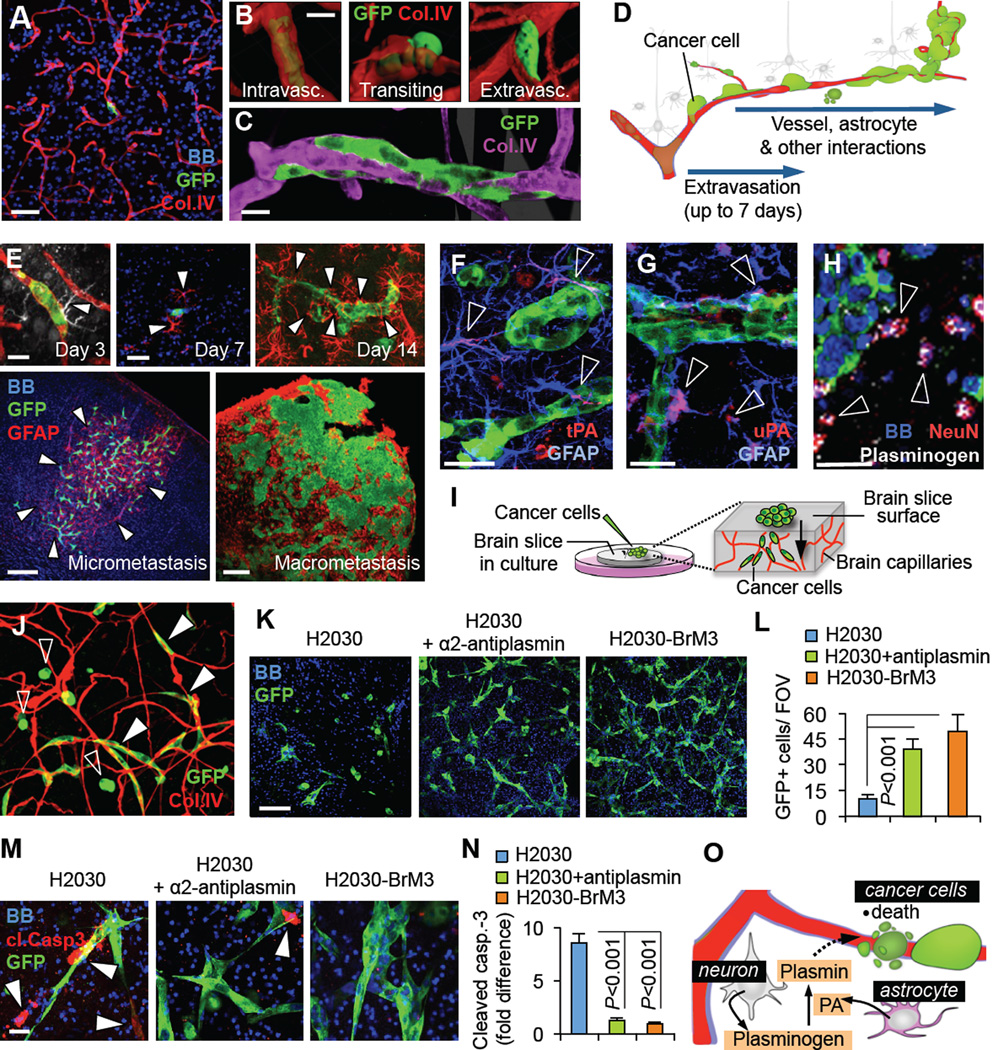
Brain metastasis is an ominous complication of cancer, yet most cancer cells that infiltrate the brain die of unknown causes. Here, we identify plasmin from the reactive brain stroma as a defense against metastatic invasion, and plasminogen activator (PA) inhibitory serpins in cancer cells as a shield against this defense. Plasmin suppresses brain metastasis in two ways: by converting membrane-bound astrocytic FasL into a paracrine death signal for cancer cells, and by inactivating the axon pathfinding molecule L1CAM, which metastatic cells express for spreading along brain capillaries and for metastatic outgrowth. Brain metastatic cells from lung cancer and breast cancer express high levels of anti-PA serpins, including neuroserpin and serpin B2, to prevent plasmin generation and its metastasis-suppressive effects. By protecting cancer cells from death signals and fostering vascular co-option, anti-PA serpins provide a unifying mechanism for the initiation of brain metastasis in lung and breast cancers.


Figures

Figure 1
Figure 1. Association of PA-inhibitory serpins with the brain metastatic phenotype
(A) Serpin mRNA levels in brain metastatic cell lines relative to the levels in counterparts not metastatic to brain. TN, triple negative; ER−, estrogen receptor negative, PR−, progesterone receptor negative. (B) mRNA levels of the indicated serpins in the parental MDA231 cell line and derivatives with different metastatic tropisms. Error bars, 95% confidence interval. (C) Representative ex vivo bioluminescence (BLI) images of brains from syngeneic mice inoculated with KrasG12D;p53−/− mouse lung cancer cell lines. The percentage of mice developing brain metastasis and the mean BLI photon flux signal are indicated. n=10 (D) Heatmap of serpin mRNA expression in KrasG12D;p53−/− derivatives. (E) Summary of the serpin-PA-plasmin cascade. (F) Inhibition of plasminogen conversion into plasmin by cell culture supernatants of the indicated cell lines. Plasmin activity was determined by a chromogenic assay. Data are averages ± SEM from triplicate experiments. (G) Kaplan-Meier analysis of brain metastasis-free survival in 106 cases of lung adenocarcinoma classified based on SERPINB2 and SERPINI1 mRNA levels in the primary tumor. P value calculated from a Cox proportional hazard model, with SERPINB2 and SERPINI1 expression treated as a continuous variable. (H) Representative human brain metastasis samples from lung and breast cancer stained with antibodies against NS or serpin B2. (I) Proportion of metastasis samples scoring positive for NS immunostaining (red) or serpin B2 immunostaining (orange) in 33 cases of non-small cell lung carcinoma and 123 cases of breast carcinoma. Small diagrams in the breast cancer set represent the primary tumor subtype (HER2, HER2+; ER/PR, hormone-receptor positive; TP, triple positive) of the serpin-positive samples for which this information was available. Brain metastases scoring positive for both serpins comprise 42% and 34% of the lung cancer and breast cancer cases, respectively. Samples scored as positive had >80% of neoplastic cells showing positive reactivity. Scale bar: 100µm. See also Figure S1.
Figure 2
Figure 2. Vascular cooption, outgrowth, and escape from stromal plasmin action
(A) Metastatic cell interactions with brain capillaries. MDA231-BrM2 cells (green) remain bound to brain capillaries (red) after completing extravasation. (B) Confocal analysis of the extravasation steps showing a GFP+ MDA231-BrM2 cell. (C) Cluster of extravasated MDA231-BrM2 cells forming a furrow around a brain capillary. All extravasated cells initially grew in this manner. Blue, nuclear staining. (D) Schema representing the initial steps and interactions during metastatic colonization of the brain. (E) Exposure of metastatic H2030-BrM3 cells to GFAP+ reactive astrocytes (arrowheads) in the brain parenchyma at different time points after inoculation of cancer cells into the circulation. Day 3: red, collagen IV; white, GFAP; green, GFP+ cancer cells. Blue, nuclear staining. (F,G) tPA and uPA immunofluorescence staining (arrowheads) associated with GFAP+ astrocytes in a mouse brain harboring GFP+ H2030-BrM3 cells (green). (H) Plasminogen immunofluorescence staining (white, arrowheads) is associated with NeuN+ neuron bodies (red) near a cluster of GFP+ metastatic cells (green) in a mouse brain. Blue, nuclei. (I) Schema of brain slice organotypic cultures. Cancer cells placed on the surface of slices migrate into the tissue and seek microcapillaries. (J) Representative image of a brain slice harboring infiltrated H2030-BrM3 cells that are still round (open arrowheads) or already spread over brain capillaries (closed arrowheads). (K) Representative confocal images of brain slice tissue infiltrated with the indicated cancer cells. α2-antiplasmin was added to the indicated cultures. Note the lower density and disorganized aspect of parental cells compared with the stretched morphology of BrM3 cells or parental cells with α2-antiplasmin. (L) Quantification of GFP+ cancer cells in the experiments of panel K. Number of cells per field of view (FOV) are averages ± SEM. n=6–10 brain slices, scoring at least two fields per slice, in at least 2 independent experiments. (M) Cleaved caspase-3 immunofluorescence staining in brain slices harboring the indicated cells and additions. (N) Quantification of cleaved caspase-3 positive cancer cells in the experiments of panel M. Values are quantified as panel L, normalized to H2030-BrM3, and are averages ± SEM. (O) Schematic summary showing neurons and astrocytes as sources of plasminogen and PA, respectively, and lethal effect of the resulting plasmin on infiltrating cancer cells. All P values by Student’s t-test. Scale bars: 25µm (A), 5µm (B–C), 5µm (Day 3), 15µm (Day 7), 25µm (Day 14), 70µm (micrometastasis), 100µm (macrometastasis) (D), 10µm (F–H), 100µm (K), 5µm (M) See also Figure S2.
Figure 3
Figure 3. Neuroserpin mediates brain metastasis
(A) Schema of experimental design. (B) Representative images of whole-body BLI and brain ex vivo BLI 5 weeks after inoculation of H2030-BrM3 cells transduced with control shRNA or NS shRNA (shNS). (C) Kaplan–Meier plot of brain metastasis-free survival in the experiment of panel B. Control (n=20) and two different shNS [shNS (1), n=11; shNS (2), n=13] were analyzed. P values were obtained with log rank Mantel-Cox test. (D) Quantification of ex vivo BLI in brains from panel B. (E) Representative images of coronal brain sections analyzed for GFP IF 21 or 35 days after inoculation of H2030- BrM3 cells into mice. Lesion contours are marked. (F) Quantification of brain lesions according to size at 21 day time point in panel E. Control n=5, shNS n=6 brains. P value refers to size distribution. For the total number of lesions, p<0.05. (G) Quantification of brain tumor burden in the experiment of panel E. Control n=5, shNS n=6. (H) Representative images of control and NS-depleted H2030-BrM3 cells in brain slice assays. Insets show cleaved caspase-3 IF. (I,J) Quantification of GFP+ cells (I) and cleaved caspase-3 (J) in the experiment of panel H. Data are averages ± SEM. n=6–10 slices, scoring at least two fields per slice, in at least 2 independent experiments. (K,L) Quantification of cells that were positive for cleaved caspase-3 comparing parental and BrM cell lines, and the effect of overexpressing NS wild type (NSWT) or a mutant form unable to target PA (NSΔloop) in parental cell lines H2030 (K) and MDA231 (L). Data are averages ± SEM, quantified as panel J. (M) Representative ex vivo BLI images of brains and hindlimbs from mice 21 days after inoculation with PC9-BrM3. Cells were transduced with empty vector (n=5) or NSWT (n=7) or NSΔloop mutant (n=8). (N) Ratio of photon flux in brain versus bone in the experiment of panel M. Ex vivo brain mean BLI values are also shown. All P values were calculated by Student’s t-test, except in panel C. Scale bar: 250µm (E), 100µm, 5µm (inset) (H). See also Figure S3.
Figure 4
Figure 4. Anti-PA serpins mediate brain metastasis by breast cancer cells
(A,B) MDA231-BrM2 cells transduced with control vector, shRNA vectors targeting NS, SERPINB2 and SERPIND1 (triple K/D), SERPINB2 shRNA (shSB2), or shSB2 plus a NS expressing vector were inoculated into the arterial circulation of immunodeficient mice. Brain metastasis burden was visualized by ex vivo brain BLI (A) and quantitated (B). Control n=22; triple K/D n=9, shSB2 n=14; shSB2 and NS n=8. (C) Distribution of clones (single cell progenies –SCP−) overexpressing one, two, or three of the indicated serpins among ten clonal cell lines isolated from the MDA231-BrM2 population. (D) Ex vivo brain BLI quantification from different MDA231-BrM2 SCP injected. Red dots SCP (high levels of all serpins), n=8; light green dots SCP (low levels of serpin B2), n=11; blue dots SCP (low levels of serpin B2 and D1), n=8; dark green dots SCP (low levels of serpin B2 and NS), n=5. P value was determined by Student’s t-test. (E) SCP with high levels of NS and serpin D1 were subjected to NS knockdown and tested for brain metastatic activity. (F) Kaplan–Meier survival curves for brain metastasis-free survival in syngeneic mice inoculated with parental ErbB2-P cells (n=9) or brain metastatic derivatives ErbB2-BrM1 (n=7) and ErbB2-BrM2 (n=5). Survival curves were compared using log rank Mantel-Cox test. ErbB2-P versus ErbB2-BrM1, P=0.0045, and versus ErbB2-BrM2 P=0.0053. (G,H) Representative images (G) and quantification (H) of brain metastasis BLI photon flux formed by ErbB2-BrM2 or these cells expressing two different serpin B2 shRNAs (shSB2). Control, n=10; shSB2 (1), n=10; shSB2 (2), n=6. Data are averages ± SEM. All P values were determined by Student’s t-test, except in panel G. See also Figure S4.
Figure 5
Figure 5. Neuroserpin shields cancer cells from FasL death signals
(A) Schema of FasL and its conversion by plasmin into sFasL, a diffusible trigger of apoptosis through Fas-FADD signaling. TMD, transmembrane domain; SA, trimeric self-assembly domain; THD, tumor necrosis factor-homology domain. Red crosses, apoptotic cells. a, astrocyte. c, cancer cell. (B) IF with antibodies against GFP (cancer cells), GFAP (reactive astrocytes) and FasL in a mouse brain harboring metastatic cells 21 days after arterial inoculation of H2030-BrM3. (C) Images of astrocyte cultures incubated with exogenous plasminogen (1µM) or no additions. Staining was performed with antibodies against the extracellular domain (ECD) or the intracellular domain of FasL (ICD). (D) Western immunoblotting of supernatants from cultures shown in panel C, using anti-FasL ECD antibodies. (E) Mouse brain slices were incubated with α2-antiplasmin, NS and serpin B2, or no additions. sFasL in tissue lysates was detected by western immunoblotting with anti-FasL ECD. Quantification of band density relative to tubulin (left to right) yielded sFasL:FasL ratios of 1, 0.51, 0.28. (F) GFP+ H2030-BrM3 cells (green) were allowed to infiltrate brain slices in media containing added sFasL or no additions and scored for cleaved caspase-3 (red, in inset). (G, H) Quantification of total GFP+ cells (G), and apoptotic GFP+ cells (H) in the experiments of panels F (orange bars) and I (green bars). Data are averages ± SEM. n=6–10 slices, scoring at least two fields per slice, from at least 2 independent experiments. (I) GFP+ H2030 cells (green) were allowed to infiltrate brain slices in media containing anti-FasL blocking antibody or no additions. Anti-FasL prevented endogenous signals from triggering caspase-3 activation (red, in inset). (J) Depiction of FADD-DD overexpression (yellow shape) to suppress pro-apoptotic Fas signaling in cancer cells. (K) FADD expression in H2030-BrM3 transduced with a FADD-DD vector. (L) Quantification of apoptotic cells following sFasL addition to H2030-BrM3 cells transduced with the indicated vectors. (M, N) Quantification of total GFP+ cells (M), and apoptotic GFP+ cells (N) in brain slices harboring the indicated GFP+ H2030-BrM3 transfectants and/or additions. Data are averages ± SEM, and quantitated as panels G,H. (O) Brain metastatic activity of H2030-BrM3 cells transduced with the indicated vectors and inoculated into the arterial circulation of mice. BLI photon flux was quantitated in cells transduced with control shRNA (n=11), FADD-DD (n=4), NS shRNA (n=14), or this shRNA and FADD-DD (n=12). All P values were determined by Student’s t-test. Scale bars: 25µm (B), 200µm (C), 100µm (F,I), 5µm (insets in F,I). See also Figure S5.
Figure 6
Figure 6. The plasmin target L1CAM mediates vascular cooption by brain metastatic cells
(A) Schema of L1CAM as a mediator of homophilic and heterophilic (e.g., integrins) cell adhesive interactions, and its conversion by plasmin into an adhesion defective fragment. Immunoglobulin-like (Ig) and fibronectin type III (FNIII) domain repeats, the intracellular domain (ICD), and an integrin-binding RGD sequence are indicated. (B) Suspensions of GFP+ H2030-BrM3 cells were placed on top of a monolayer of human brain microvascular endothelial cells (HBMEC) (C, D) Analysis of H2030-BrM3 binding to HBMEC monolayers (C) or to H2030-BrM3 monolayers (D), and effect of L1CAM knockdown. Data are averages ± SEM. n=5, scoring at least 10 fields per coverslip. (E) Flow cytometry of cell-surface L1CAM in the indicated brain cells expressing L1CAM shRNA or incubated with plasmin, compared to untreated controls. (F) Anti-L1CAM western immunoblotting of cells and culture supernatants after incubation with or without plasmin. (G,H) Cancer cells were treated with plasmin and subjected to HBMEC adhesion assays. Data are averages ± SEM. n=3, scoring at least 5 fields per coverslip. (I) Control or L1CAM-depleted H2030-BrM3 cells after infiltrating brain tissue slices. GFP+ cancer cells (green) and vasculature (collagen IV immunostaining, red) were visualized after 2 days. Two representative images are shown per condition. Lower panels, high magnification. (J,K) Quantification of cells that were spread on capillaries (J) and Ki67+ cells (K) in the experiments of panel I. Data are averages ± SEM. n=6 slices, scoring at least three fields per slice, from 2 independent experiments. (L) Effect of NS overexpression and L1CAM depletion on the interaction of PC9-BrM3 cells with capillaries in brain slices. (M,N) Quantification of cells that were spread on capillaries (M) and Ki67+ cells (N) in the experiments of panel L. Data are averages ± SEM, and quantitated as panels J,K. All P values by Student’s t-test. Scale bars: 10µm (B), 50µm (I,L). See also Figure S6.
Figure 7
Figure 7. L1CAM mediates metastatic outgrowth in the brain
(A) GFP+ H2030-BrM3 co-opting the basal lamina rich in collagen IV of endothelial cells labeled with VE-cadherin in brain slices. bl, basal lamina; e, endothelium; cc, cancer cell. (B) Immunohistochemical staining with anti-L1CAM antibodies and H&E counterstaining of incipient brain colonies formed by H2030-BrM3. Cancer cells (cc, pale blue nuclei) remain close to each other and interact with endothelial cells (e, dark blue nuclei). Insets, higher magnification of cell-cell contact areas. (C) H2030-BrM3 cells infiltrating the brain 7 days after intracardiac injection, and effect of L1CAM depletion. (D) Representative images of GFP+ metastatic lesions from brains in panel C. (E) Relative abundance of macrometastasis over micrometastasis (as defined in Figure 3F) in brains shown in panel D. Number of lesions: control= 283.2 ± 84.8, shL1CAM= 69.8 ± 11.5. Data are averages ± SEM. n=3 brains. (F,G) Representative images (F) and quantification (G) of ex vivo brain BLI from mice inoculated with indicated H2030-BrM3 cells. Control shRNA, n=9; shL1CAM, n=6. (H) Quantification of ex vivo brain BLI from mice that were arterially inoculated with indicated MDA231-BrM2 cells. Control shRNA, n=9; shL1CAM, n=10. (I) Quantification of ex vivo brain BLI from mice that were arterially inoculated with the indicated PC9-BrM3 cells (n=5–7). All P values were determined by Student’s t-test. Scale bar: 25µm (B), 30µm (F), 200µm (G). (J) Model of the action of the stromal PA-plasmin system against cancer cells that infiltrate the brain, and role of anti-PA serpins in protecting brain metastatic cells from stromal PA-plasmin. Reactive astrocytes produce PAs in the presence of extravasated cancer cells. Metastasis fails (left side) when PAs generate plasmin from neuron-derived plasminogen and plasmin mobilizes FasL from astrocytes to kill cancer cells. Additionally, plasmin cleaves and inactivates L1CAM, a cell adhesion molecule that cancer cells express for vascular cooption. Metastasis proceeds (right side) when brain metastatic cells express anti-PA serpins that prevent the generation of plasmin and its deleterious effects on the survival and vascular attachment of the cancer cells. See also Figure S7.

Comment in

References

    1. Adhami F, Yu D, Yin W, Schloemer A, Burns KA, Liao G, Degen JL, Chen J, Kuan CY. Deleterious effects of plasminogen activators in neonatal cerebral hypoxia-ischemia. Am J Pathol. 2008;172:1704–1716. - PMC - PubMed
    1. Ashkenazi A, Dixit VM. Death receptors: signaling and modulation. Science. 1998;281:1305–1308. - PubMed
    1. Bajou K, Peng H, Laug WE, Maillard C, Noel A, Foidart JM, Martial JA, DeClerck YA. Plasminogen activator inhibitor-1 protects endothelial cells from FasL-mediated apoptosis. Cancer Cell. 2008;14:324–334. - PMC - PubMed
    1. Baldini E, Ulisse S, Marchioni E, Di Benedetto A, Giovannetti G, Petrangeli E, Sentinelli S, Donnorso RP, Reale MG, Mottolese M, et al. Expression of Fas and Fas ligand in human testicular germ cell tumours. Int J Androl. 2009;32:123–130. - PubMed
    1. Beer R, Franz G, Schopf M, Reindl M, Zelger B, Schmutzhard E, Poewe W, Kampfl A. Expression of Fas and Fas ligand after experimental traumatic brain injury in the rat. J Cereb Blood Flow Metab. 2000;20:669–677. - PubMed

Publication types

MeSH terms