. 2014 Feb 27;156(5):1017-31.
doi: 10.1016/j.cell.2014.01.010.

Nuclear pores protect genome integrity by assembling a premitotic and Mad1-dependent anaphase inhibitor

Affiliations

Nuclear pores protect genome integrity by assembling a premitotic and Mad1-dependent anaphase inhibitor

Veronica Rodriguez-Bravo et al. Cell. .

Abstract

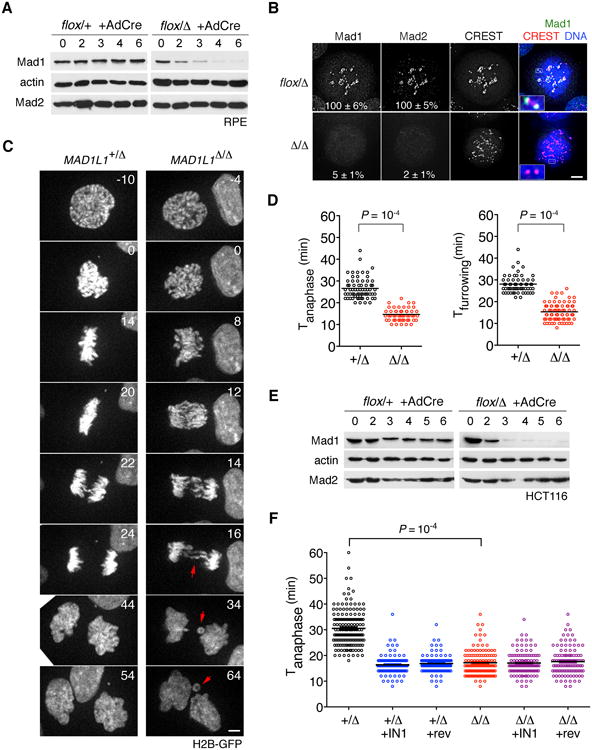
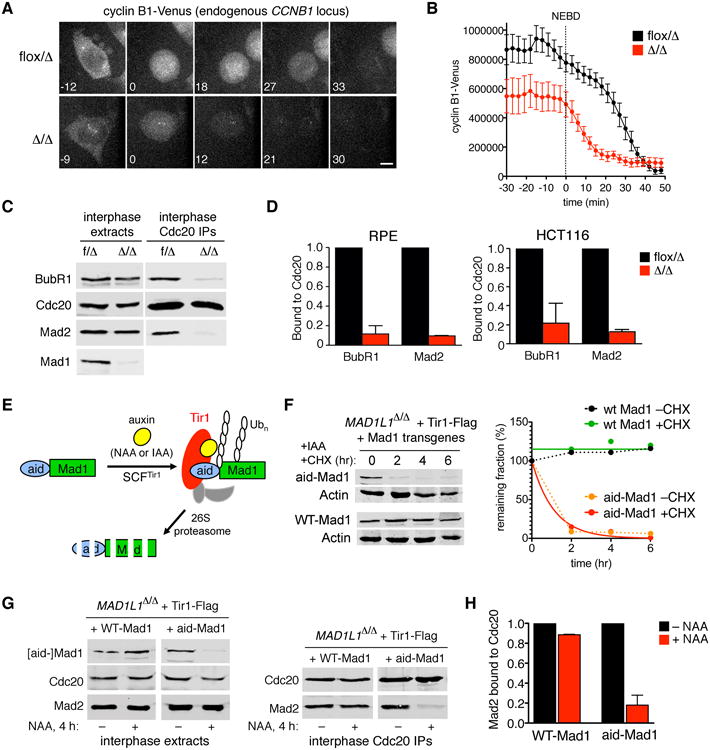
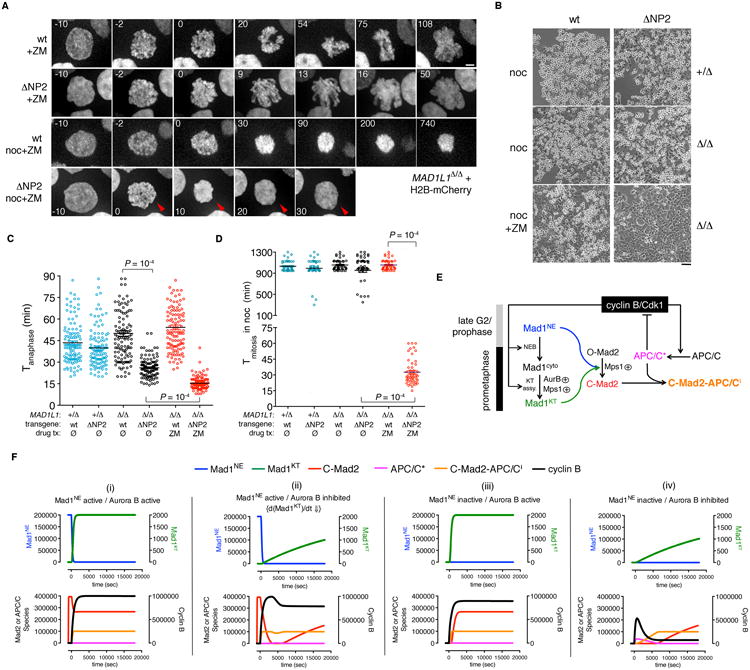
The spindle assembly checkpoint (SAC) delays anaphase until all chromosomes are bioriented on the mitotic spindle. Under current models, unattached kinetochores transduce the SAC by catalyzing the intramitotic production of a diffusible inhibitor of APC/C(Cdc20) (the anaphase-promoting complex/cyclosome and its coactivator Cdc20, a large ubiquitin ligase). Here we show that nuclear pore complexes (NPCs) in interphase cells also function as scaffolds for anaphase-inhibitory signaling. This role is mediated by Mad1-Mad2 complexes tethered to the nuclear basket, which activate soluble Mad2 as a binding partner and inhibitor of Cdc20 in the cytoplasm. Displacing Mad1-Mad2 from nuclear pores accelerated anaphase onset, prevented effective correction of merotelic errors, and increased the threshold of kinetochore-dependent signaling needed to halt mitosis in response to spindle poisons. A heterologous Mad1-NPC tether restored Cdc20 inhibitor production and normal M phase control. We conclude that nuclear pores and kinetochores both emit "wait anaphase" signals that preserve genome integrity.


Figures

Figure 1
Figure 1. Gene deletion reveals Mad1's dual roles in mitotic timing and checkpoint enforcement
(A) RPE cells in which one or both MAD1L1 alleles had been targeted with AAV vectors (see Figure S1) were infected with AdCre and sampled for 6 days thereafter. (B) Cells in (A) were treated with nocodazole and MG132 for 90 min. Maximum-intensity projections and magnified views of kinetochores (insets) are shown. Mad1 and Mad2 signals were normalized against CREST. Scale bar, 5 μm. (C) Cells expressing H2B-GFP were traced during an unperturbed mitosis. Time 0 denotes NEBD. Arrowheads highlight lagging chromatids and micronuclei. (D) The interval from NEBD to anaphase (left plot) or furrow ingression (right plot) was determined from timelapse recordings. See Movies S1 and S2. (E-F) HCT116 cells were modified at the MAD1L1 locus, infected with AdCre, and analyzed as above. Where indicated, Mps1-IN-1 or reversine was added. Datasets in (D) and (F) were compared by Student's t test.
Figure 2
Figure 2. Mad1 directs MCC assembly in interphase cells and stabilizes cyclin B both before and after NEBD
(A) Endogenous cyclin B1 was tagged with Venus (Figure S2A-C) and followed by spinning disk microscopy. Time 0 denotes NEBD. Scale bar, 5 μm. See Movie S3. (B) Cyclin B1-Venus profiles in control versus MAD1L1-null cells (n=10). (C-D) Mad1 controls interphase MCC assembly. Cdc20 and associated proteins were immunopurified from interphase extracts. Recovery of BubR1 and Mad2 was determined by quantitative blotting. Error bars denote SEM. (E) System for chemically induced proteolysis of Mad1. Upon auxin addition, aid-Mad1 is polyubiquitylated by SCFTir1, targeting it for destruction via the proteasome. (F) Cells were treated with 3-indoleacetic acid (IAA) in the presence or absence of cycloheximide. (G) Cells were treated with 1-naphthaleneacetic acid (NAA) for 4 hr, then processed as in (C). (H) Quantification of Mad2-Cdc20 complexes in (G). Error bars indicate SEM.
Figure 3
Figure 3. Mad1-Mad2 heterodimers promote interphase MCC assembly independently of nuclear transport
(A) Endogenous Mad2 was tagged with Venus (Figure S2D-F) and followed by fluorescence loss in photobleaching. Iteratively bleached regions are marked by white boxes. Signal intensities are displayed on a heatscale. (B) Signals in bleached cells (FLIP) or adjoining unbleached cells (CTRL) were determined from 10 cells per condition and plotted relative to the starting value. (C-D) Cells were stained with antibodies against Mad1, Tpr, total or closed Mad2, and mAb414. Single z-sections (interphase cells) or maximum-intensity projections (mitotic cells) are shown. (E) Fractionation of MCC subunits and regulators after aid-Mad1 degradation. Cells were treated with NAA, IAA, or DMSO for 3 hours, then fractionated prior to Western blotting. (F) Cdc20 and associated proteins were immunopurified from MAD1L1-null cells reconstituted with wildtype Mad1 (wt) or a mutant that cannot bind Mad2 (K541A L543A; Mad1AA). Error bars indicate SEM. (G) The NEBD-to-anaphase interval in Mad1wt and Mad1AA cells. (H) M phase duration in nocodazole-treated Mad1wtand Mad1AA cells. Scale bars, 5 μm. Datasets were compared by Student's t test. See also Figure S3.
Figure 4
Figure 4. Mad1's N-terminus mediates its NPC recruitment and is required for MCC production during interphase
(A) Overview of Mad1 architecture. The nuclear pore-targeting domain (NPD) was mapped in Figure S4. The Mad2-interaction domain (M2iD) and C-terminal domain (CTD) were described previously (Kim et al., 2012; Luo et al., 2002; Sironi et al., 2002). (B) In vitro pulldown assays. Tpr [1-775] was synthesized by in vitro translation, then tested for binding to recombinant Mad1 fragments (N [1-244], M [245-478], or C [484-718]) on Dynabeads. (C) FLAP-Madlwt and FLAP-Mad1ΔNP2 were immunoprecipitated with GFP-specific antibodies (detects FLAP tag) and blotted as shown. (D) Cells in (C) were immunostained after MAD1L1 deletion. Single z-sections and magnified views of NPCs are shown. (E) Cells in (C) were processed for interphase extracts before or after MAD1L1 deletion. Extracts were immunoprecipitated with GFP antibodies (middle panel) or Cdc20 antibodies (right panel). (F) Quantitation of Mad1-Mad2 and Mad2-Cdc20 binding. Error bars indicate SEM. (G) Spinning-disk imaging of MAD1L1-null cells reconstituted with FLAP-tagged Mad1wt or Mad1ΔNP2. Scale bars, 5 μm. See Movie S4. (H) Cells in (G) were treated with nocodazole. (I) Mitotic extracts and Cdc20 IPs were analyzed by Western blotting. (J) Quantitation of Mad2 and BubR1 binding to Cdc20. Error bars indicate SEM.
Figure 5
Figure 5. The premitotic “wait anaphase” signal enables error-free chromosome segregation
(A) Spinning-disk imaging of MAD1L1-null HCT116 cells expressing Mad1wt or Mad1ΔNP2 and H2B-mCherry. Where indicated, cells were treated with nocodazole (noc) to engage the SAC. Arrowheads indicate lagging chromosomes. Scale bars, 5 μm. See Movies S5 and S6. (B) Frequency of lagging chromosomes. Where indicated, Mad1ΔNP2 cells were treated with the APC/C inhibitor proTAME to delay anaphase by 10 min. (C) Lagging chromatids correlate with early anaphase. Cells in (B) were classified according to the presence or absence of lagging chromatids. Cumulative anaphase entry was then plotted. Genotypes with minimal (≤5%) lagging are displayed as a single group. (D) Lagging chromatids arise from merotelic errors. Boxes highlight kinetochores attached to microtubules spanning both spindle poles. (E) Anaphases were scored for lagging chromosomes with (grey bars) or without (striped bars) confirmed merotelic attachments. (F-G) Mad1wt and Mad1ΔNP2 cells were hybridized with a chromosome 6-specific probe. Lymphoblastoid cell lines (LCLs) from healthy human donors were used as controls. (G) Mad1ΔNP2 cells exhibit a marked increase in non-diploid FISH signals (30%) as compared with Mad1wt cells (5%). P-values were computed by chi-squared test.
Figure 6
Figure 6. The premitotic “wait anaphase” signal enhances SAC surveillance by decreasing the requirements for checkpoint signaling at kinetochores
(A) MAD1L1-null HCT116 cells expressing Mad1wt or Mad1ΔNP2 and H2B-mCherry were treated with ZM ± nocodazole. Arrowheads indicate a cell that entered and exited mitosis within 30 minutes. Scale bar, 5 μm. See Movies S7 and S8. (B) Phase-contrast micrographs of MAD1L1-null cells reconstituted with Mad1wt or Mad1ΔNP2 and treated with nocodazole ± ZM for 15 hr. Scale bar, 20 μm. (C and D) Loss of the NPC-derived timer makes Aurora B limiting for anaphase, mitotic exit, and checkpoint enforcement. (C) Cells were filmed in the presence or absence of ZM as in Fig. 3G. Data were compared by one-way ANOVA. (D) Cells were filmed in the presence of nocodazole ± ZM as in Fig. 3H. Data were compared by one-way ANOVA. See Fig. S5A. (E) Proposed scheme for synergy between NE- and kinetochore-associated Mad1-Mad2 pools during checkpoint establishment. (F) ODE implementation of (E) results in simulated M phase arrest so long as Mad1 is tethered to nuclear pores before NEBD and/or rapidly targeted to kinetochores after NEBD, in agreement with wet experiments. See Fig. S5B and the Extended Experimental Procedures.
Figure 7
Figure 7. Artificial Mad1-NPC tethering supports interphase MCC assembly and restores normal mitotic timing, fidelity, and checkpoint robustness
(A) Constructs for artificial Mad1-NPC tethering. (B) MAD1L1flux/Δ HCT116 cells expressing the constructs in (A) were infected with AdCre, then fixed and stained as shown. (C) Cells in (B) were processed for interphase extracts before and after MAD1L1 deletion. Mad2-Cdc20 binding was then quantified; error bars denote SEM. (D) Cells in (B) were followed by timelapse microscopy. For comparison, Mad1ΔNP2 cells were treated with proTAME to delay anaphase entry by ∼10 min (Fig. 5B-C). (E) Frequencies of lagging anaphase chromatids. Error bars indicate SEM. (F) Cumulative anaphase entry as a function of time after NEBD. Genotypes with minimal (≤5%) lagging are plotted as a single group. (G) Phase-contrast micrographs of MAD1L1-null cells reconstituted with Mad1wt, Mad1ΔNP2, or Mad1X and treated with nocodazole ± ZM for 15 hr. Scale bar, 20 μm. (H) Cells in (G) were transduced with an H2B-mCherry expression vector, then filmed in the presence of nocodazole ± ZM. (I) Mad1X remains NPC-bound after Tpr depletion. MAD1L1flux/Δ HCT116 cells expressing Mad1wt or Mad1X were transfected with Tpr-specific siRNA, then fixed and immunostained as in (B). (J) Cells expressing H2B-mCherry were transfected with siRNAs and followed by timelapse microscopy 72 hr later. P-values were computed by one-way ANOVA; n.s., not significant. (K) The frequency of lagging chromatids was determined from the recordings in (J). Error bars indicate SEM. Scale bars, 5 μm. See also Figure S6.

Comment in

References

    1. Arnaoutov A, Azuma Y, Ribbeck K, Joseph J, Boyarchuk Y, Karpova T, McNally J, Dasso M. Crm1 is a mitotic effector of Ran-GTP in somatic cells. Nat Cell Biol. 2005;7:626–632. - PubMed
    1. Bakhoum SF, Thompson SL, Manning AL, Compton DA. Genome stability is ensured by temporal control of kinetochore-microtubule dynamics. Nat Cell Biol. 2009;11:27–35. - PMC - PubMed
    1. Bapteste E, Charlebois RL, MacLeod D, Brochier C. The two tempos of nuclear pore complex evolution: highly adapting proteins in an ancient frozen structure. Genome Biol. 2005;6:R85. - PMC - PubMed
    1. Berdougo E, Terret M, Jallepalli P. Functional dissection of mitotic regulators through gene targeting in human somatic cells. Methods Mol Biol. 2009;545:21–37. - PubMed
    1. Cairo LV, Ptak C, Wozniak RW. Mitosis-Specific Regulation of Nuclear Transport by the Spindle Assembly Checkpoint Protein Mad1p. Mol Cell 2012 - PubMed

Publication types