. 2014 Feb 27;156(5):1060-71.
doi: 10.1016/j.cell.2013.12.044.

Multimodal integration of carbon dioxide and other sensory cues drives mosquito attraction to humans

Affiliations

Multimodal integration of carbon dioxide and other sensory cues drives mosquito attraction to humans

Conor J McMeniman et al. Cell. .

Abstract

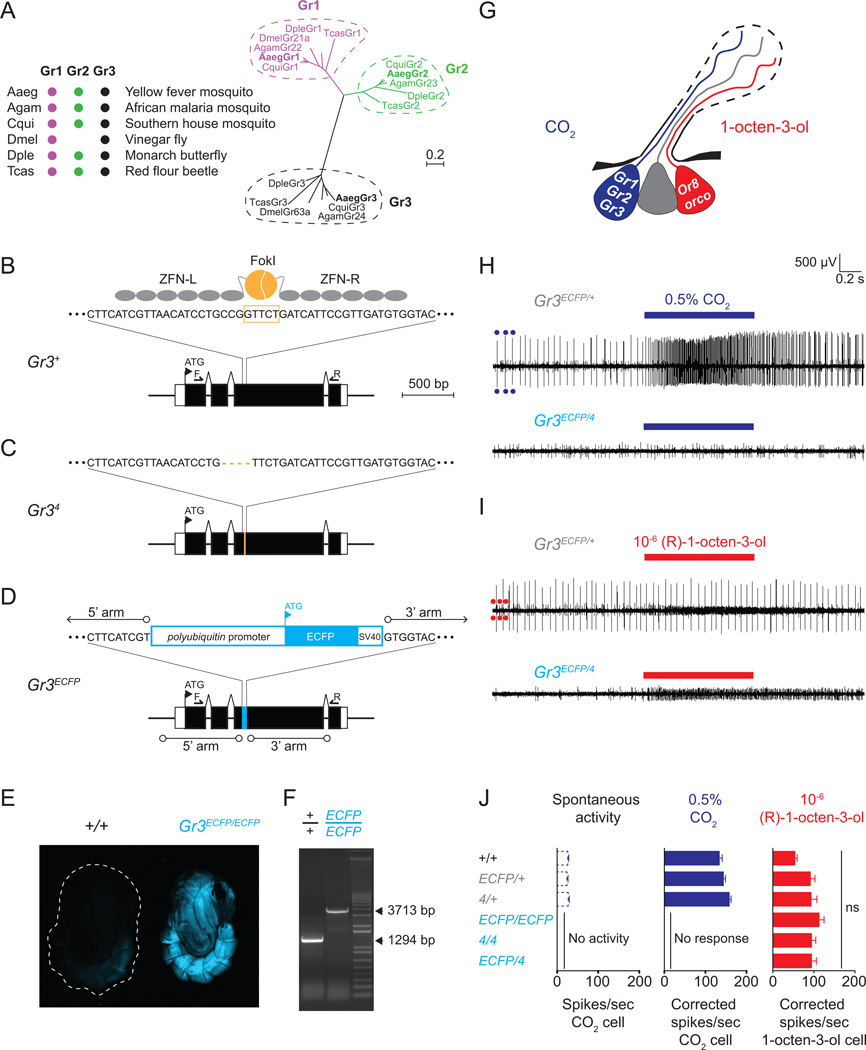
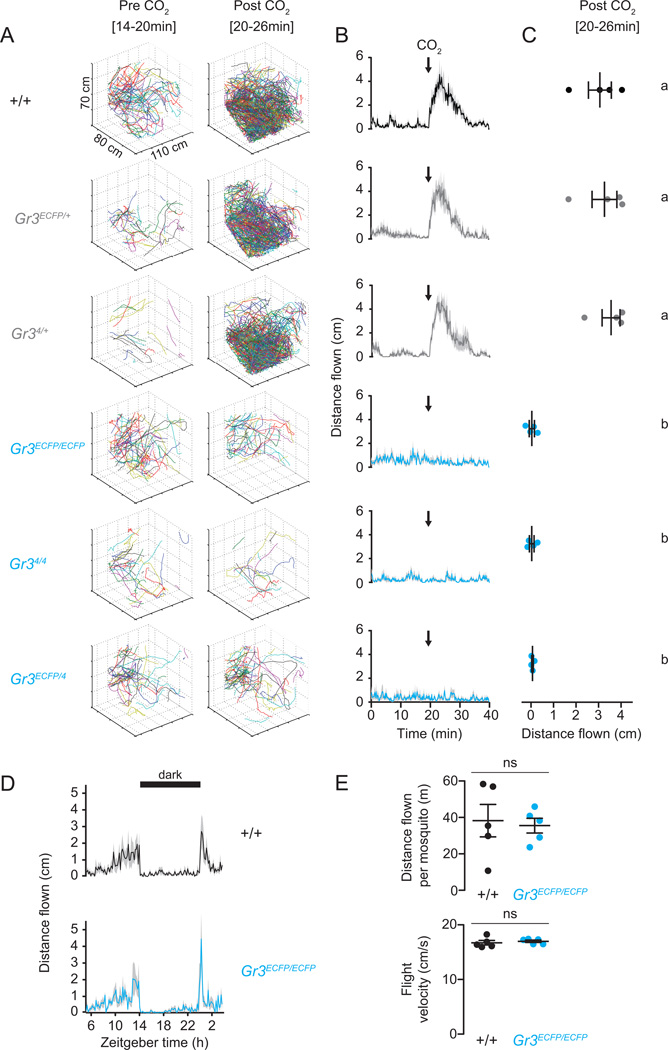
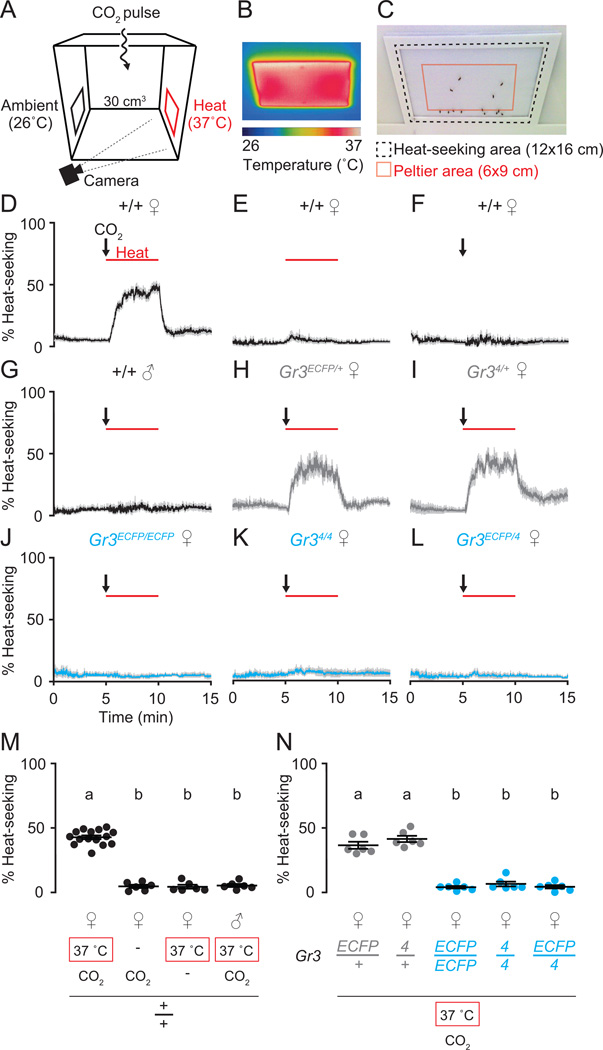
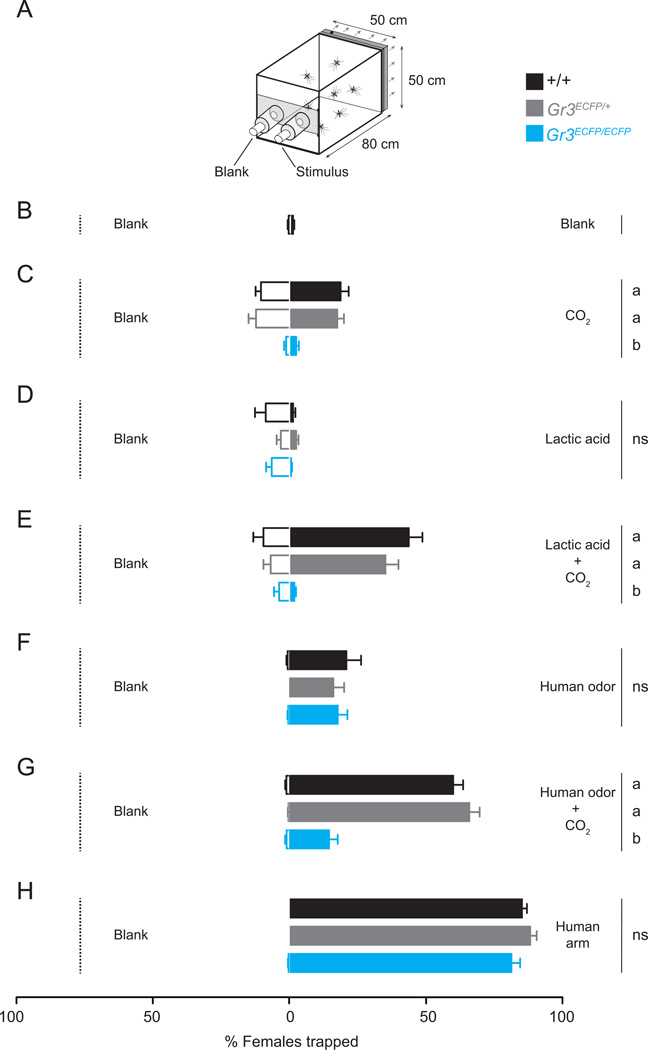
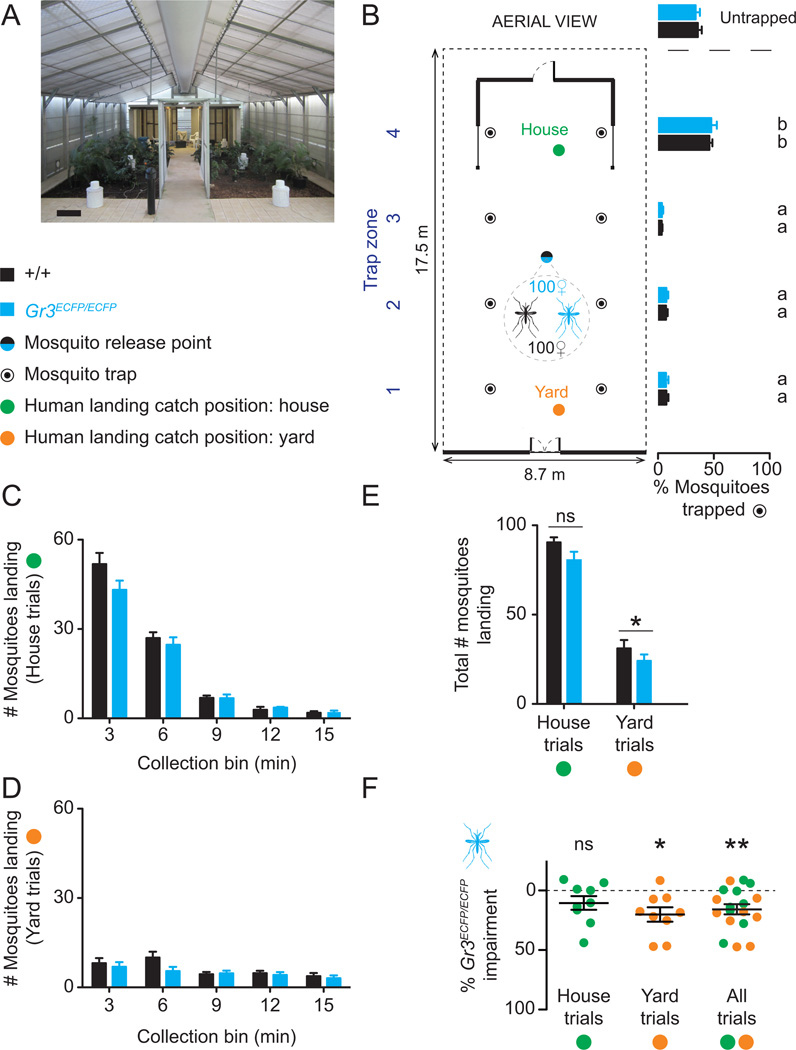
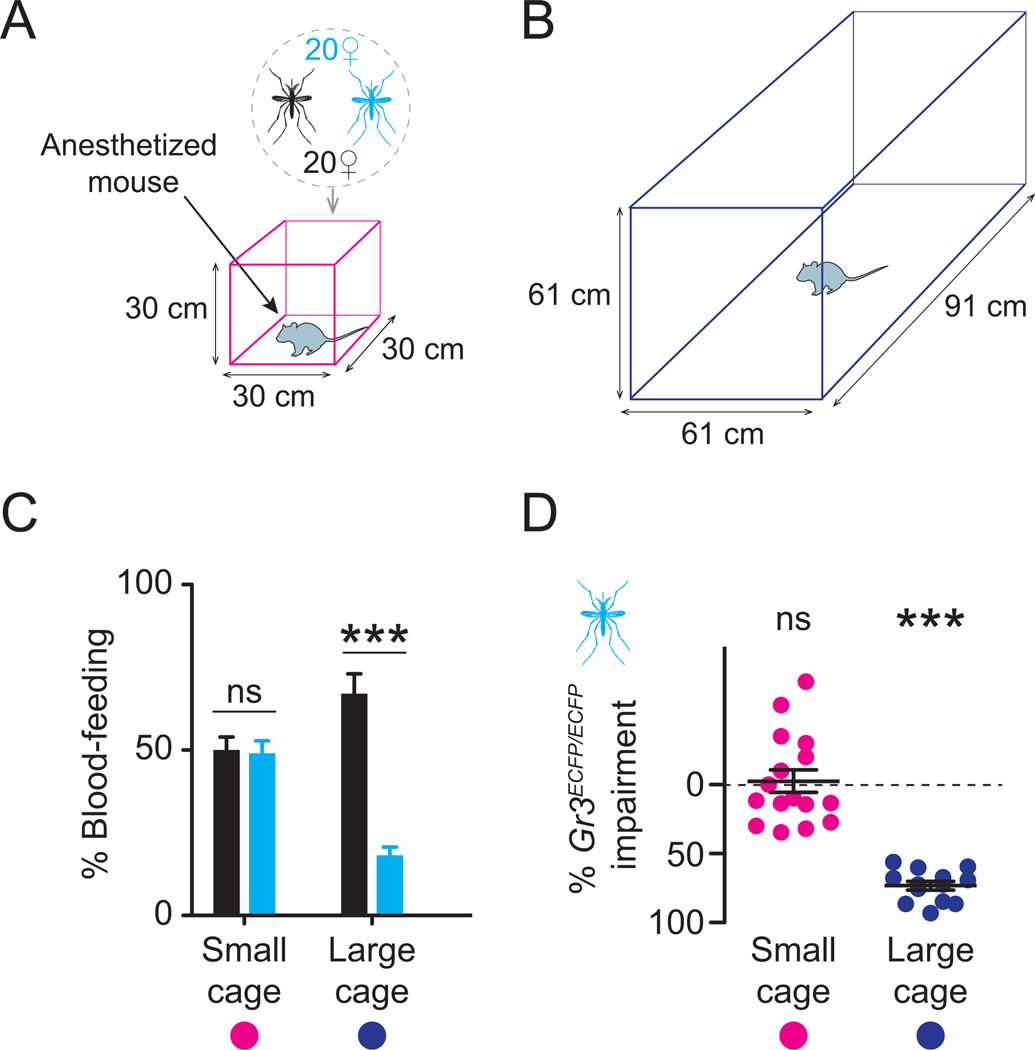
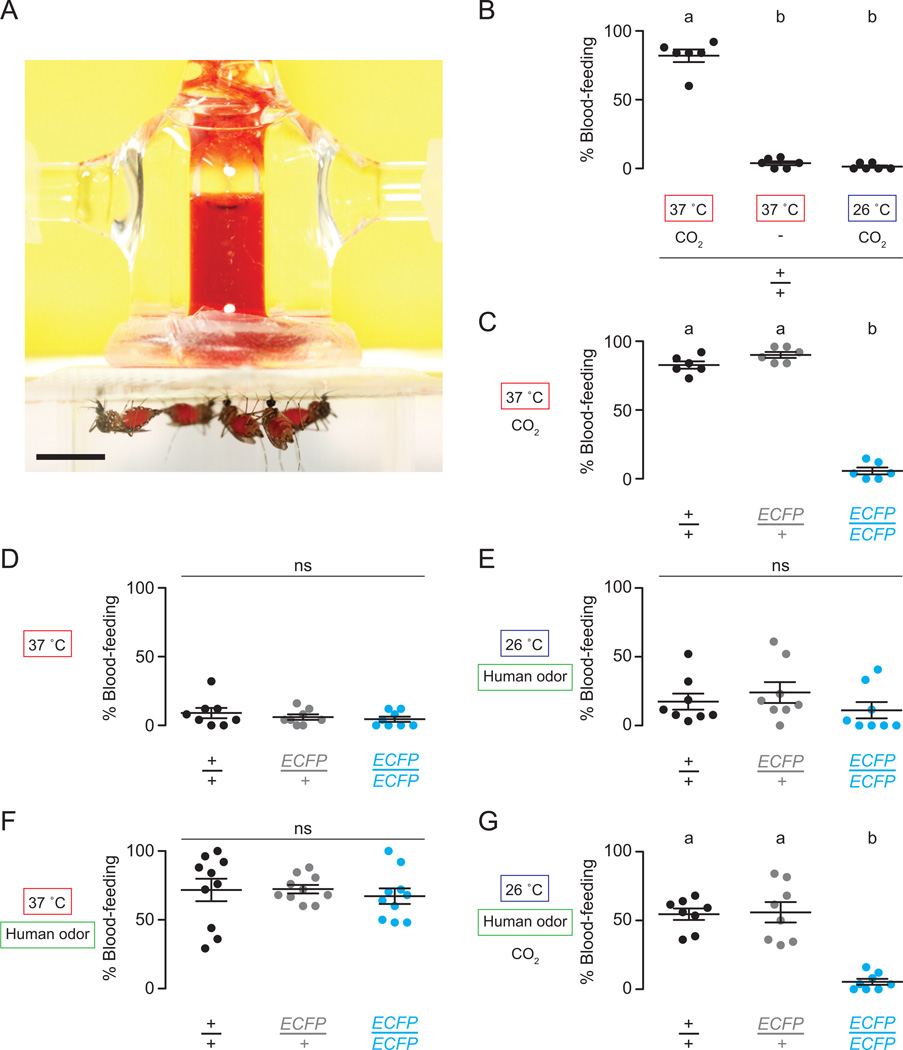
Multiple sensory cues emanating from humans are thought to guide blood-feeding female mosquitoes to a host. To determine the relative contribution of carbon dioxide (CO2) detection to mosquito host-seeking behavior, we mutated the AaegGr3 gene, a subunit of the heteromeric CO2 receptor in Aedes aegypti mosquitoes. Gr3 mutants lack electrophysiological and behavioral responses to CO2. These mutants also fail to show CO2-evoked responses to heat and lactic acid, a human-derived attractant, suggesting that CO2 can gate responses to other sensory stimuli. Whereas attraction of Gr3 mutants to live humans in a large semi-field environment was only slightly impaired, responses to an animal host were greatly reduced in a spatial-scale-dependent manner. Synergistic integration of heat and odor cues likely drive host-seeking behavior in the absence of CO2 detection. We reveal a networked series of interactions by which multimodal integration of CO2, human odor, and heat orchestrates mosquito attraction to humans.


Figures

Figure 1
Figure 1. Electrophysiological characterization of Gr3 mutants generated by ZFN gene editing
(A) Phylogenetic comparison of insect CO2 receptor genes. Aaeg: Aedes aegypti, Agam: Anopheles gambiae, Cqui: Culex quinquefasciatus, Dmel: Drosophila melanogaster, Dple: Danaus plexippus, Tcas: Tribolium castaneum. Branch lengths are proportional to sequence divergence. Scale bar, 0.2 amino acid replacements per site. (B) The Ae. aegypti Gr3 genomic locus, with a schematic of the Gr3 ZFN pair binding to exon 3 DNA and the Fok1 cleavage site indicated in orange. (C) Diagram of 4 bp deletion in the Gr34 genomic locus. (D) Diagram of the mutant Gr3ECFP genomic locus. (E) Representative fluorescent images of female wild-type and Gr3ECFP/ECFP mutants. (F) PCR products generated across the ECFP insertion site using the F and R primers indicated by small arrows in B and D. (G) Diagram of receptor expression and ligand-specificity of maxillary palp capitate peg sensillum OSNs. (H) Representative spike traces during extracellular recordings from a Gr3 ECFP/+ heterozygous (top) and Gr3 ECFP/4 mutant (bottom) capitate peg sensillum evoked by 0.5% CO2. Dark blue circles mark large amplitude spikes from the CO2-sensitive OSN. Stimulus bar (blue): 1 sec. (I) Representative spike traces from heterozygous and mutant basiconic sensilla evoked by 10−6 (R)-1-octen-3-ol. Red circles mark small amplitude spikes from the 1-octen-3-ol-sensitive OSN. Stimulus bar (red): 1 sec. (J) Summary of spontaneous activity and CO2- and (R)-1-octen-3-ol-evoked responses in the indicated genotypes. Data are presented as mean ± s.e.m. Genotypes did not differ in their response to (R)-1-octen-3-ol (one-way ANOVA, p = 0.07 (ns, not significant; n=8–16 sensilla recorded from at least 3 mosquitoes per genotype).
Figure 2
Figure 2. Ae. aegypti Gr3 mutants are not activated by CO2 and retain normal locomotor behavior
(A–C) CO2-evoked flight activity of groups of female Ae. aegypti wild-type, heterozygous, and mutant mosquitoes tracked for 20 min before and after a 40 sec pulse of CO2 (n=4 replicates per genotype; n=20 mosquitoes/trial). (A) Representative three-dimensional tracks of the indicated genotypes in the 6 min pre- (left) and post-application (right) of a 40 sec pulse of CO2. (B) Distance flown in 1 sec bins per mosquito in response to stimulation with CO2 (black arrow). Data are shown as mean (solid line) ± s.e.m (grey shading). (C) Mean distance flown per sec for mosquitoes post-application of CO2 (t=20–26min). Each replicate is indicated by a dot and mean ± s.e.m. as bars. Variation among genotypes was significant (one-way ANOVA, p < 0.0001). Genotypes marked with different letters are significantly different by post hoc Tukey’s HSD test (p < 0.001). (D) Locomotor activity of wild-type and Gr3ECFP/ECFP mutant mosquitoes measured as cm/min/animal over a 23 hr period (dark period indicated by black bar) without supplemental CO2 (n=5 replicates per genotype; 20 females per replicate). Data are shown as mean (solid line) ± s.e.m (grey shading). (E) Total distance flown per mosquito and average flight velocity of data in D. Each replicate is indicated by a dot and mean ± s.e.m. as bars (ns, not significant; t-test, p > 0.05).
Figure 3
Figure 3. CO2 detection gates heat-seeking behavior in female Ae. aegypti
(A) Schematic of the mosquito heat-seeking assay. (B) Thermal image of target Peltier heated to 37°C. (C) Image indicating Peltier location (red outline) and area scored for heat-seeking (black dashed line). (D–L) Mosquitoes of the indicated sex and genotype seeking an ambient or heated target, with or without a pulse of CO2. The 5 min 37°C stimulus is indicated by the red bar. The 20 sec pulse of CO2 is indicated by the black arrow. Data are shown as mean (solid line) ± s.e.m (grey shading) [n=6 trials, except (D) where n=15; 20–25 mosquitoes/trial]. (M–N) Quantification of heat-seeking during minutes 7–10 of assay. Each replicate is indicated by a dot and mean ± s.e.m. as bars. Variation among both stimulus regimes and mosquito genotypes were significant (one-way ANOVA, p < 0.0001 for both M and N). Data labeled with different letters are significantly different using Tukey’s HSD test comparing all pairs of means (p < 0.001).
Figure 4
Figure 4. CO2 synergizes with host odor to drive mosquito attraction
(A) Diagram of the two-port olfactometer. (B–H) Response of the indicated genotypes to a choice of the blank port compared to the stimulus indicated at the right. Data are plotted as mean ± s.e.m (n=8–11 trials per condition; n=50 mosquitoes per trial). Significance was assessed with one-way ANOVA. Genotypes marked with different letters are significantly different by Tukey’s HSD test (p < 0.0001; ns, not significant; n=50 mosquitoes per trial).
Figure 5
Figure 5. Gr3 mutants have diminished responses to live humans in a semi-field environment
(A) Interior view semi-field cage. Scale bar: 0.5 m. (B) Schematic of the semi-field cage showing the average distribution of a 50:50 mix of wild-type and Gr3ECFP/ECFP mutant female mosquitoes (n=100 per genotype) in the cage in the absence of humans (n=5 trials). Distribution varied significantly according to trap zone, but not genotype (two way-ANOVA, P<0.0001 for trap zone and P=0.773 for genotype). Different letters indicate significantly different means by post hoc Tukey’s HSD test. (C–D) Number of mosquitoes of the indicated genotype landing on human subjects in 3 min bins during 15 min at house (C) or yard (D) position (n=9 trials per position). (E) Total number of mosquitoes landing in human landing catch trials with human volunteers at house or yard position. Paired t-tests were used to assess statistical significance in comparisons between genotypes (ns, not significant, p=0.09; * p=0.018). (F) Relative impairment in host-seeking of Gr3ECFP/ECFP mutants compared to wild-type mosquitoes (one-sample t-test relative to zero; ns, not significant, p = 0.105; * p = 0.011; ** p = 0.002). In B–F, all data are plotted as mean ± s.e.m.
Figure 6
Figure 6. Spatial scale-dependent responses of Gr3 mutants to live animal hosts
(A–B) Diagrams of small (A) and large (B) cage assays. (C–D) Per cent blood-feeding of the indicated genotype (C) and impairment of Gr3ECFP/ECFP mutants relative to wild-type (D). Significance was assessed in C with paired t-tests and in D with a one-sample t-test relative to zero (ns, not significant; *** p < 0.001). All data are plotted as mean ± s.e.m (small cage: n=16 trials; large cage: n=13 trials; n=20 mosquitoes/genotype/trial).
Figure 7
Figure 7. Multiple host sensory cues combine to elicit mosquito blood-feeding behavior
(A) Image of female Ae. aegypti mosquitoes blood-feeding from a glass membrane feeder. Scale bar, 0.5 cm. (B) Blood-feeding responses of wild-type mosquitoes with different blood-temperatures and ±CO2. (C–G) Blood-feeding responses of the indicated genotypes with different blood-temperatures ±CO2 ±human odor. In B–G, significance was assessed with one-way ANOVA. Data labeled with different letters are significantly different using Tukey’s HSD test (p < 0.001; ns, not significant). Replicate data points and mean ± s.e.m. are shown (n=6–10 trials/genotype and condition; n=25 mosquitoes per trial).

References

    1. Acree F, Jr, Turner RB, Gouck HK, Beroza M, Smith N. L-Lactic acid: a mosquito attractant isolated from humans. Science. 1968;161:1346–1347. - PubMed
    1. Anton S, van Loon JJ, Meijerink J, Smid HM, Takken W, Rospars JP. Central projections of olfactory receptor neurons from single antennal and palpal sensilla in mosquitoes. Arthropod Struct Dev. 2003;32:319–327. - PubMed
    1. Benton R, Vannice KS, Gomez-Diaz C, Vosshall LB. Variant ionotropic glutamate receptors as chemosensory receptors in Drosophila. Cell. 2009;136:149–162. - PMC - PubMed
    1. Bohbot J, Pitts RJ, Kwon HW, Rutzler M, Robertson HM, Zwiebel LJ. Molecular characterization of the Aedes aegypti odorant receptor gene family. Insect Mol Biol. 2007;16:525–537. - PMC - PubMed
    1. Burgess L. Probing behavior of Aedes aegypti (L.) in response to heat and moisture. Nature. 1959;184:1968–1969.

Publication types