. 2014 Feb 27;156(5):1084-95.
doi: 10.1016/j.cell.2014.01.013.

Reciprocal encoding of signal intensity and duration in a glucose-sensing circuit

Affiliations

Reciprocal encoding of signal intensity and duration in a glucose-sensing circuit

Yan Fu et al. Cell. .

Abstract

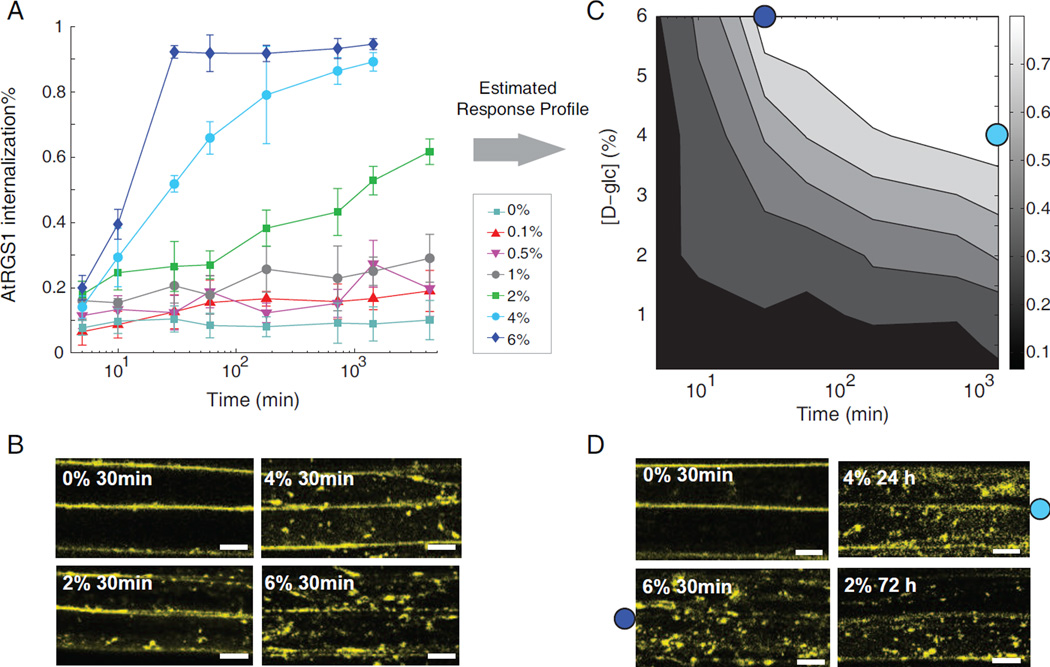
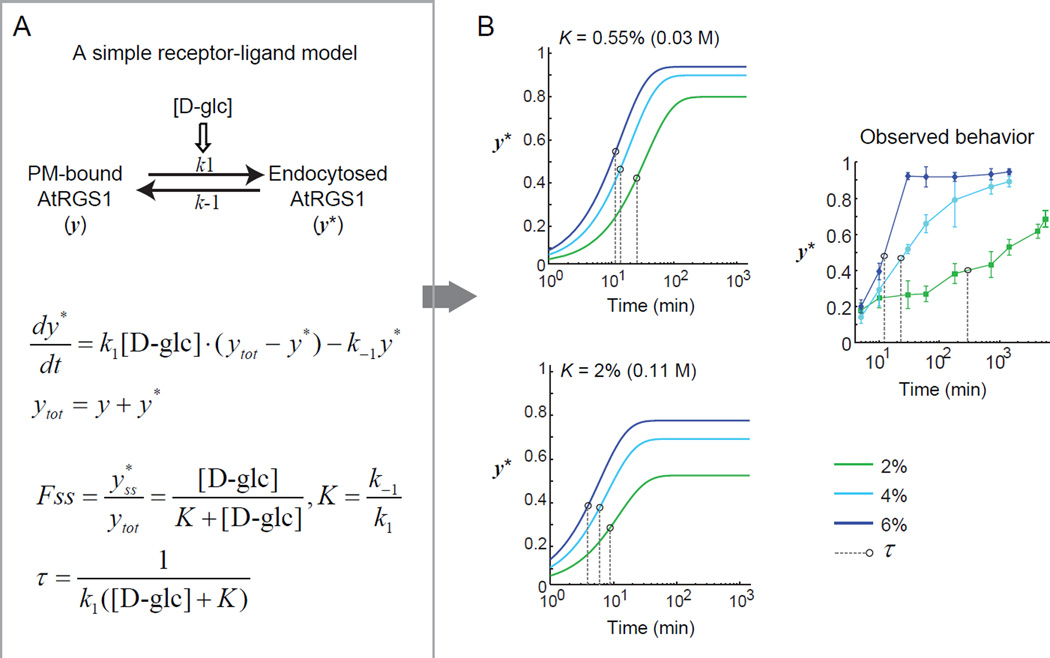
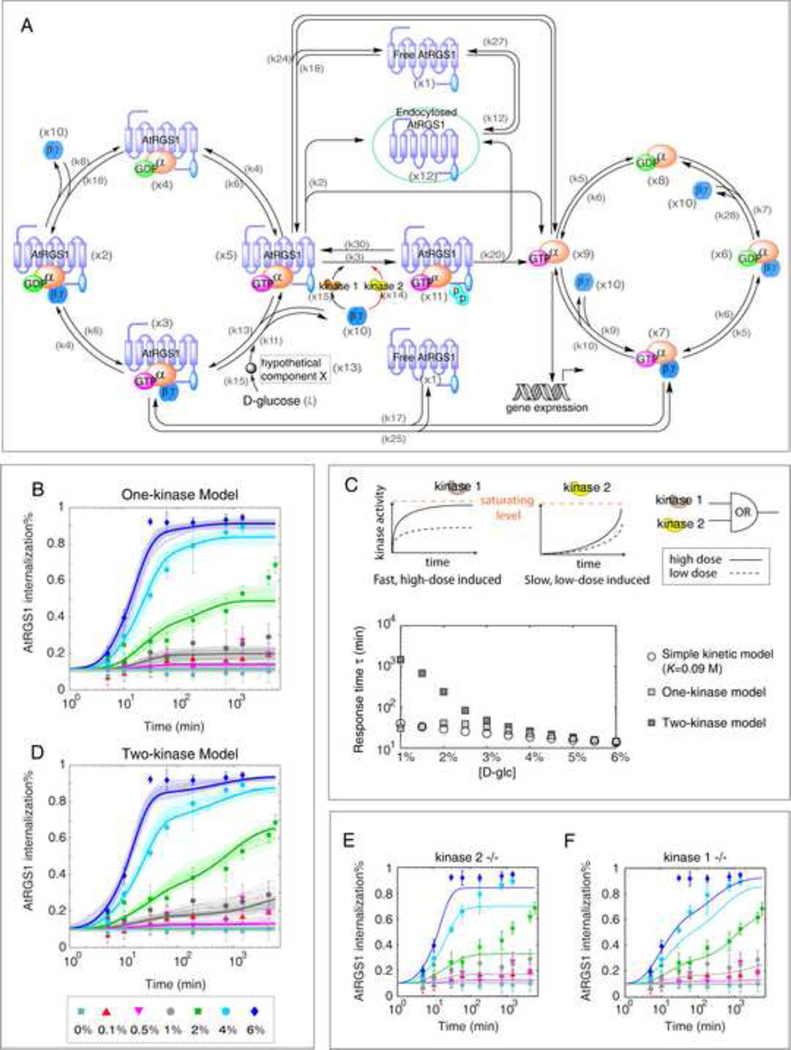
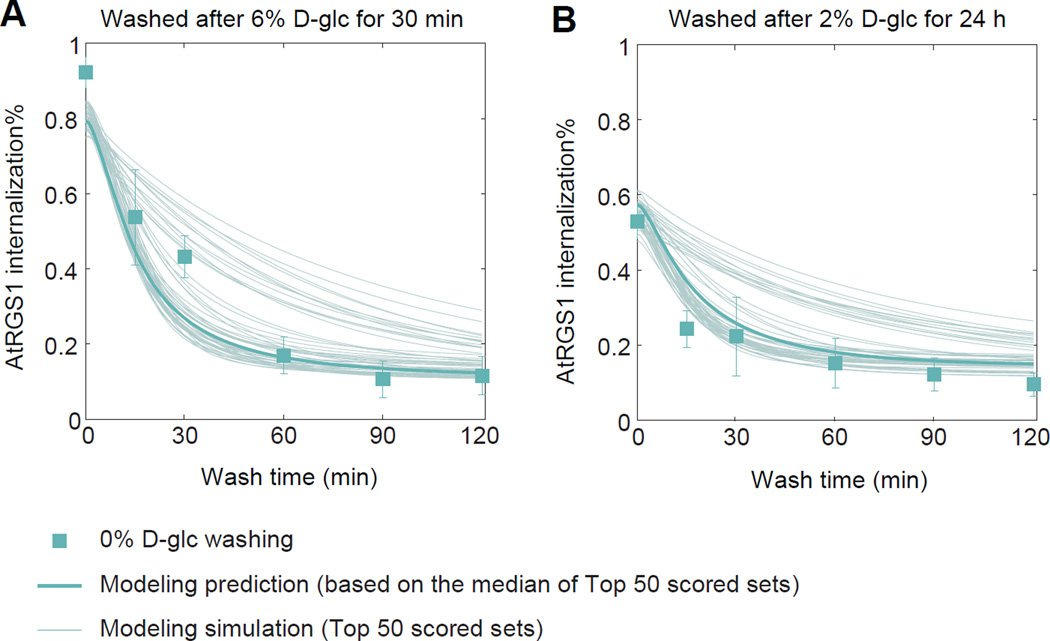
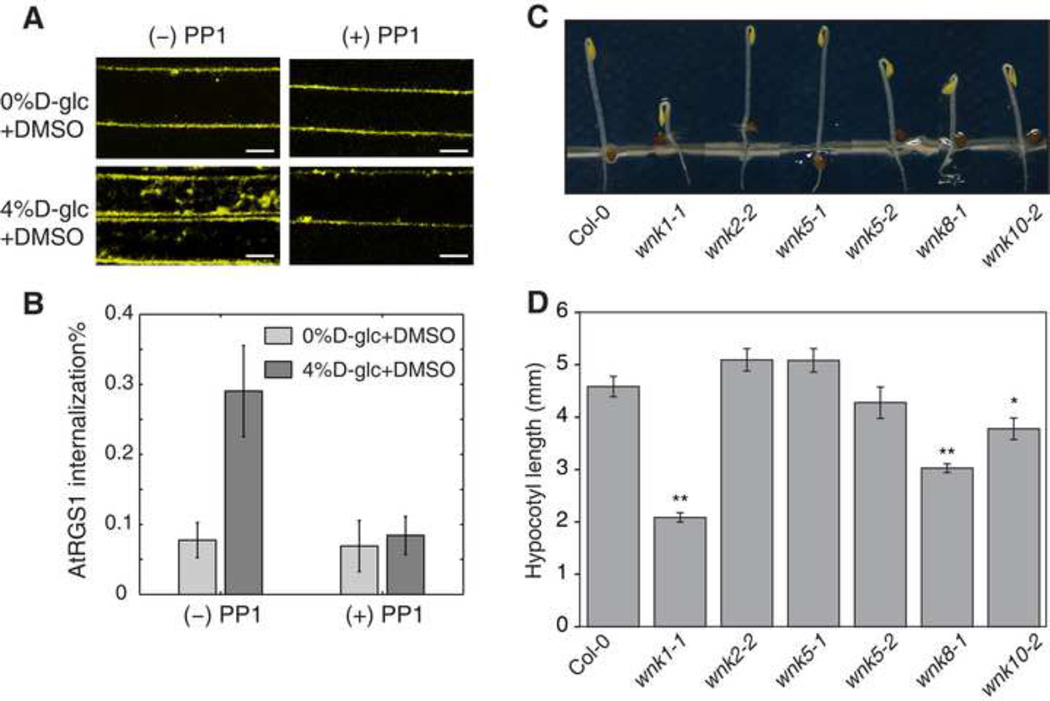
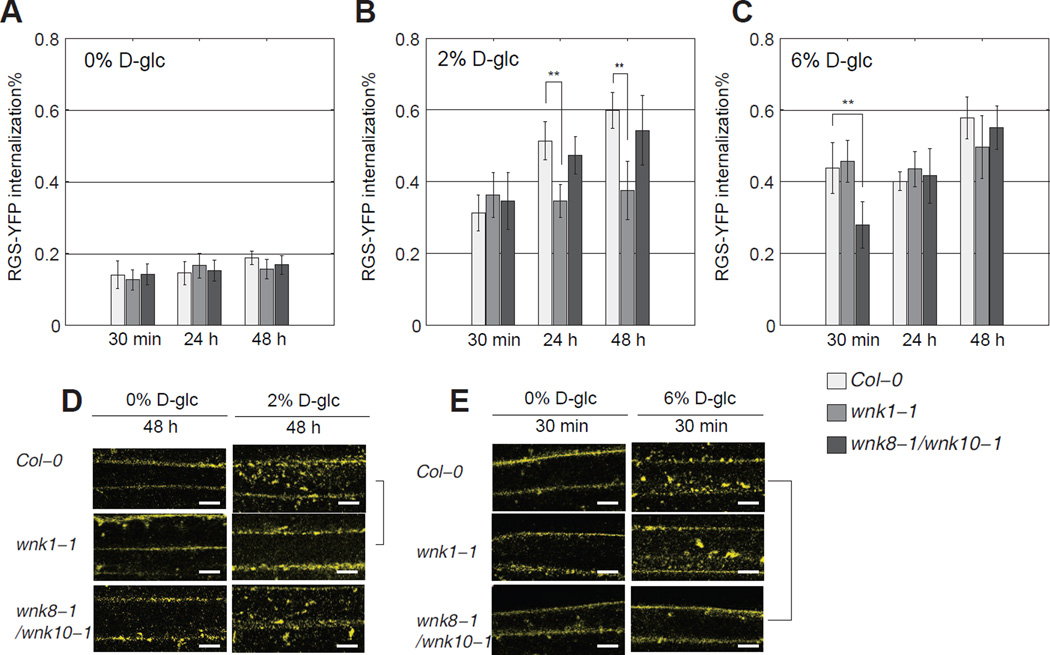
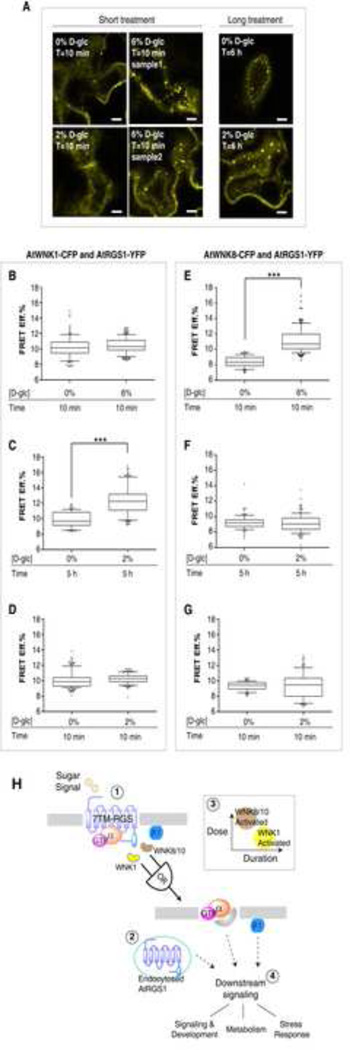
Cells continuously adjust their behavior in response to changing environmental conditions. Both intensity and duration of external signals are critical factors in determining what response is initiated. To understand how intracellular signaling networks process such multidimensional information, we studied the AtRGS1-mediated glucose response system of Arabidopsis. By combining experiments with mathematical modeling, we discovered a reciprocal dose and duration response relying on the orchestrated action of three kinases (AtWNK1, AtWNK8, and AtWNK10) acting on distinct timescales and activation thresholds. Specifically, we find that high concentrations of D-glucose rapidly signal through AtWNK8 and AtWNK10, whereas low, sustained sugar concentration slowly activate the pathway through AtWNK1, allowing the cells to respond similarly to transient, high-intensity signals and sustained, low-intensity signals. This "dose-duration reciprocity" allows encoding of both the intensity and persistence of glucose as an important energy resource and signaling molecule.


Figures

Figure 1
Figure 1. The reciprocal dose-and-duration response in the AtRGS1 endocytosis
(A) Transgenic AtRGS1-YFP Arabidopsis seedlings are treated with D-glucose at the indicated concentrations and monitored over time at the hypocotyl regions. Fluorescence was detected using a confocal laser scanning microscopy. Measurements of the internalized fluorescence percentage were used to evaluate AtRGS1 endocytosis, error bar = 2 × S.E.M (See Experimental Procedures) (B) Representative snap shots taken at 30 min for the AtRGS1 internalization with varying D-glucose (D-glc) concentrations. Scale bar = 10 μm (C) Experimentally determined 2D contour plot of AtRGS1 internalization as a function of D-glucose concentration and treatment time. (D) Dose-duration reciprocity. Snap shot of AtRGS1 endocytosis under D-glc concentration and time as indicated. (C, D) Typical images of AtRGS1 endocytosis shown in panel D at conditions shown in panel C are 6% D-glucose for 30 min (labeled as dark blue dot) and 4% D-glucose for 24 h (labeled as light blue dot). Scale bar = 10 μm.
Figure 2
Figure 2. A simple kinetic model for AtRGS1 deactivation
(A) A simple “receptor-ligand” model with a deactivation rate of AtRGS1 being proportional to the D-glucose concentration. The steady-state fraction of internalized AtRGS1 Fss and the characteristic time scale τ to reach steady state is analytically calculated. (B) Full pathway activation requires [D-glc] ≫ K. In this limit τ ≈ 1/(k1[D-glc]) and the time to reach steady state is relatively insensitive to [D-glc] (top panel). For the time to reach steady state to change significantly with [D-glc] requires [D-glc] ≈ K (bottom panel). However, in this scenario the Fss changes significantly with [D-glc]. For comparison the experimental data are shown (right panel). Black circles indicate the characteristic time scale τ of each curve. Refer to Figure S1 for the results of a thorough parameter search for this simple kinetic model.
Figure 3
Figure 3. Modeling the dose-duration reciprocity in AtRGS1 endocytosis
(A) Molecular interactions in the Arabidopsis G signaling network included in the models. The initial model includes a single kinase (one-kinase model) that phosphorylates AtRGS1. In the two-kinase model the second kinase acting on a different time scale is added (center red arrows). Refer to the main text for a description of the model.(B) The one-kinase model fails to reproduce the observed dose-duration reciprocity. Fitting results for the top 50 scored parameter sets are shown in thin lines with light tone. Thick lines represent the prediction calculated from the median of the top 50 scored parameter sets (Md1kinasetop50, values shown in Table S3). (C) Top panels: In the two kinase model, the two kinases are activated with different kinetics (top panels). AtRGS1 phosphorylation follows “OR” logic with either kinase capable of phosphorylating the protein. Bottom panel: Response time (τ) to reach half of the steady state under differential sugar concentrations based on the simple model (with parameter values from Figure S1D), one-kinase model (Md1kinasetop50,Table S3) and two-kinase model (Md2kinasetop50, Table S3). (D) The two-kinase model reproduces the AtRGS1 internalization data. Fitting results for the top 50 parameter sets are plotted with thin lines in light tone. Thick lines are calculated from the median of the top 50 scored parameter sets (Md2kinasetop50, values shown in Table S3). The modeling prediction in (E) kinase 2 deleted mutant and (F) kinase 1 deleted mutant. The prediction is given based on Md2kinasetop50 with the action from one kinase blocked. Western blot showing stable AtGPA1 and AGB1 levels independent of D-glucose treatment is provided in Figure S2, as evidence supporting assumption on conserved G protein level upon glucose treatment. Top parameter sets and time courses for each signaling component using the two-kinase model with parameter values are shown in Figure S3. In addition, the model predicts that the accumulation of Gα in the active G protein cycle is proportional to AtRGS1 endocytosis over the 7 different D-glucose concentrations tested as shown in Figure S5. Variables of the quantitative model are provided in Table S1, and the ODEs of the one- and two- kinase model provided in Table S2.. The median of the top scored parameter sets based on the one-kinase (Md1kinasetop50) and the two-kinase (Md2kinasetop50) are listed in Table S3.
Figure 4
Figure 4. Testing the model on relaxation experiment
Arabidopsis seedlings that were treated with either (A) 6% D-glucose for 30 min or (B) 2% for 24 h were quickly washed 3 times with water before transferred into water medium. AtRGS1-YFP internalization was monitored using confocal microscope at specific times in water (data presented in green squares, error bar = 2 × S.E.M.). The predicted internalization (fine lines) from the model based on the top 50 scored parameter sets. Prediction based on the median of the top 50 scored parameter sets (Md2kinasetop50) was plotted in thick.
Figure 5
Figure 5. Physiological phenotypes of wnk mutants
(A, B) Four-day-old seedlings that express AtRGS1-YFP were pre-treated with a kinase inhibitor, 50 μM PP1 for 3 h followed by D-glucose treatment for 1 h as shown in the panel. The control seedlings were treated with DMSO as the solvent control. PP1 is commonly used as a Src-family kinase inhibitor, but also suppressed human WNK kinase activity in vitro (Yagi et al., 2009). Among 42 kinase inhibitors comprehensively examined, the specificity of PP1 was relatively specific, although PP1 still inhibited 4 of 28 tested mammalian kinases (Bain et al., 2003; Davies et al., 2000). The Arabidopsis genome encodes no homologous genes to Src-family kinase genes. (B) Quantified data are shown as mean ± 2 × S.E.M. (C, D) Seedlings were grown on ½ × MS plates with 1% sucrose for 2 d in darkness. Length of hypocotyls was measured and quantified. Data are mean ± SEM. Student’s t-test was used to compare values to the Col-0. Sample size = 23–49,*, p < 0.01; **, p < 0.001. Representative seedlings of Columbia (Col-0) and wnk mutants are shown in C.
Figure 6
Figure 6. Coordinated kinase activity between AtWNK1, AtWNK8 and AtWNK10 under different sugar conditions
(A–C) Wild type Col-0, mutant wnk1-1 and wnk8-1/wnk10-1 seedlings transiently transfected with AtRGS1-YFP (see Materials and Methods) are treated with D-glucose at the indicated concentration and time, and imaged with confocal microscopy for AtRGS1 internalization amount (see Materials and Methods). Error bar = 2 × S.E.M. (D, E) Representative microscope images. Scale bar = 10 μm.
Figure 7
Figure 7. Specific WNK kinases are recruited to interact with AtRGS1 on differential sugar dose-and-duration regime
(A) Paradermal optical section of AtRGS1 endocytosis in tobacco epidermal cells transiently transfected by AtRGS1-YFP with D-glucose treatment as indicated. Scale bar = 10 μm. Refer to Figure S6 for top view and middle view of the AtRGS1 endocytosis along Z-stack in tobacco epidermal cells. Sensitized emission FRET was carried out between AtWNK1-CFP and AtRGS1-YFP or between AtWNK8-CFP and AtRGS1-YFP in tobacco epidermal cells at the indicated dose and duration (see Experimental Procedures). Quantification is represented as the FRET Efficiency (FRET Eff.%) between AtWNK1-CFP and AtRGS1-YFP (B–D) and between AtWNK8-CFP and AtRGS1-YFP (E–G) as described in Experimental Procedures. ***: p-value < 0.0001, unpaired t-test, sampling size (ROIs) = 95 – 176 (the AtWNK1 case), 89–121 (the AtWNK8 case). The whiskers represent 10–90 percentile of the data. Outliers (<10% or >90%) are presented in black dots surrounding the whiskers. (H) Proposed model of dual-kinase coordination on specific sugar condition. Through recruiting or activating kinases at different dose and duration regime, the plant cells may endow the ability to decode environmental clue of the sugar availability, through which specific downstream signal may be propagated. (1) Arabidopsis G protein is kept in its inactive state by the action of a 7TM-RGS1. The presence of D-glucose, in the mM range, releases inhibition of the G protein complex by physically uncoupling and thus allowing the G protein to self-activate. (2) Physical uncoupling is achieved by AtRGS1 endocytosis. (3) This physical uncoupling requires the action of three kinases designated AtWNK1, AtWNK8 and AtWNK10 operating with the indicated OR-gate. We speculate that WNK1 is recruited to AtRGS1 by low D-glucose for a long duration and WNK8/10 are recruited to AtRGS1 by a high dose of D-glucose for a short duration (inset, dose-duration relationship). (4) Arrows indicate that downstream signaling is propagated by the action of both G proteins on the plasma membrane and AtRGS1 on the endosome.

Similar articles

Cited by

References

    1. Bain J, McLauchlan H, Elliott M, Cohen P. The specificities of protein kinase inhibitors: an update. Biochem J. 2003;371:199–204. - PMC - PubMed
    1. Bonardi V, Pesaresi P, Becker T, Schleiff E, Wagner R, Pfannschmidt T, Jahns P, Leister D. Photosystem II core phosphorylation and photosynthetic acclimation require two different protein kinases. Nature. 2005;437:1179–1182. - PubMed
    1. Booker KS, Schwarz J, Garrett MB, Jones AM. Glucose attenuation of auxin-mediated bimodality in lateral root formation is partly coupled by the heterotrimeric G protein complex. PLoS One. 2010;5 - PMC - PubMed
    1. Chen J-G, Gao Y, Jones AM. Differential Roles of Arabidopsis Heterotrimeric G-Protein Subunits in Modulating Cell Division in Roots. Plant Physiology. 2006;141:887–897. - PMC - PubMed
    1. Chen J-G, Willard FS, Huang J, Liang J, Chasse SA, Jones AM, Siderovski DP. A Seven-Transmembrane RGS Protein That Modulates Plant Cell Proliferation. Science. 2003;301:1728–1731. - PubMed

Publication types