. 2014 Mar 13;156(6):1247-1258.
doi: 10.1016/j.cell.2014.01.049. Epub 2014 Feb 27.

Discovery of unconventional kinetochores in kinetoplastids

Affiliations

Discovery of unconventional kinetochores in kinetoplastids

Bungo Akiyoshi et al. Cell. .

Abstract

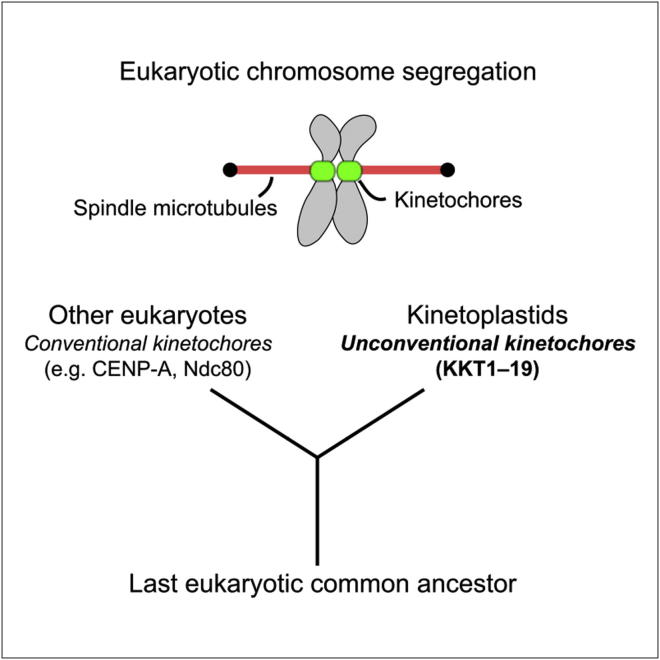
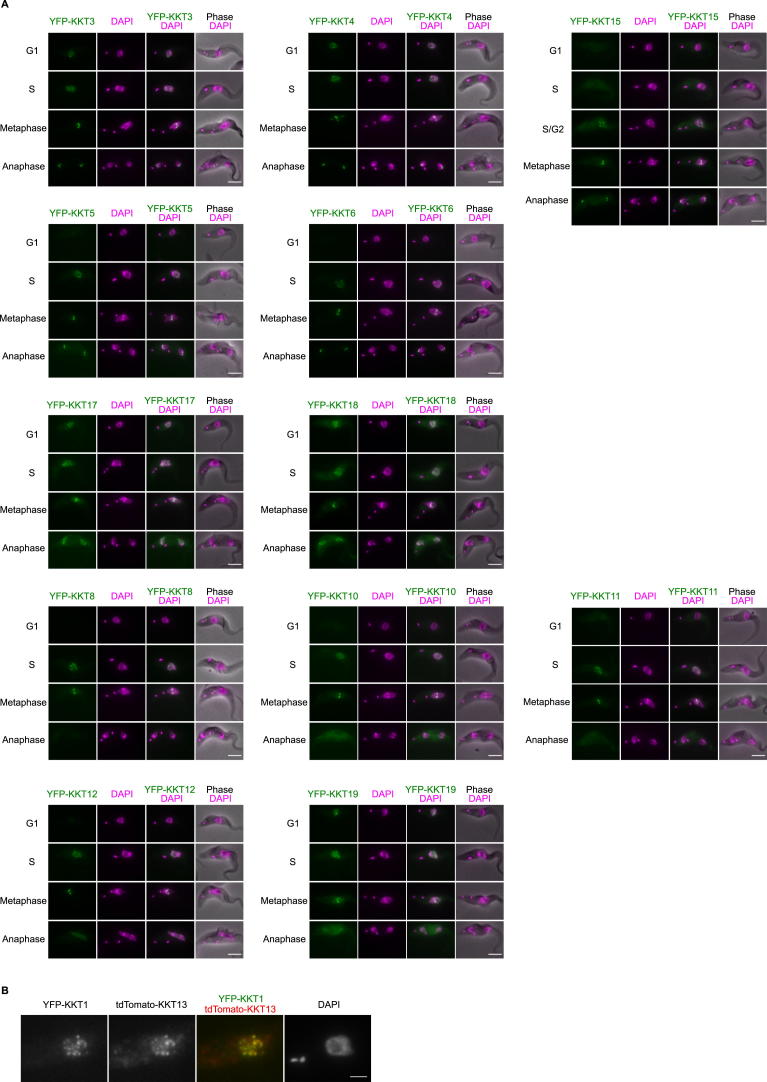
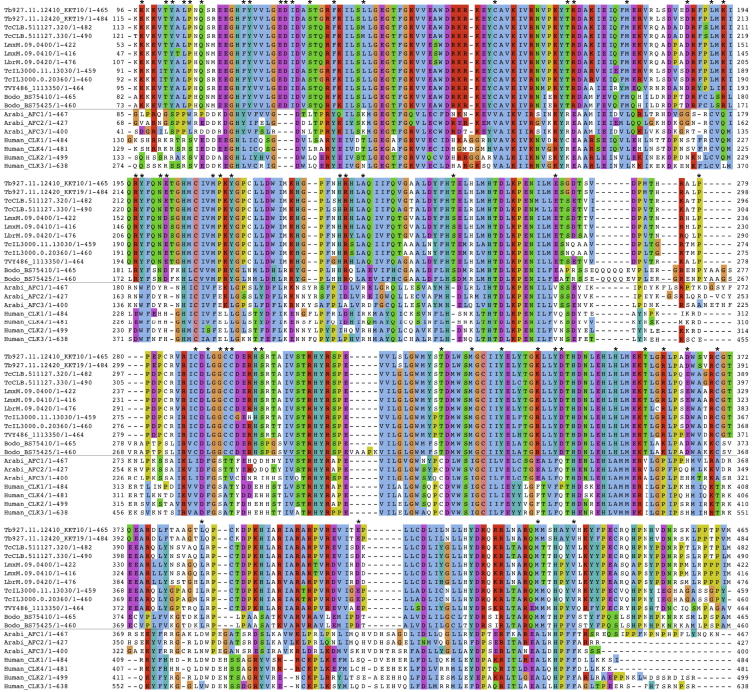
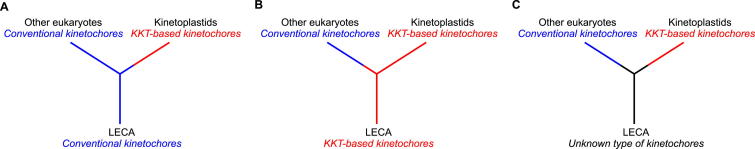
The kinetochore is the macromolecular protein complex that directs chromosome segregation in eukaryotes. It has been widely assumed that the core kinetochore consists of proteins that are common to all eukaryotes. However, no conventional kinetochore components have been identified in any kinetoplastid genome, thus challenging this assumption of universality. Here, we report the identification of 19 kinetochore proteins (KKT1-19) in Trypanosoma brucei. The majority is conserved among kinetoplastids, but none of them has detectable homology to conventional kinetochore proteins. These proteins instead have a variety of features not found in conventional kinetochore proteins. We propose that kinetoplastids build kinetochores using a distinct set of proteins. These findings provide important insights into the longstanding problem of the position of the root of the eukaryotic tree of life.


Figures

None
Graphical abstract
Figure 1
Figure 1
Identification of KKT1 (A) A wide field of view of procyclic form trypanosome cells expressing YFP-KKT1. Bar, 10 μm. (B) Examples of cells at indicated cell-cycle stages. K and N stand for the kinetoplast and nucleus, respectively. K denotes an elongated kinetoplast. Bar, 5 μm. See also Figure S1 and Tables S1 and S2.
Figure 2
Figure 2
KKT2 Is Enriched at Megabase Chromosome Centromeres (A) ChIP-seq data for YFP-KKT2. Top panels show chromosome-wide views of enrichment ratio, whereas bottom panels show a zoomed-in view of the centromeric region. Data for more megabase chromosomes and a model minichromosome, as well as our interpretation of several noncentromeric peaks, are shown in Figure S2. (B) ChIP-seq data for the YFP-H3v control. See also Figure S2 and Table S5.
Figure 3
Figure 3
KKTs Are Essential for Faithful Chromosome Segregation (A) Immunoblots against YFP-tagged KKT proteins show reduction upon RNAi induction with doxycycline. The PFR2 protein was used as a loading control. (B) RNAi-mediated knockdown of KKT proteins affects cell growth. Blue lines indicate noninduced controls, and dotted red lines indicate RNAi-induced cells. Note that the KKT10 RNAi construct also targets KKT19. (C) Examples of normal and abnormal cells stained with DAPI. Cells in “other” category show an abnormal number and/or shape of nuclear DNA. Zoid (1K0N) cells lack a nuclear DNA. Phase contrast images are shown in the left panels. (D) Quantification of cells with indicated DNA contents (n = 500 each). Data for (A)–(D) were collected from cells at 48 hr postinduction. (E) Examples of anaphase cells that express YFP-KKT2 with RNAi of indicated KKT proteins. (F) Quantification of anaphase cells with lagging kinetochores (n = 100 each). (G) Fluorescence in situ hybridization analysis of the chromosome 3 homologous pair. (H) Fluorescence in situ hybridization analysis of all minichromosomes. Data for (E)–(H) were collected from cells at 24 hr postinduction. Bars, 5 μm.
Figure 4
Figure 4
KKT Proteins Show Differential Localization Timings (A) Examples of cells expressing YFP-tagged KKT proteins. Bars, 5 μm. Data for other KKT proteins are shown in Figure S3. (B) Summary of localization patterns. See also Figure S3 and Table S3.
Figure 5
Figure 5
Domain Organization of T. brucei KKT Proteins (A) Schematic representation of T. brucei KKT proteins. Identified domains and motifs, as well as blocks that are highly conserved among kinetoplastids (given in parenthesis), are shown. Putative subcomplexes are grouped in dotted boxes. (B) Alignment of cysteine-rich domains of KKT2 and KKT3 from six kinetoplastid species (T. brucei, T. cruzi, T. vivax, L. mexicana, L braziliensis, and B. saltans). (C) DNA-binding motifs found in KKT2 and KKT3 proteins. See also Figures S4 and S5 and Table S4.
Figure S1
Figure S1
Affinity Purification of KKT Proteins, Related to Figure 1 YFP-tagged versions of indicated KKT proteins were purified using anti-GFP antibodies, eluted with detergent and analyzed by SDS-PAGE followed by immunoblots or Sypro-Ruby staining. “U” is a purification of an unrelated protein. Red dots indicate epitope-tagged proteins. Note that the amounts of purified proteins were often below the detection limit of Sypro-Ruby stain, yet they were identified by mass spectrometry (see Table S2).
Figure S2
Figure S2
More ChIP-Seq Data, Related to Figure 2 (A) ChIP-seq data of YFP-KKT2 for chromosomes 1–8 (data for chromosomes 1, 3 and 4 are taken from Figure 2A). Some of the non-centromeric peaks likely represent false-positive signals due to the presence of identical sequences within the centromeres. For example, the 1a peak (1,236,842–1,238,050, which is located in between two polycistronic transcription units) is likely false-positive due to the presence of an identical sequence in the centromere of chromosome 3 (1b: 892,214–893,422). Similarly, the 2a peaks found around some DIRE sequences may be caused by an identical sequence in the centromere of chromosome 3 (2b). (B) ChIP-seq data of YFP-KKT3 for chromosomes 1, 3 and 4. (C) ChIP-seq data of YFP-KKT2, YFP-KKT3 and YFP-H3v for a model minichromosome that mostly consists of 177 bp repeats. The background level for each protein is indicated by dotted lines.
Figure S3
Figure S3
KKT Proteins Show Differential Localization Timings, Related to Figure 4 (A) This figure contains localization data for YFP-tagged KKT proteins not shown in Figures 1 or 4. Note that KKT4 has spindle-like signals besides kinetochore dots during metaphase. Bars, 5 μm. (B) tdTomato-KKT13 co-localizes with YFP-KKT1, confirming that S-phase-specific KKT13 is indeed a kinetochore protein. Bar, 2 μm.
Figure S4
Figure S4
KKT10 and KKT19 Have Significant Differences from Other CLKs, Related to Figure 5 A multiple sequence alignment of kinetoplastid KKT10/KKT19 proteins with human and Arabidopsis CLKs is shown. Asterisks indicate residues that are well conserved among kinetoplastids but not in human or Arabidopsis.
Figure S5
Figure S5
Three Possible Models for the Evolutionary History of Kinetochores, Related to Figure 5 (A) The LECA (last eukaryotic common ancestor) had conventional kinetochores. In this scenario, kinetoplastids lost conventional kinetochores and evolved KKT-based kinetochores after they branched from other eukaryotic lineages. (B) The LECA had KKT-based kinetochores. In this scenario, only kinetoplastids retained them. (C) The LECA had a hitherto unknown type of kinetochores. Note that this is a highly simplified set of possibilities of how the diversity of kinetochore types may have arisen in evolution. The diagrams are presented as simple branch points and do not incorporate multiple other branch points leading to the diversity of other eukaryotic groups.

Comment in

References

    1. Akiyoshi B., Gull K. Evolutionary cell biology of chromosome segregation: insights from trypanosomes. Open Biol. 2013;3:130023. - PMC - PubMed
    1. Akiyoshi B., Sarangapani K.K., Powers A.F., Nelson C.R., Reichow S.L., Arellano-Santoyo H., Gonen T., Ranish J.A., Asbury C.L., Biggins S. Tension directly stabilizes reconstituted kinetochore-microtubule attachments. Nature. 2010;468:576–579. - PMC - PubMed
    1. Allen J.W.A., Ferguson S.J., Ginger M.L. Distinctive biochemistry in the trypanosome mitochondrial intermembrane space suggests a model for stepwise evolution of the MIA pathway for import of cysteine-rich proteins. FEBS Lett. 2008;582:2817–2825. - PubMed
    1. Altschul S.F., Madden T.L., Schäffer A.A., Zhang J., Zhang Z., Miller W., Lipman D.J. Gapped BLAST and PSI-BLAST: a new generation of protein database search programs. Nucleic Acids Res. 1997;25:3389–3402. - PMC - PubMed
    1. Aravind L., Landsman D. AT-hook motifs identified in a wide variety of DNA-binding proteins. Nucleic Acids Res. 1998;26:4413–4421. - PMC - PubMed

Supplemental References

    1. Cheeseman I.M., Chappie J.S., Wilson-Kubalek E.M., Desai A. The conserved KMN network constitutes the core microtubule-binding site of the kinetochore. Cell. 2006;127:983–997. - PubMed
    1. Dubin M., Fuchs J., Gräf R., Schubert I., Nellen W. Dynamics of a novel centromeric histone variant CenH3 reveals the evolutionary ancestral timing of centromere biogenesis. Nucleic Acids Res. 2010;38:7526–7537. - PMC - PubMed
    1. Marck C. ‘DNA Strider’: a ‘C’ program for the fast analysis of DNA and protein sequences on the Apple Macintosh family of computers. Nucleic Acids Res. 1988;16:1829–1836. - PMC - PubMed
    1. Redmond S., Vadivelu J., Field M.C. RNAit: an automated web-based tool for the selection of RNAi targets in Trypanosoma brucei. Mol. Biochem. Parasitol. 2003;128:115–118. - PubMed
    1. Schittenhelm R.B., Heeger S., Althoff F., Walter A., Heidmann S., Mechtler K., Lehner C.F. Spatial organization of a ubiquitous eukaryotic kinetochore protein network in Drosophila chromosomes. Chromosoma. 2007;116:385–402. - PMC - PubMed

Associated data