. 2014 Apr 22:129:64-72.
doi: 10.1016/j.physbeh.2014.02.047. Epub 2014 Feb 28.

Post-oral fat stimulation of intake and conditioned flavor preference in C57BL/6J mice: A concentration-response study

Affiliations

Post-oral fat stimulation of intake and conditioned flavor preference in C57BL/6J mice: A concentration-response study

Karen Ackroff et al. Physiol Behav. .

Abstract

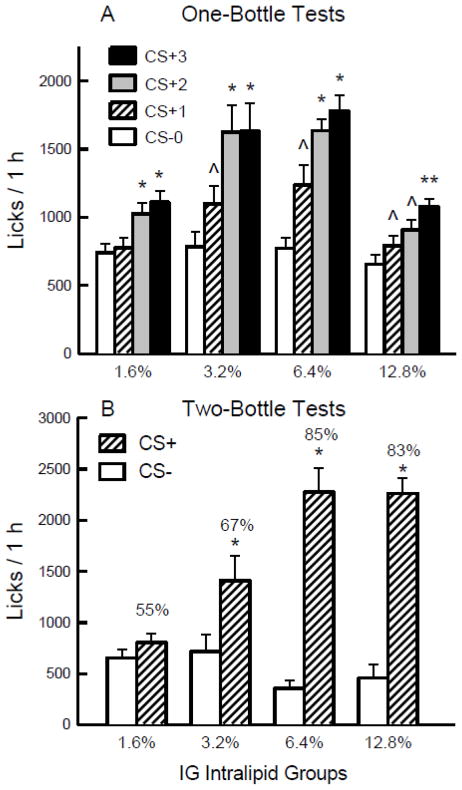
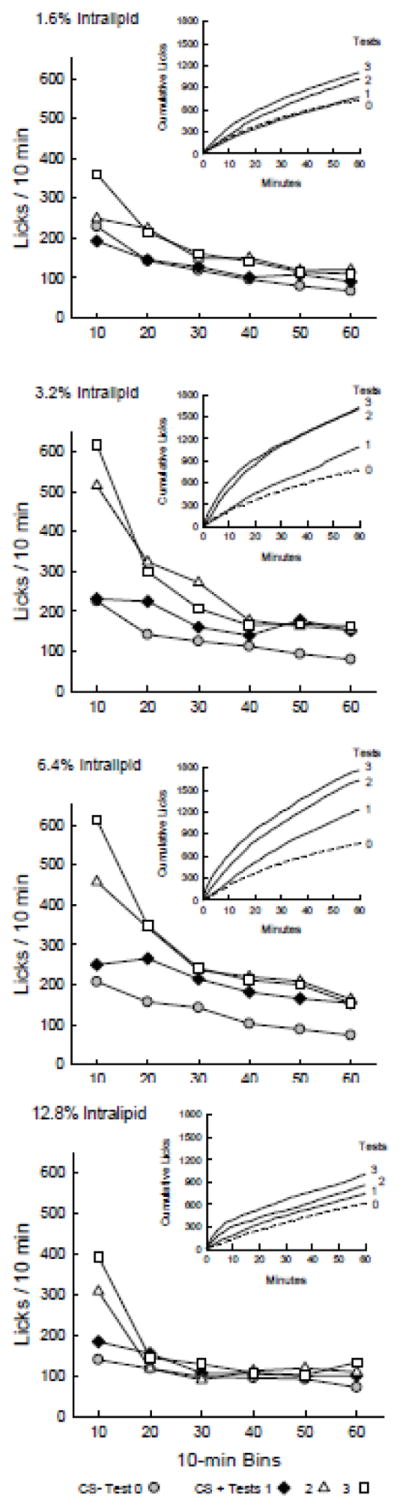
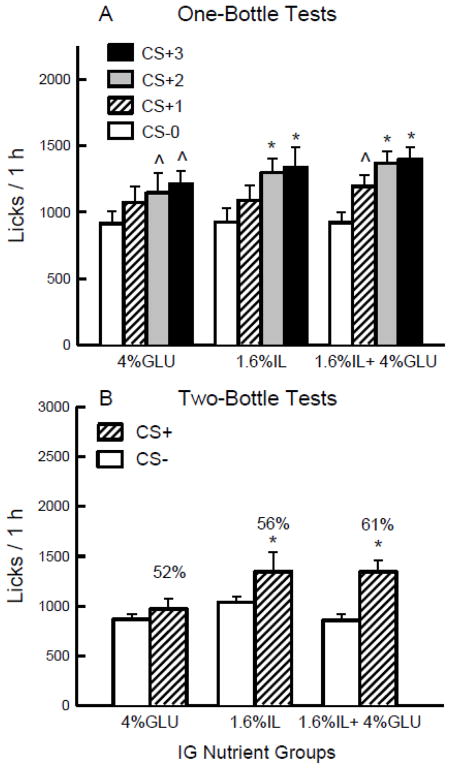
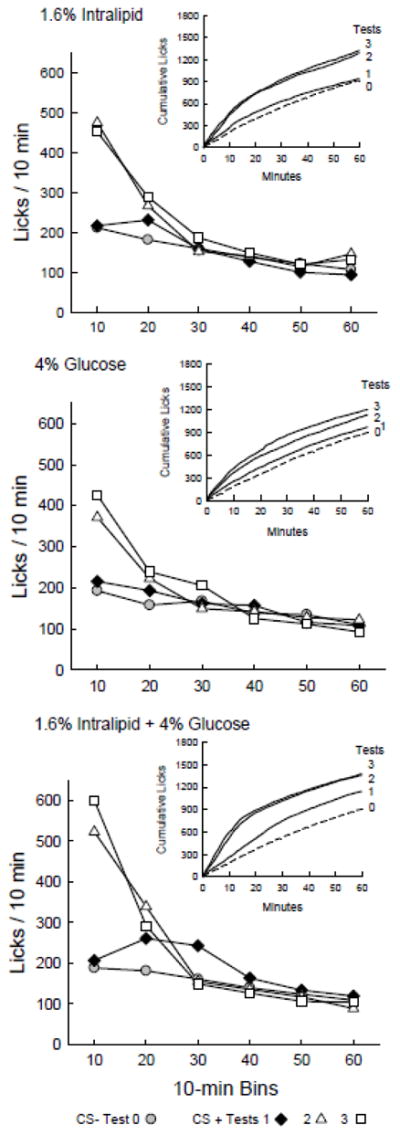
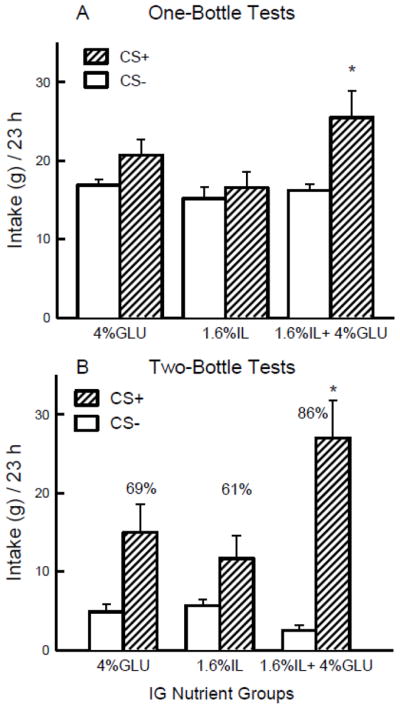
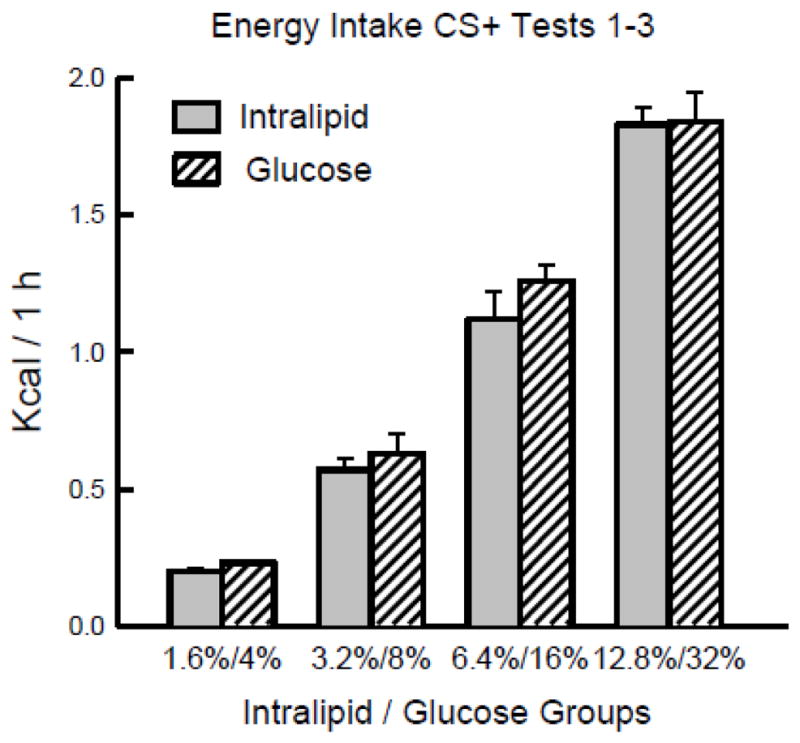
Fat appetite is determined not only by orosensory (flavor) stimuli but also by the post-oral actions of dietary fat, which promote increased attraction to the flavors of high-fat foods. Experiment 1 presents a concentration-response analysis of how intragastric (IG) fat self-infusions stimulate intake and condition flavor preferences in C57BL/6J mice trained 1h/day. Separate groups of food-restricted mice consumed a flavored saccharin solution (the CS-) paired with IG self-infusions of water (Test 0) followed by a different flavored solution (the CS+) paired with IG self-infusions of 1.6, 3.2, 6.4 or 12.8% Intralipid (IL, soybean oil) (Tests 1-3). Following additional CS- and CS+ training sessions, a two-bottle CS+ vs. CS- choice test was conducted without infusions. Infusions of 3.2-12.8% IL stimulated CS+ licking in the first test session and more so in subsequent test sessions, and also conditioned significant CS+ preferences. These effects were similar to those previously observed with isocaloric glucose infusions (8-32%). IG infusion of 1.6% IL stimulated intake slightly but did not condition a CS+ preference comparable to the actions of isocaloric 4% glucose. Experiment 2 compared these subthreshold IL and glucose concentrations with that of a 1.6% IL+4% glucose infusion. This mixture stimulated 1-h CS+ licking more rapidly but generated a preference similar to that of 1.6% IL. In 23h/day tests, however, the IL+glucose mixture stimulated greater CS+ intakes and preferences than did 1.6% IL or 4% glucose. These findings show that fat, like glucose, rapidly generates concentration-dependent post-oral signals that stimulate intake and enhance preferences for energy-rich foods in mice.

Keywords: Appetition; Glucose; Intragastric; Intralipid; Post-oral fat conditioning.


Figures

Figure 1
Figure 1
Experiment 1. A. Mean (+sem) 1-h total licks are plotted for one-bottle Tests 0–3. The mice drank (1 h/day) a CS− flavored saccharin solution paired with IG water self-infusions in Test 0 before being switched to a CS+ flavored saccharin solution paired with IG Intralipid self-infusions in Tests 1–3. The four IG groups were infused with 1.6%, 3.2%, 6.4% and 12.8% Intralipid. Significant differences (P < 0.05) between Test 0 vs. Test 1 licks are indicated by a carat, between Tests 0–1 and Tests 2–3 licks by an asterisk, and between Tests 0–2 and Test 3 licks by a double asterisk. B. Mean (+sem) 1-h total licks are plotted for CS+ and CS− flavored saccharin solutions during the two-bottle preference test for the 1.6% – 12.8% IG Intralipid groups. CS+ and CS− intakes were not paired with IG infusions during the test. Number atop bar represents mean percent preference for the CS+ solution. Significant differences (P < 0.05) between CS+ and CS− licks are indicated by an asterisk.
Figure 2
Figure 2
Experiment 1. Licks per 10-min bin are plotted for Test 0 with CS− flavored saccharin solution paired with IG water self-infusions, and for Tests 1 – 3 with CS+ flavored saccharin solution paired with IG Intralipid self-infusions. Graph insets plot cumulative lick curves for Tests 0–3. A. 1.6% IG Intralipid group. Analysis of the 10-min data revealed no differences in licks per bin between CS+ Tests 1–3 and CS− Test 0. B. 3.2% IG Intralipid group. The mice licked more (P < 0.05) for CS+ in bins 1–3 of Test 2 and bins 1–2 of Test 3 than in Test 0. C. 6.4% IG Intralipid group. The mice licked more (P < 0.05) for CS+ in bins 1–6 of Tests 2 and 3 than in Test 0. D. 12.8% Intralipid group. The mice licked more (P < 0.05) for CS+ in bin 1 of Test 2 and bins 1 and 6 of Test 3 than in Test 0.
Figure 3
Figure 3
Experiment 2A. A. Mean (+sem) 1-h total licks are plotted for one-bottle Tests 0–3. The mice drank (1 h/day) a CS− flavored saccharin solution paired with IG water self-infusions in Test 0 before being switched to a CS+ flavored saccharin solution paired with IG nutrient self-infusions in Tests 1–3. The three IG groups were infused with 4% glucose, 1.6% Intralipid, and 1.6% Intralipid + 4% glucose. B. Mean (+sem) 1-h total licks are plotted for CS+ and CS− flavored saccharin solutions during the two-bottle preference test for the 4% glucose, 1.6% Intralipid, and 1.6% Intralipid + 4% glucose IG groups. CS+ and CS− intakes were not paired with IG infusions during the test. Number atop bar represents mean percent preference for the CS+ solution. Significant differences (P < 0.05) between Test 0 vs. Tests 1–3 licks and between CS+ and CS− licks are indicated by an asterisk.
Figure 4
Figure 4
Experiment 2A. Licks per 10-min bin are plotted for Test 0 with CS− flavored saccharin solution paired with IG water self-infusions, and for Tests 1 – 3 with CS+ flavored saccharin solution paired with IG nutrient self-infusions. Graph insets plot cumulative lick curves for Tests 0–3. A. 4% IG Glucose group. The mice licked more (P < 0.05) for CS+ in bin 1 of Test 2 and bins 1–2 of Test 3 than in CS− Test 0. B. 1.6% IG Intralipid group. The mice licked more (P < 0.05) for CS+ in bins 1 and 2 of Tests 2 and 3 than in Test 0. C. 1.6% Intralipid + 4% Glucose group. The mice licked more (P < 0.05) for CS+ in bins 2 and 3 of Test 1, bins 1–2 of Test 2 and bins 1–3 of Test 3 than in Test 0.
Figure 5
Figure 5
Experiment 2B. A. Mean (+sem) 23-h total intakes (oral + infused) are plotted for one-bottle CS− and CS+ training. The mice drank (23 h/day) a CS− flavored saccharin solution paired with IG water self-infusions on odd-numbered days and a CS+ flavored saccharin solution paired with IG nutrient self-infusions on even-numbered days, for a total of 5 CS− and 5 CS+ days in two training cycles. The three IG groups were infused with 4% glucose, 1.6% Intralipid, and 1.6% Intralipid + 4% glucose. B. Mean (+sem) 23-h total intakes are plotted for CS+ and CS− flavored saccharin solutions during the second two-bottle preference test for the 4% glucose, 1.6% Intralipid, and 1.6% Intralipid + 4% glucose IG groups. CS+ and CS− intakes remained paired with IG self-infusions during the test. Number atop bar represents mean percent preference for the CS+ solution. Significant differences (P < 0.05) between CS+ and CS− licks are indicated by an asterisk.
Figure 6
Figure 6
Mean (+sem) 1-h total kcal from infusions on CS+ days 1–3 are plotted for the 1.6%, 3.2%, 6.4% and 12.8% Intralipid groups of Experiment 1, and for the isocaloric 4%, 8%, 16% and 32% glucose groups of a previous experiment [39].

References

    1. Ackroff K, Sclafani A. Flavor preferences conditioned by intragastric infusions of dilute Polycose solutions. Physiol Behav. 1994;55:957–62. - PubMed
    1. Ackroff K, Rozental D, Sclafani A. Ethanol-conditioned flavor preferences compared with sugar- and fat-conditioned preferences in rats. Physiol Behav. 2004;81:699–713. - PubMed
    1. Ackroff K, Lucas F, Sclafani A. Flavor preference conditioning as a function of fat source. Physiol Behav. 2005;85:448–60. - PubMed
    1. Ackroff K. Learned flavor preferences: the variable potency of post-oral nutrient reinforcers. Appetite. 2008;51:743–6. - PMC - PubMed
    1. Ackroff K, Dym C, Yiin Y-M, Sclafani A. Rapid acquisition of conditioned flavor preferences in rats. Physiol Behav. 2009;97:406–13. - PMC - PubMed

Publication types