. 2014 Mar 10;28(5):483-96.
doi: 10.1016/j.devcel.2014.01.021. Epub 2014 Feb 27.

EFCAB7 and IQCE regulate hedgehog signaling by tethering the EVC-EVC2 complex to the base of primary cilia

Affiliations

EFCAB7 and IQCE regulate hedgehog signaling by tethering the EVC-EVC2 complex to the base of primary cilia

Ganesh V Pusapati et al. Dev Cell. .

Abstract

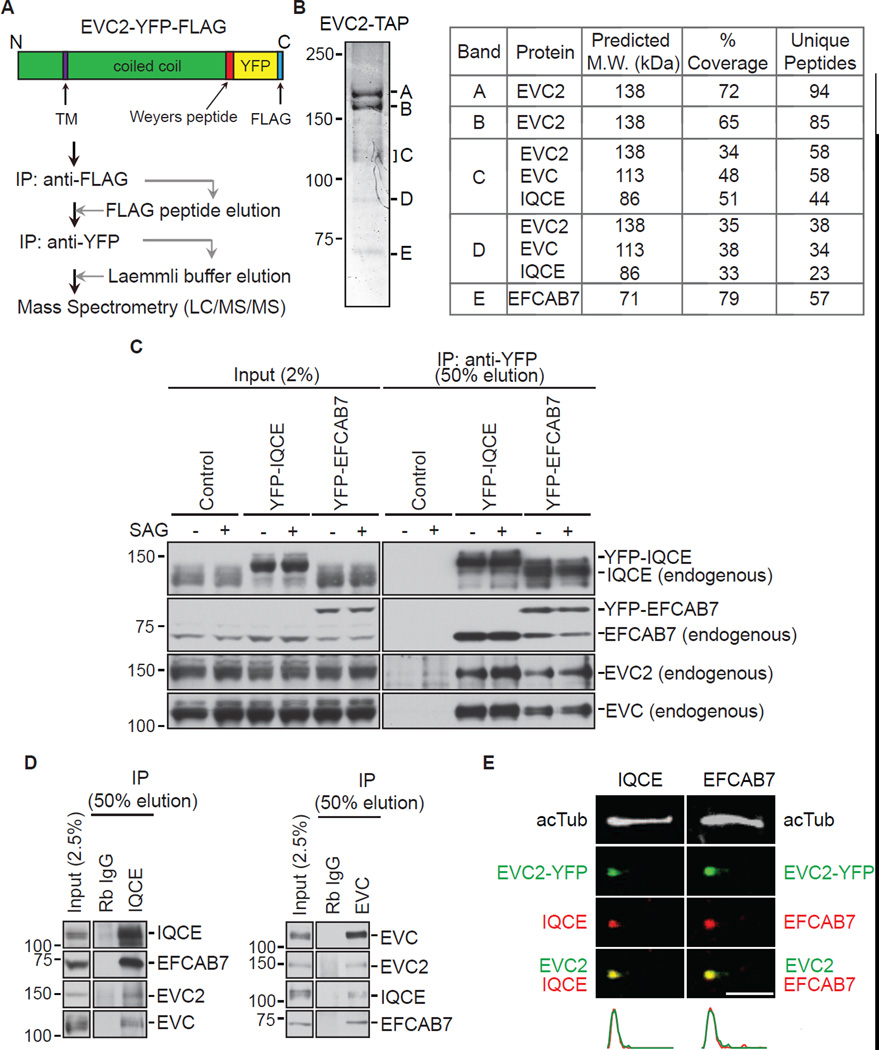
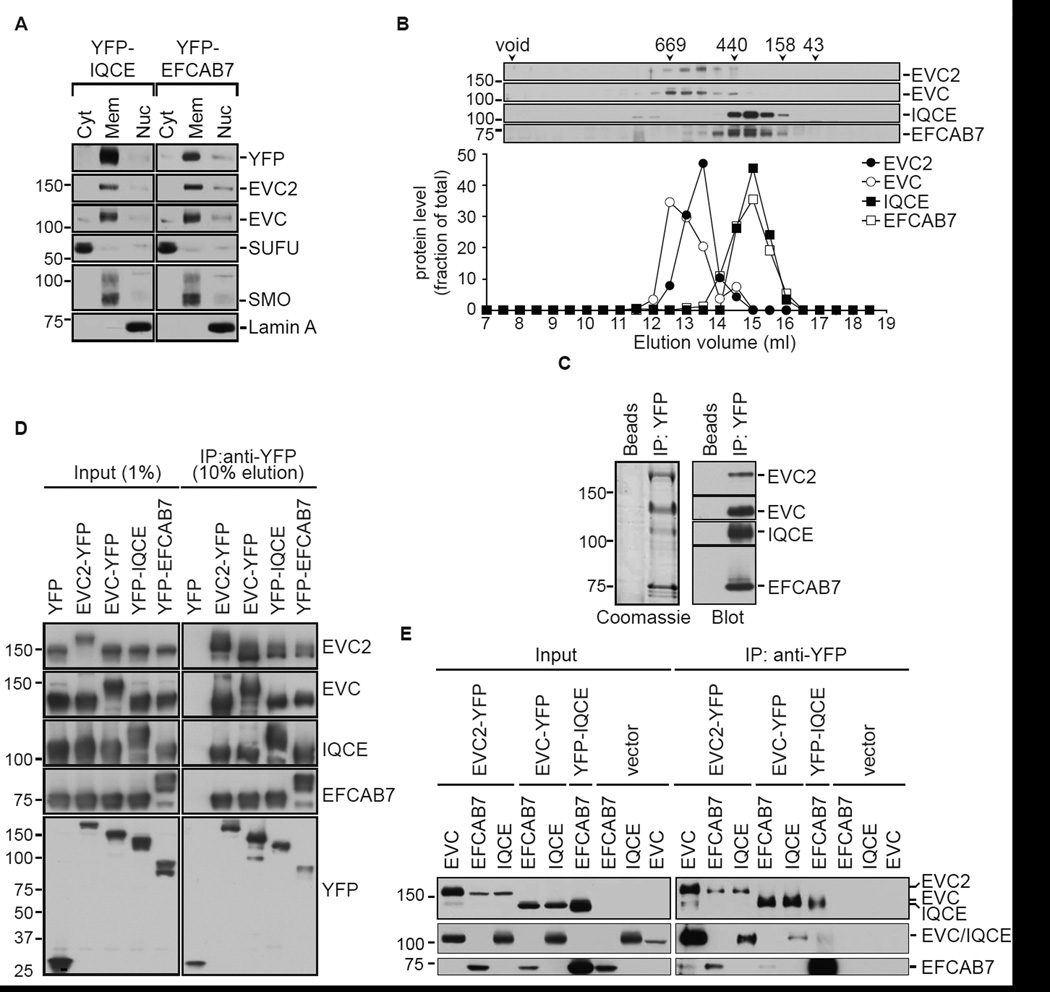
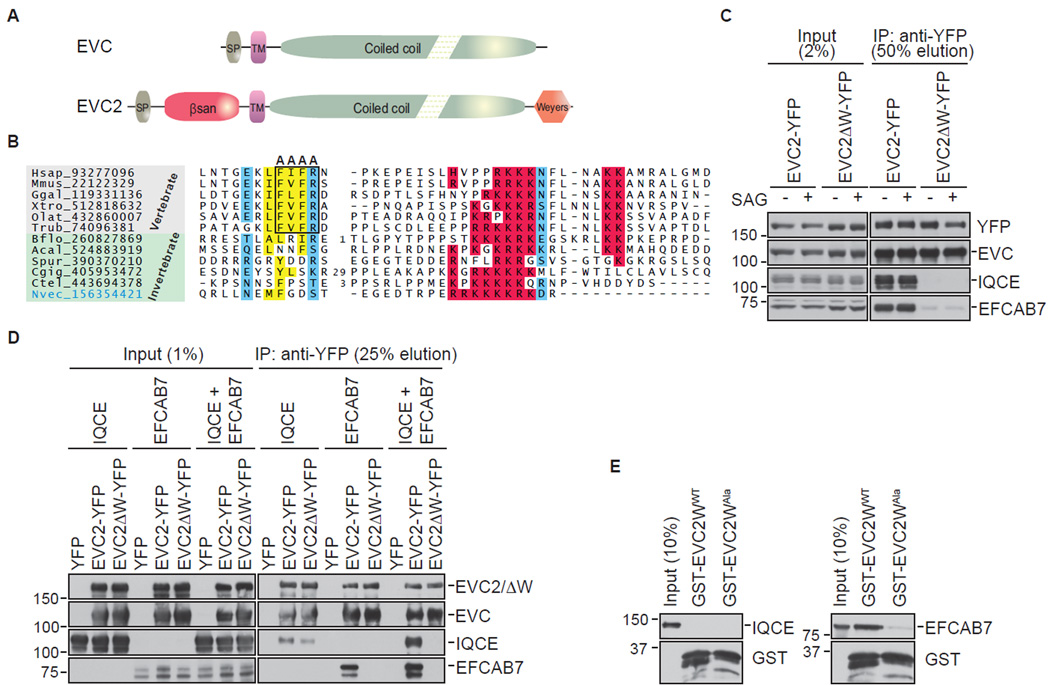
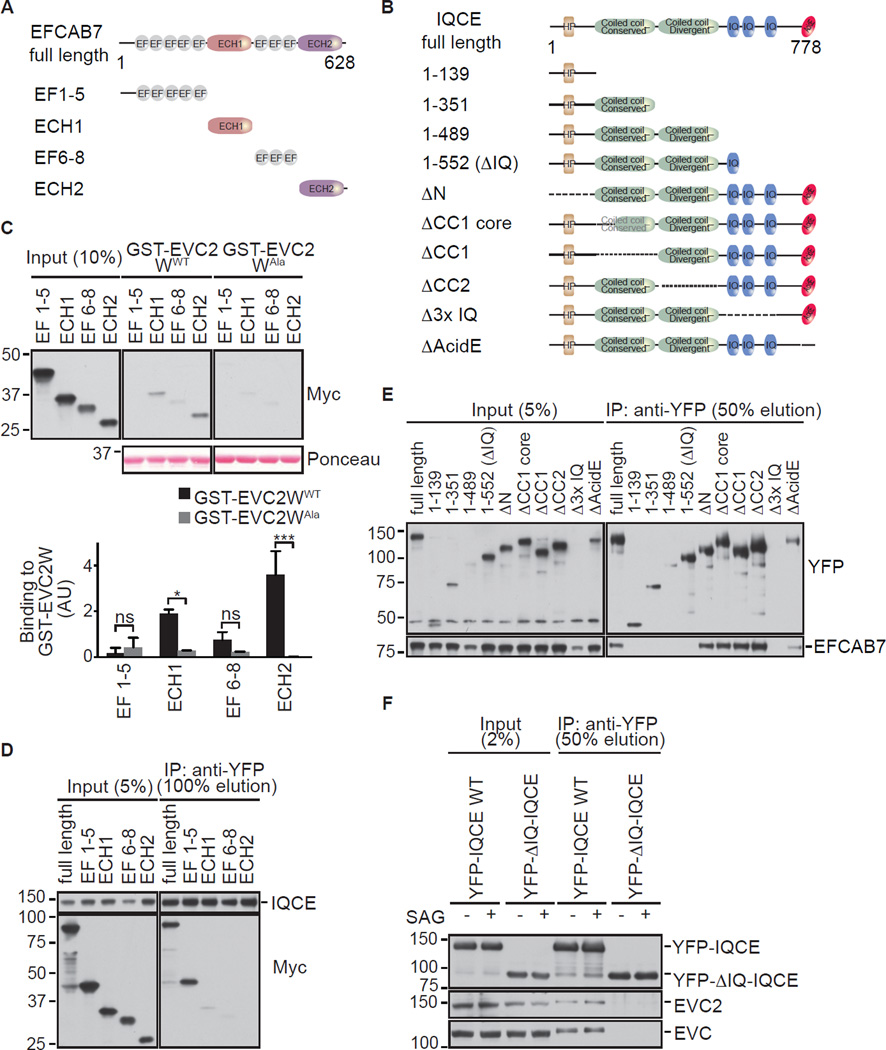
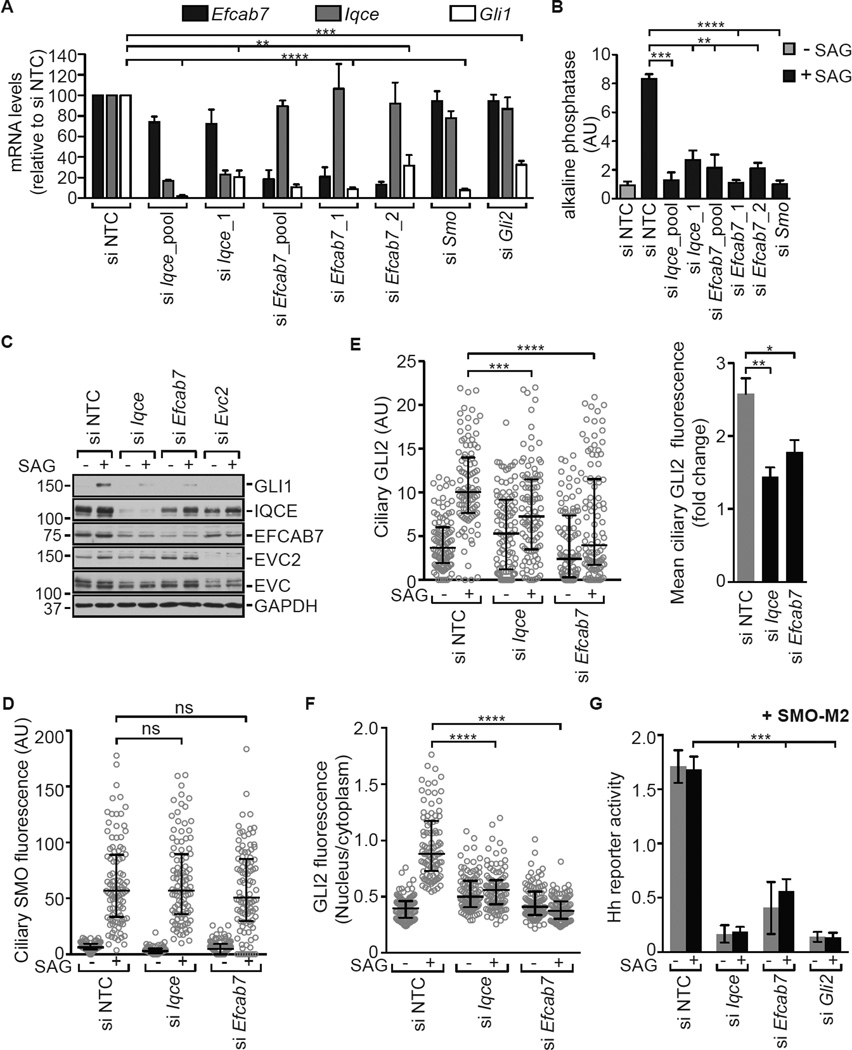
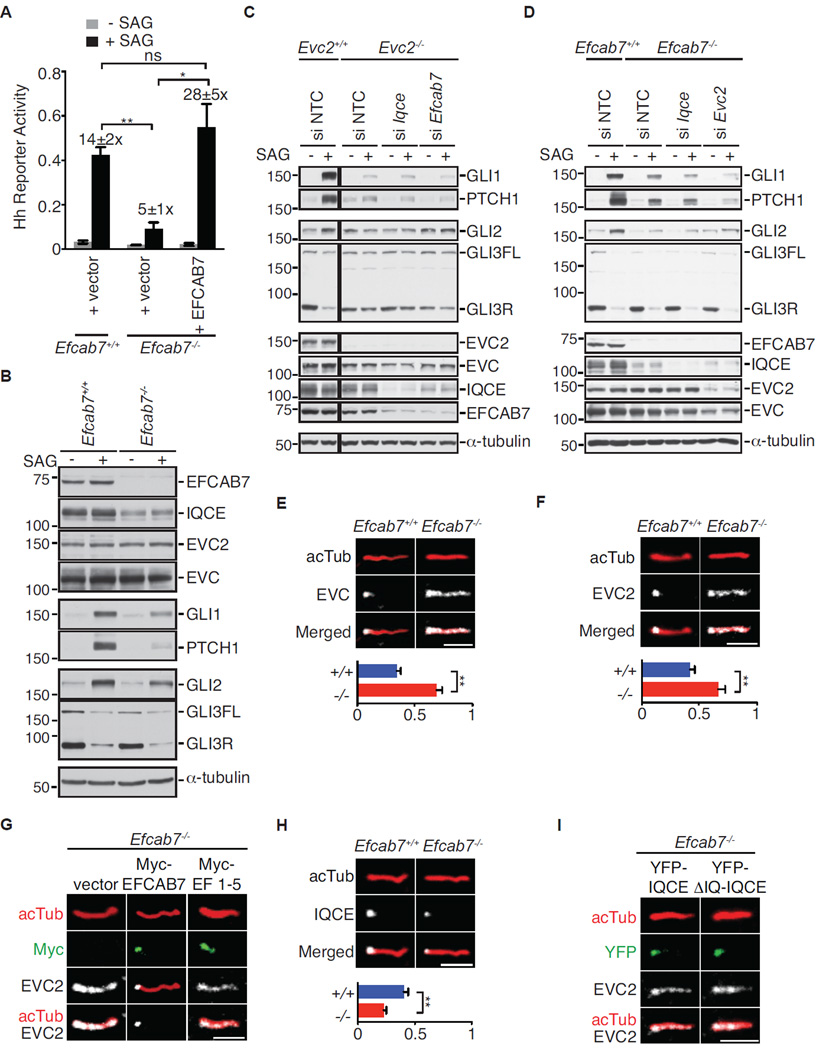
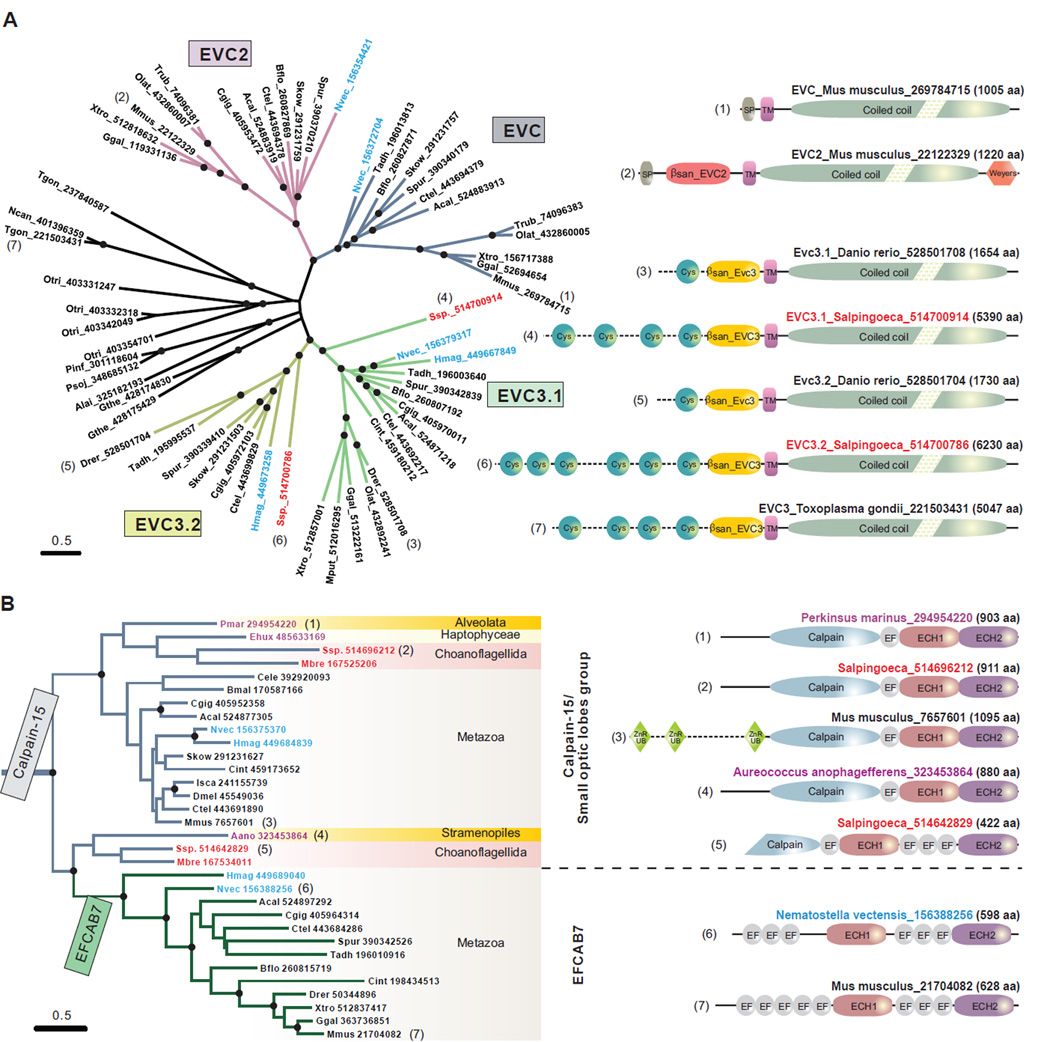
The Hedgehog (Hh) pathway depends on primary cilia in vertebrates, but the signaling machinery within cilia remains incompletely defined. We report the identification of a complex between two ciliary proteins, EFCAB7 and IQCE, which positively regulates the Hh pathway. The EFCAB7-IQCE module anchors the EVC-EVC2 complex in a signaling microdomain at the base of cilia. EVC and EVC2 genes are mutated in Ellis van Creveld and Weyers syndromes, characterized by impaired Hh signaling in skeletal, cardiac, and orofacial tissues. EFCAB7 binds to a C-terminal disordered region in EVC2 that is deleted in Weyers patients. EFCAB7 depletion mimics the Weyers cellular phenotype-the mislocalization of EVC-EVC2 within cilia and impaired activation of the transcription factor GLI2. Evolutionary analysis suggests that emergence of these complexes might have been important for adaptation of an ancient organelle, the cilium, for an animal-specific signaling network.


Figures

Figure 1
Figure 1. Identification of EVC2 binding proteins
(A) EVC2 binding partners were identified with a tandem affinity approach using NIH/3T3 cells stably expressing EVC2-YFP-FLAG. (B) A Coomassie-stained 8% SDS-PAGE gel (left) showing the five protein bands isolated after the procedure shown in (A). The proteins contained in each band were identified by mass spectrometry, as summarized in the table on the right. (C) Immunoblots showing endogenous EVC2 and EVC isolated on anti-YFP beads incubated with extracts of NIH/3T3 cells stably expressing YFP-IQCE, YFP-EFCAB7, or neither protein (control). Cells were treated with SAG (24 h) to activate Hh signaling or left untreated. (D) The four endogenous components of the EvC complex from NIH/3T3 extracts could be isolated on anti-IQCE beads (left) or anti-EVC beads (right). IPs using beads coated with Rabbit IgG (Rb IgG) served as a control. (E) Endogenous IQCE and EFCAB7 (red) co-localize with EVC2-YFP (green; anti-YFP) at the base of primary cilia labeled with the axonemal marker acetylated tubulin (white; acTub). Plots below the images indicate normalized fluorescent intensities for each of the channels along the cilium from base (left) to tip (right). Scale bars: 2 µm. See also Figure S1.
Figure 2
Figure 2. Architecture of the EvC complex
(A) Subcellular distribution of EvC complex components in NIH/3T3 cells stably expressing YFP-IQCE or YFP-EFCAB7. SUFU, SMO and Lamin A served as markers for the cytoplasmic (Cyt), membrane (Mem) and nuclear (Nuc) fractions, respectively. (B) Fractionation of endogenous EvC complex components on a Superose 6 gel-filtration column. The immunoblot (top) and graph (below) depict the amount protein found in each of the column fractions. The numbers above the immunoblots denote the molecular weights (in kDa) and peak elution positions of a set of standard proteins. (C) A Coomasie-stained gel (left) and immunoblot (right) shows isolation of an intact EvC complex on anti-YFP beads but not on control beads from extracts of 293T cells simultaneously transfected with constructs encoding YFP-tagged EVC2 along with EVC, IQCE and EFCAB7. (D) All four EvC complex subunits could be isolated from transfected 293T cells (see C) regardless of which subunit was used as the YFP-tagged bait. Above each lane, the subunit used as the YFP-tagged bait is denoted; the remaining three subunits were tagged with HA or FLAG. (E) Binary interactions between the four different subunits of the EvC complex were tested after transfecting the proteins in sets of two into 293T cells with YFP-tagged bait proteins and HA-tagged prey proteins. See also Figure S1.
Figure 3
Figure 3. The Weyers peptide of EVC2 links the EVC-EVC2 and EFCAB7-IQCE sub-complexes
(A) Domain composition of EVC and EVC2. Abbreviations: SP, signal peptide; TM, TM segment; βsan, β-sandwich domain; Weyers, Weyers peptide. (B) Multiple sequence alignment of the Weyers peptide in EVC2 with basic residues highlighted in red, hydrophobic residues in yellow, and polar residues in blue. The alanine mutations that lead to the delocalization and dominant-negative function of EVC2 are boxed. (C) Immunoblots showing the amount of endogenous EVC, IQCE, and EFCAB7 isolated on anti-YFP beads from NIH/3T3 cells stably expressing EVC2-YFP or EVC2ΔW-YFP and treated ± SAG (24 h). (D) Interaction between the EVC-EVC2 or the EVC-EVC2ΔW complex and IQCE alone, EFCAB7 alone or both IQCE and EFCAB7 together was assessed after transient transfections in 293T cells with YFP-tagged bait proteins and HA-tagged prey proteins; all transfections also included EVC. (E) Binding of in vitro translated, full-length IQCE or EFCAB7 to GST fused to the C-terminal 88 amino acids of EVC2 (GST-EVC2WWT) or a mutant fragment bearing alanine mutations in four conserved amino acids within the Weyers peptide (GST-EVC2WAla) shown in (B).
Figure 4
Figure 4. Mapping the interaction between EFCAB7 and IQCE
(A) and (B) Domain compositions of EFCAB7, IQCE and the fragments of each protein used for interaction studies. Abbreviations: EF, EF-hand domain; ECH, EFCAB7-Calpain Homology domain; HP, hydrophobic peptide; IQ, IQ calmodulin-binding motif; AcidE, acidic peptide. See sequence alignments in Figures S2 and S3. (C) An Immunoblot and graph (mean ± SD, n=2, one-way ANOVA with *=p<0.05 and ***=p<0.001) showing the amount of in vitro translated EFCAB7 fragments captured by the wild-type (WT) GST-Weyers peptide fusion or the Alanine (Ala) mutant (see Figure 3E). (D) Binding of Myc-tagged EFCAB7 fragments to YFP-tagged, full-length IQCE assessed by co-in vitro translation of both proteins followed by an anti-YFP IP. (E) Binding of YFP-tagged IQCE fragments to Myc-tagged, full-length EFCAB7 was assessed as in (D) with an anti-YFP IP. (F) Immunoblots showing the amount of endogenous EVC and EVC2 that co-precipitated with YFP-tagged full-length IQCE or a deletion mutant (1–522 or ΔIQ) from NIH/3T3 cells stably expressing each protein and treated ± SAG (24 h).
Figure 5
Figure 5. EFCAB7 and IQCE are positive regulators of the Hh signaling pathway
(A) Quantitative reverse-transcription PCR (qRT-PCR) was used to measure levels (mean ± SD, n=3, unpaired student’s t-test) of Iqce, Efcab7, and Gli1 transcripts in C3H10T1/2 cells transfected with a non-targeting control (NTC) siRNA or siRNAs against the indicated transcripts. All cells were treated with SAG (36 h) and Gli1 served as a metric for signaling. (B) The SAG-mediated differentiation (36 h) of C3H10T1/2 cells into osteoblasts was assayed by the increase in alkaline phosphatase activity (mean ± SD, n=3, unpaired student’s t-test) after siRNA-mediated depletion of IQCE, EFCAB7, or SMO. (C) Immunoblots showing the effect of IQCE, EFCAB7, and EVC2 depletion on GLI1 induction in NIH/3T3 cells after treatment with SAG (24 h). (D, E, F) Accumulation of endogenous SMO in cilia (D), GLI2 at the cilia tip (E), and GLI2 in the nucleus of NIH/3T3 cells (n=100) treated (4–6 h) with SAG. Each point represents a measurement from a single cell, black brackets depict median fluorescence and interquartile ranges, and the Kruskal-Wallis test is used to test significance. In (E), the right panel shows the fold-change in mean (± SD, n=4, Mann-Whitney test) GLI2 fluorescence at the cilia tip after treatment with SAG. (G) Activation of a Hh reporter (mean ± SD, n=3, unpaired student’s t-test) by the SMO-M2 mutant was assessed in NIH/3T3 cells after depletion of IQCE, EFCAB7 or GLI2. In all panels, statistical significance is depicted as follows: p<0.05 (*), p<0.01 (**), p<0.001 (***), p<0.0001 (****) and p>0.05 (not significant-ns). See also Figure S4.
Figure 6
Figure 6. EFCAB7 tethers the EVC-EVC2 complex at base of primary cilia
(A) SAG-induced (24 h) Hh reporter activity in wild-type NIH/3T3 cells, Efcab7−/− cells, and Efcab7−/− cells rescued with transient expression of YFP-EFCAB7. Numbers above the bars show the fold-induction in reporter activity seen after SAG treatment. Mean ± S.E.M. (n=3) reporter activity is depicted with significance tested using an unpaired student’s t-test; p<0.05 (*) and p<0.01 (**). (B) Immunoblots of extracts from Efcab7+/+ and Efcab7−/− cells treated ± SAG (24 h) were used to assess levels of the indicated EvC complex and Hh pathway components. α-tubulin served as the loading control, GLI1 and PTCH1 are Hh target genes, and GLI3FL and GLI3R point to the full-length GLI3 and its repressor fragment, respectively. (C, D) Immunoblots of extracts from Evc2−/− (C) and Efcab7−/− (D) cells further depleted of the indicated EvC complex components were used to assess levels of various proteins as in (B). (E, F) Localization of endogenous EVC and EVC2 (both in white) within individual cilia, identified by axonemal anti-acetylated tubulin staining (acTub, red). The graphs below show the fraction of acTub staining that co-localizes with EVC or EVC2 using a Mander’s coefficient. The mean (±SD, Mann-Whitney test with **=p<0.01) co-localization fraction was determined from 5 independent images, each containing ~50 cells each. (G) Localization of endogenous EVC2 in Efcab7−/− cells transfected with Myc-tagged full-length EFCAB7 or an EFCAB7 fragment (EF1–5) that cannot bind to EVC2 (see Figure 4C). (H) Localization of endogenous IQCE at the cilium in cells with or without EFCAB7; co-localization measurement below is depicted as in (E). (I) Localization of transiently transfected YFP-tagged, full-length IQCE or its ΔIQ truncation mutant (1–552 a.a; Figure 4B) in Efcab7−/− cells. Scale bars are 2 µm in all images. See also Figures S4 and S5.
Figure 7
Figure 7. Evolutionary analysis of EvC complex components
(A) Evolution and domain architectures of the EvC family proteins, EVC, EVC2, EVC3.1 and EVC3.2. An un-rooted phylogenetic tree is presented with nodes supported at 90% bootstrap shown with black circles. Each primary metazoan branch is highlighted in different color. The proteins are represented by their species abbreviations followed by their GenBank Identifiers (GIs). The basal animal species, Nematostella vectensis and Hydra magnipapillata, are highlighted in blue, while the sister clade of animals, Choanoflagellida, in red. Domain architectures are shown for selected proteins (right); the number next to each domain map is also used to mark that protein in the tree. (B) Origin of EFCAB7 from the Calpain-15 family and associated domain architecture changes. Basal animal species are highlighted in blue; the animal-sister clade, Choanoflagellida, in red; and basal eukaryotic species in purple. Domain abbreviations: SP, signal peptide; TM, transmembrane region; Weyers, Weyers peptide; Cys, Cys-rich motif; βsan_EVC2 and βsan_EVC3, the β-sandwich domains in the EVC2 and EVC3 subfamilies; Calpain, the papain-like peptidase domain; EF, EF-hand domain; ECH1 and ECH2, EFCAB7-Calpain Homology domains 1 and 2. Species abbreviations: Aano, Aureococcus anophagefferens; Acal, Aplysia californica; Alai, Albugo laibachii; Bflo, Branchiostoma floridae; Bmal, Brugia malayi; Cele, Caenorhabditis elegans; Cgig, Crassostrea gigas; Cint, Ciona intestinalis; Ctel, Capitella teleta; Dmel, Drosophila melanogaster; Drer, Danio rerio; Ehux, Emiliania huxleyi; Ggal, Gallus gallus; Gthe, Guillardia theta; Hmag, Hydra magnipapillata; Isca, Ixodes scapularis; Mbre, Monosiga brevicollis; Mmus, Mus musculus; Mput, Mustela putorius; Ncan, Neospora caninum; Nvec, Nematostella vectensis; Olat, Oryzias latipes; Otri, Oxytricha trifallax; Pinf, Phytophthora infestans; Pmar, Perkinsus marinus; Psoj, Phytophthora sojae; Skow, Saccoglossus kowalevskii; Spur, Strongylocentrotus purpuratus; Ssp., Salpingoeca sp.; Tadh, Trichoplax adhaerens; Tgon, Toxoplasma gondii; Trub, Takifugu rubripes; Xtro, Xenopus tropicalis.

Similar articles

Cited by

References

    1. Blair HJ, Tompson S, Liu YN, Campbell J, MacArthur K, Ponting CP, Ruiz-Perez VL, Goodship JA. Evc2 is a positive modulator of Hedgehog signalling that interacts with Evc at the cilia membrane and is also found in the nucleus. BMC Biol. 2011;9:14. - PMC - PubMed
    1. Caparros-Martin JA, Valencia M, Reytor E, Pacheco M, Fernandez M, Perez-Aytes A, Gean E, Lapunzina P, Peters H, Goodship JA, et al. The ciliary Evc/Evc2 complex interacts with Smo and controls Hedgehog pathway activity in chondrocytes by regulating Sufu/Gli3 dissociation and Gli3 trafficking in primary cilia. Hum Mol Genet. 2013;22:124–139. - PubMed
    1. Caspary T, Larkins CE, Anderson KV. The graded response to Sonic Hedgehog depends on cilia architecture. Dev Cell. 2007;12:767–778. - PubMed
    1. Cong L, Ran FA, Cox D, Lin S, Barretto R, Habib N, Hsu PD, Wu X, Jiang W, Marraffini LA, et al. Multiplex genome engineering using CRISPR/Cas systems. Science. 2013;339:819–823. - PMC - PubMed
    1. Corbit KC, Aanstad P, Singla V, Norman AR, Stainier DY, Reiter JF. Vertebrate Smoothened functions at the primary cilium. Nature. 2005;437:1018–1021. - PubMed

Publication types

MeSH terms