

MTOR-independent induction of autophagy in trabecular meshwork cells subjected to biaxial stretch
- PMID: 24583119
- PMCID: PMC3988584
- DOI: 10.1016/j.bbamcr.2014.02.010
MTOR-independent induction of autophagy in trabecular meshwork cells subjected to biaxial stretch
Abstract
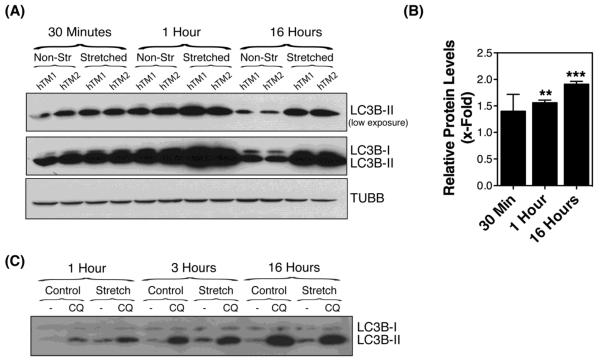
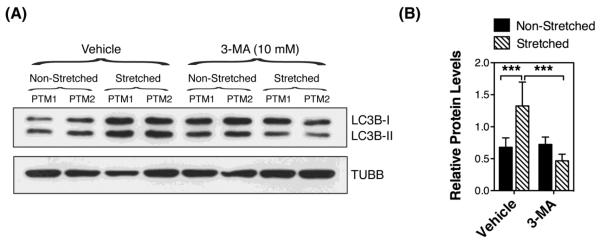
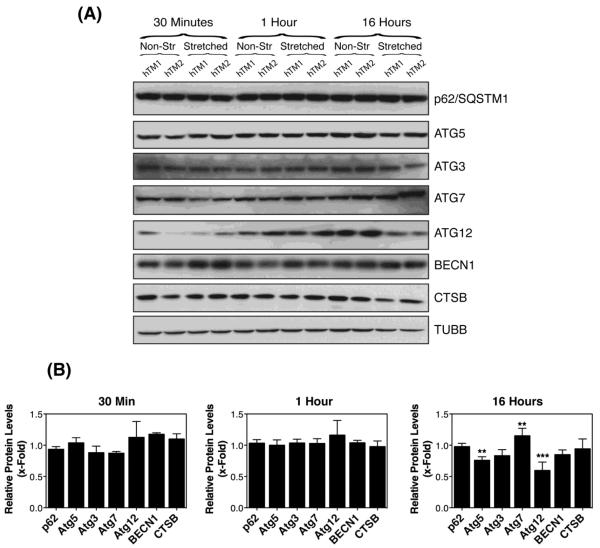
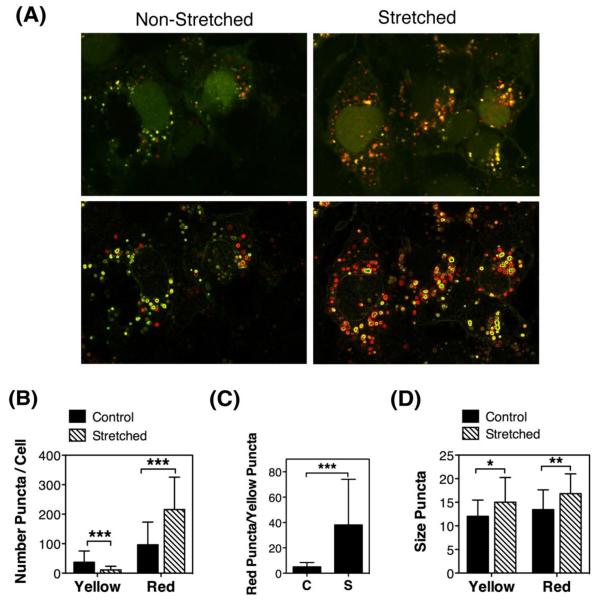
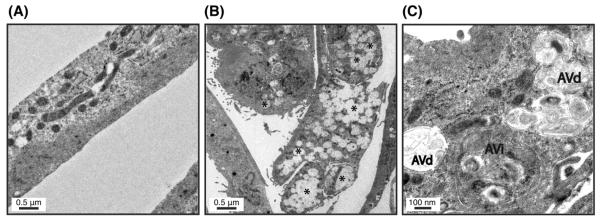
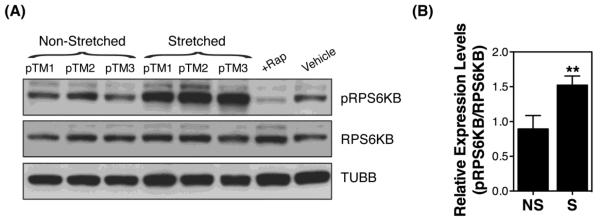
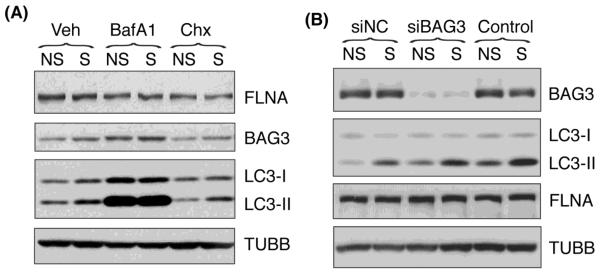
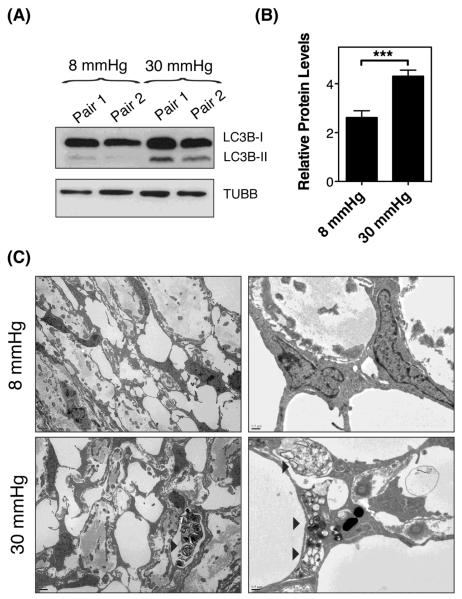
The trabecular meshwork (TM) is part of a complex tissue that controls the exit of aqueous humor from the anterior chamber of the eye, and therefore helps maintaining intraocular pressure (IOP). Because of variations in IOP with changing pressure gradients and fluid movement, the TM and its contained cells undergo morphological deformations, resulting in distention and stretching. It is therefore essential for TM cells to continuously detect and respond to these mechanical forces and adapt their physiology to maintain proper cellular function and protect against mechanical injury. Here we demonstrate the activation of autophagy, a pro-survival pathway responsible for the degradation of long-lived proteins and organelles, in TM cells when subjected to biaxial static stretch (20% elongation), as well as in high-pressure perfused eyes (30mmHg). Morphological and biochemical markers for autophagy found in the stretched cells include elevated LC3-II levels, increased autophagic flux, and the presence of autophagic figures in electron micrographs. Furthermore, our results indicate that the stretch-induced autophagy in TM cells occurs in an MTOR- and BAG3-independent manner. We hypothesize that activation of autophagy is part of the physiological response that allows TM cells to cope and adapt to mechanical forces.
Keywords: Autophagy; Chaperon-assisted autophagy; Glaucoma; MTOR pathway; Mechanical stress; Trabecular meshwork.
Copyright © 2014 Elsevier B.V. All rights reserved.
Figures
Similar articles
-
The autophagic protein LC3 translocates to the nucleus and localizes in the nucleolus associated to NUFIP1 in response to cyclic mechanical stress.Autophagy. 2020 Jul;16(7):1248-1261. doi: 10.1080/15548627.2019.1662584. Epub 2019 Sep 16. Autophagy. 2020. PMID: 31476975 Free PMC article.
-
Autophagy and mechanotransduction in outflow pathway cells.Exp Eye Res. 2017 May;158:146-153. doi: 10.1016/j.exer.2016.06.021. Epub 2016 Jun 29. Exp Eye Res. 2017. PMID: 27373974 Free PMC article. Review.
-
Lysosomal basification and decreased autophagic flux in oxidatively stressed trabecular meshwork cells: implications for glaucoma pathogenesis.Autophagy. 2013 Apr;9(4):581-94. doi: 10.4161/auto.23568. Epub 2013 Jan 29. Autophagy. 2013. PMID: 23360789 Free PMC article.
-
Primary cilia and the reciprocal activation of AKT and SMAD2/3 regulate stretch-induced autophagy in trabecular meshwork cells.Proc Natl Acad Sci U S A. 2021 Mar 30;118(13):e2021942118. doi: 10.1073/pnas.2021942118. Proc Natl Acad Sci U S A. 2021. PMID: 33753495 Free PMC article.
-
Pressure-induced expression changes in segmental flow regions of the human trabecular meshwork.Exp Eye Res. 2017 May;158:67-72. doi: 10.1016/j.exer.2016.06.009. Epub 2016 Jun 19. Exp Eye Res. 2017. PMID: 27334250 Free PMC article. Review.
Cited by
-
Protective Effects of Rapamycin on Trabecular Meshwork Cells in Glucocorticoid-Induced Glaucoma Mice.Front Pharmacol. 2020 Jul 2;11:1006. doi: 10.3389/fphar.2020.01006. eCollection 2020. Front Pharmacol. 2020. PMID: 32714192 Free PMC article.
-
Autophagy in glaucoma pathogenesis: Therapeutic potential and future perspectives.Front Cell Dev Biol. 2022 Dec 14;10:1068213. doi: 10.3389/fcell.2022.1068213. eCollection 2022. Front Cell Dev Biol. 2022. PMID: 36589756 Free PMC article. Review.
-
Fundamental Biomaterial Considerations in the Development of a 3D Model Representative of Primary Open Angle Glaucoma.Bioengineering (Basel). 2021 Oct 20;8(11):147. doi: 10.3390/bioengineering8110147. Bioengineering (Basel). 2021. PMID: 34821713 Free PMC article. Review.
-
Role of integrin‑linked kinase in static compressive stress‑induced autophagy via phosphatidylinositol 3 kinase in human periodontal ligament cells.Int J Mol Med. 2021 Sep;48(3):167. doi: 10.3892/ijmm.2021.5000. Epub 2021 Jul 19. Int J Mol Med. 2021. PMID: 34278436 Free PMC article.
-
Autophagy and Ciliogenesis.JMA J. 2021 Jul 15;4(3):207-215. doi: 10.31662/jmaj.2021-0090. Epub 2021 Jul 6. JMA J. 2021. PMID: 34414314 Free PMC article. Review.
References
-
- Grierson I, Lee WR. The fine structure of the trabecular meshwork at graded levels of intraocular pressure. (1) Pressure effects within the near-physiological range (8–30 mmHg) Exp Eye Res. 1975;20:505–521. - PubMed
-
- Johnstone MA, Grant WG. Pressure-dependent changes in structures of the aqueous outflow system of human and monkey eyes. Am J Ophthalmol. 1973;75:365–383. - PubMed
-
- Coleman DJ, Trokel S. Direct-recorded intraocular pressure variations in a human subject. Arch Ophthalmol. 1969;82:637–640. - PubMed
-
- Matsuo T, Uchida H, Matsuo N. Bovine and porcine trabecular cells produce prostaglandin F2 alpha in response to cyclic mechanical stretching. Jpn J Ophthalmol. 1996;40:289–296. - PubMed
Publication types
MeSH terms
Substances
Grants and funding
LinkOut - more resources
Full Text Sources
Other Literature Sources
Miscellaneous
