. 2014 Apr:53:60-77.
doi: 10.1016/j.cortex.2014.01.013. Epub 2014 Jan 31.

Seeing Jesus in toast: neural and behavioral correlates of face pareidolia

Affiliations

Seeing Jesus in toast: neural and behavioral correlates of face pareidolia

Jiangang Liu et al. Cortex. 2014 Apr.

Abstract

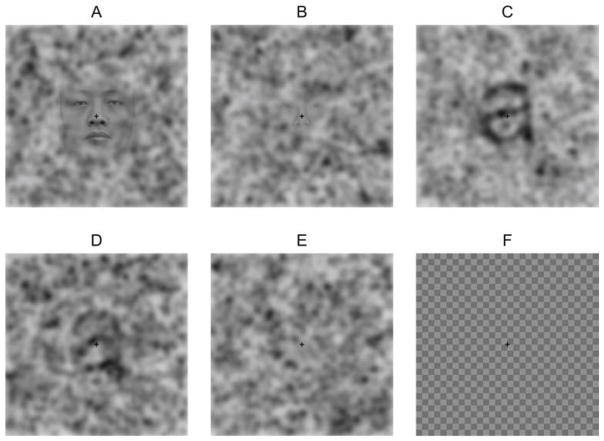
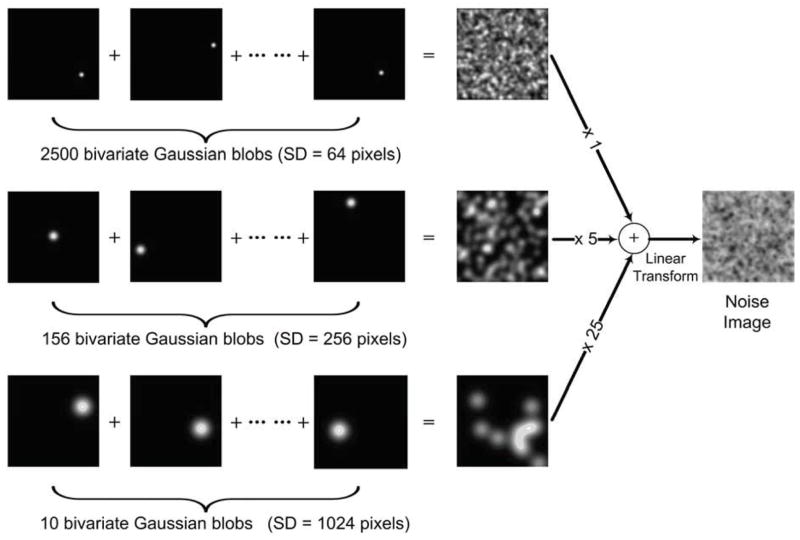
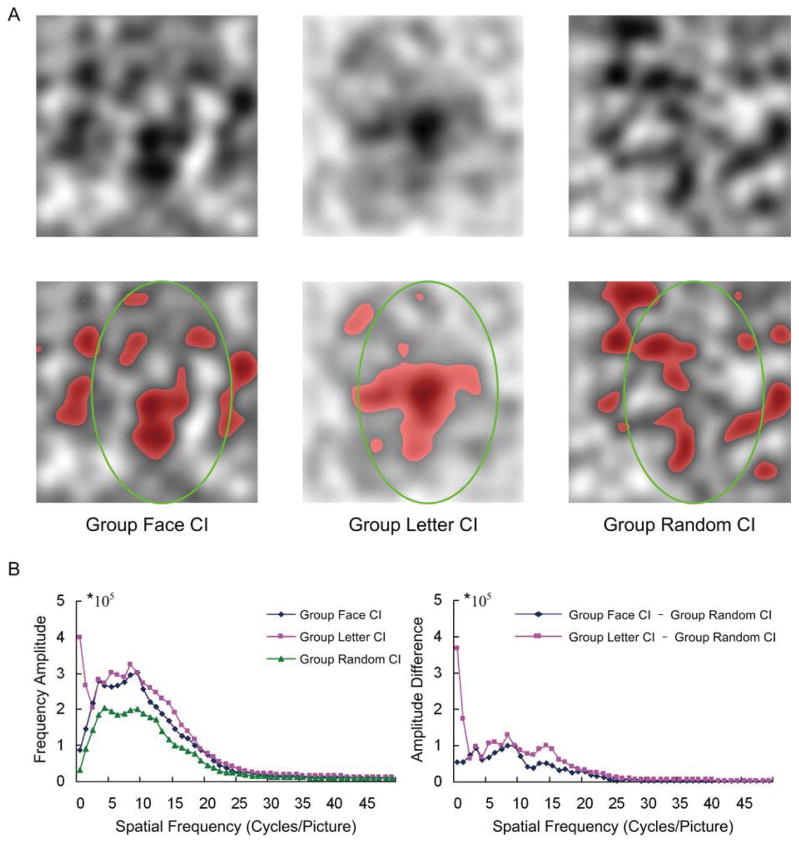
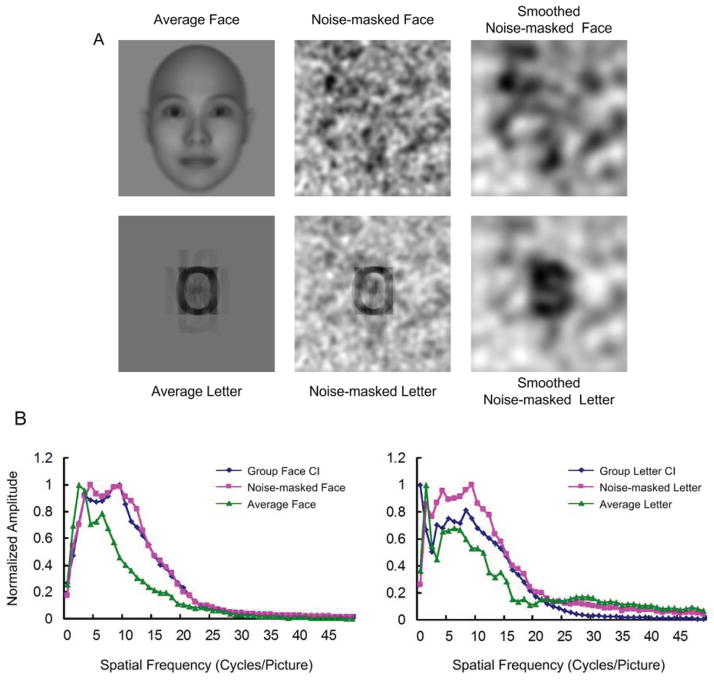
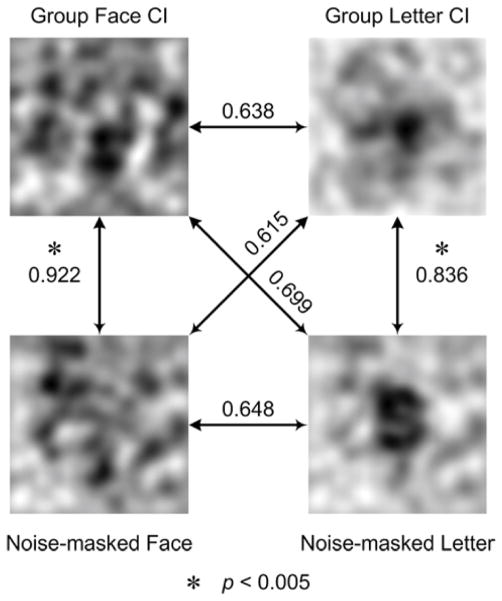
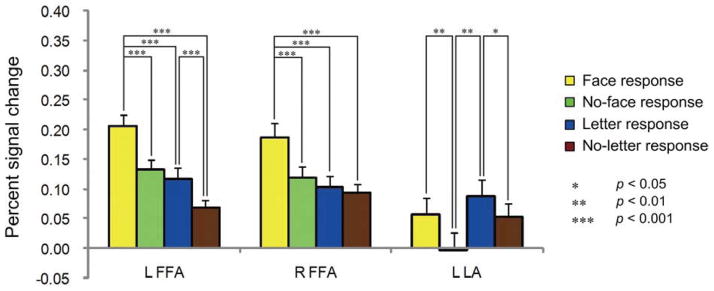
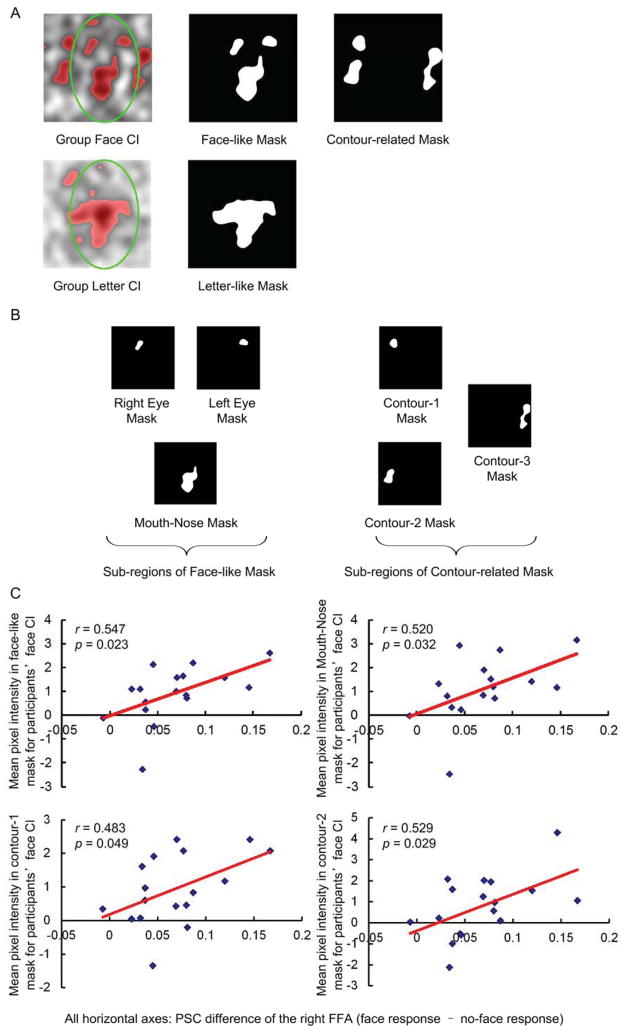
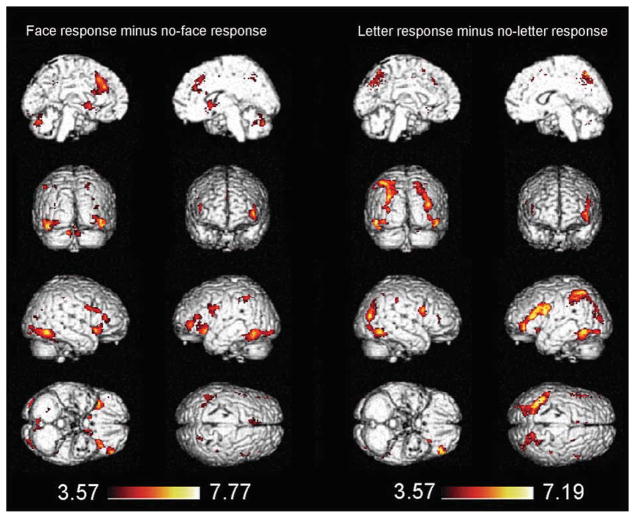
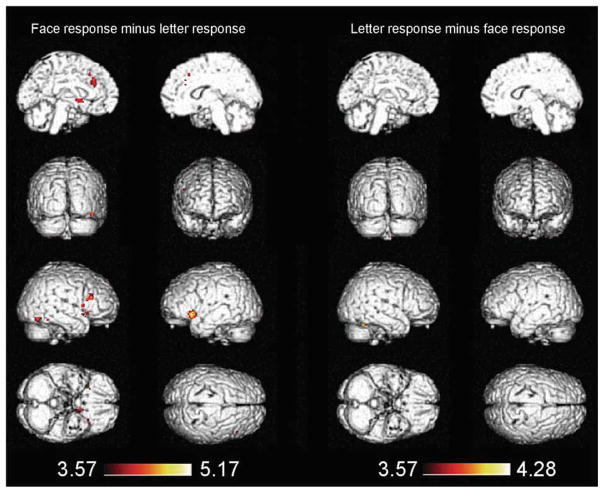
Face pareidolia is the illusory perception of non-existent faces. The present study, for the first time, contrasted behavioral and neural responses of face pareidolia with those of letter pareidolia to explore face-specific behavioral and neural responses during illusory face processing. Participants were shown pure-noise images but were led to believe that 50% of them contained either faces or letters; they reported seeing faces or letters illusorily 34% and 38% of the time, respectively. The right fusiform face area (rFFA) showed a specific response when participants "saw" faces as opposed to letters in the pure-noise images. Behavioral responses during face pareidolia produced a classification image (CI) that resembled a face, whereas those during letter pareidolia produced a CI that was letter-like. Further, the extent to which such behavioral CIs resembled faces was directly related to the level of face-specific activations in the rFFA. This finding suggests that the rFFA plays a specific role not only in processing of real faces but also in illusory face perception, perhaps serving to facilitate the interaction between bottom-up information from the primary visual cortex and top-down signals from the prefrontal cortex (PFC). Whole brain analyses revealed a network specialized in face pareidolia, including both the frontal and occipitotemporal regions. Our findings suggest that human face processing has a strong top-down component whereby sensory input with even the slightest suggestion of a face can result in the interpretation of a face.

Keywords: Face pareidolia; Face processing; Fusiform face area; Top-down processing; fMRI.


Figures

Figure 1
Figure 1
Examples of stimuli used in the experiment. (A) easy-to-detect face, (B) hard-to-detect face, (C) easy-to-detect letter, (D) hard-to-detect letter, (E) pure-noise image, (F) checkerboard image.
Figure 2
Figure 2
Illustration of production of the pure-noise images.
Figure 3
Figure 3
Illustration of the classification images (CI). (A) Top-row: the filtered group face CI (left), filtered group letter CI (middle), and filtered group random CI (right). The bottom-row: the significant regions within corresponding images in the top-row. These significant regions are shown in red. It should be noted that the intensity range of all the CIs have been extended to 0~255. (B) Left: The orientation-averaged 1D frequency amplitude spectrum for the group face CI (blue), group letter CI (red), and group random CI (green). The right: the difference in 1D frequency amplitude spectrum of the group face CI minus the group random CI (blue), and that of the group letter CI minus the group random CI (red).
Figure 4
Figure 4
Illustrations of a noise-masked face image and a noise-masked letter image, and their orientation-averaged 1D frequency amplitude spectrums. A) From left to right are: the average face image (top) and the average letter image (bottom); the noise-masked face image (top) and noise-masked letter image (bottom); the filtered noise-masked face image (top) and filtered noise-masked letter image (bottom). B) Left: The normalized 1D frequency amplitude spectrums of the group face CI (blue), noise-masked face image (red), and average face image (green). Right: The normalized 1D frequency amplitude spectrums of the group letter CI (blue), noise-masked letter image (red), and average letter image (green). It should be noted that the intensity range of all the images have been extended to 0~255 to improve clarity.
Figure 5
Figure 5
The results of the correlation analysis used to validate the specificity of face-like structure and letter-like structure in-group face CI and group letter CI, respectively. The numbers beside the arrowed lines are the correlation coefficients, which were calculated using 12 low-frequency components (i.e., 1~12 cycles/picture). The significant correlations are indicated by a star marker (ps < 0.005, corrected for 6 multi-comparisons, Bonferroni correction).
Figure 6
Figure 6
The results of ROI analyses. The y-axis indicates the percent signal change (PSC) and the error bar indicates the standard error of the mean BOLD signal across subjects.
Figure 7
Figure 7
The correlation between activity of the right FFA and the intensity of face CI. A) Top line: the group face CI (left), the extracted face-like mask (middle), and the extracted contour-related mask (right); Bottom line: the group letter CI (left) and the extracted letter-like mask (right). B) The sub-regions of extracted face-like mask (left) and the extracted contour-related mask (right). These regions are named according to their spatial relationship in the group face CI. C) The top-left: the correlation between the PSC difference of the face response minus the no-face response of the right FFA (horizontal axis) and the mean pixel intensity in face-like mask for participants’ face CI (vertical axis). The top-right: the correlation between the PSC difference for the face response minus the no-face response of the right FFA (horizontal axis) and the mean pixel intensity in Mouth-Nose mask for participants’ face CI (vertical axis). The bottom-left: the correlation between the PSC difference of the face response minus the no-face response of the right FFA (horizontal axis) and the mean pixel intensity in contour-1 mask for participants’ face CI (vertical axis). The bottom-right: the correlation between the PSC difference for the face response minus the no-face response of the right FFA (horizontal axis) and the mean pixel intensity in contour-2 mask for participants’ face CI (vertical axis).
Figure 8
Figure 8
Activation for face responses relative to no-face responses (left) and activation for letter responses relative to no-letter responses (right). The threshold was set at p < 0.001, uncorrected, k ≥ 12.
Figure 9
Figure 9
Activation for face responses relative to letter responses (left) and activation for the reverse contrast (right). The activated regions for face response minus letter response were masked by contrast of face response minus no-face response. The activated regions for letter response minus face response were masked by contrast of letter response minus no-letter response. The threshold was set at p < 0.001, uncorrected, k ≥ 12.

References

    1. Beck DM, Kastner S. Top-down and bottom-up mechanisms in biasing competition in the human brain. Vision Research. 2009;49(10):1154–1165. - PMC - PubMed
    1. Brett M, Anton J, Valabregue R, Poline J. Region of interest analysis using an SPM toolbox [abstract]. The 8th International Conference on Functional Mapping of the Human Brain; Sendai, Japan. 2002. Available on CD-ROM in NeuroImage.
    1. Chauvin A, Worsley KJ, Schyns PG, Arguin M, Gosselin F. Accurate statistical tests for smooth classification images. Journal of Vision. 2005;5(9):659–667. - PubMed
    1. Curtis CE, D’Esposito M. Persistent activity in the prefrontal cortex during working memory. Trends in Cognitive Sciences. 2003;7(9):415–423. - PubMed
    1. Devue C, Collette F, Balteau E, Degueldre C, Luxen A, Maquet P, et al. Here I am: The cortical correlates of visual self-recognition. Brain Research. 2007;1143:169–182. - PubMed

Publication types