

GLUT1 deficiency in cardiomyocytes does not accelerate the transition from compensated hypertrophy to heart failure
- PMID: 24583251
- PMCID: PMC4037364
- DOI: 10.1016/j.yjmcc.2014.02.011
GLUT1 deficiency in cardiomyocytes does not accelerate the transition from compensated hypertrophy to heart failure
Abstract
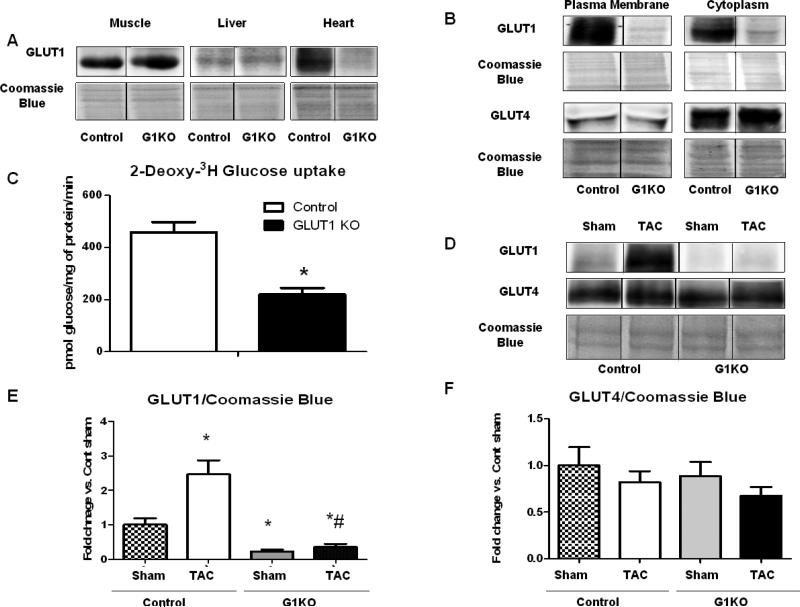
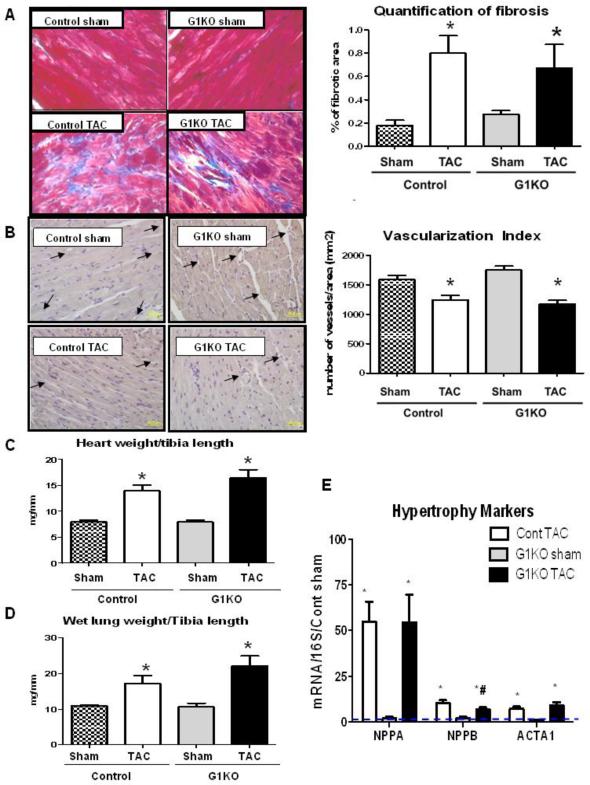
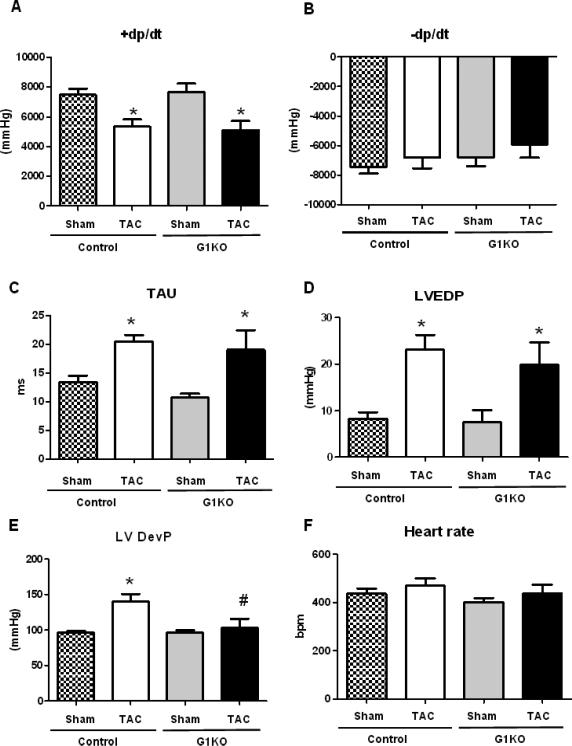
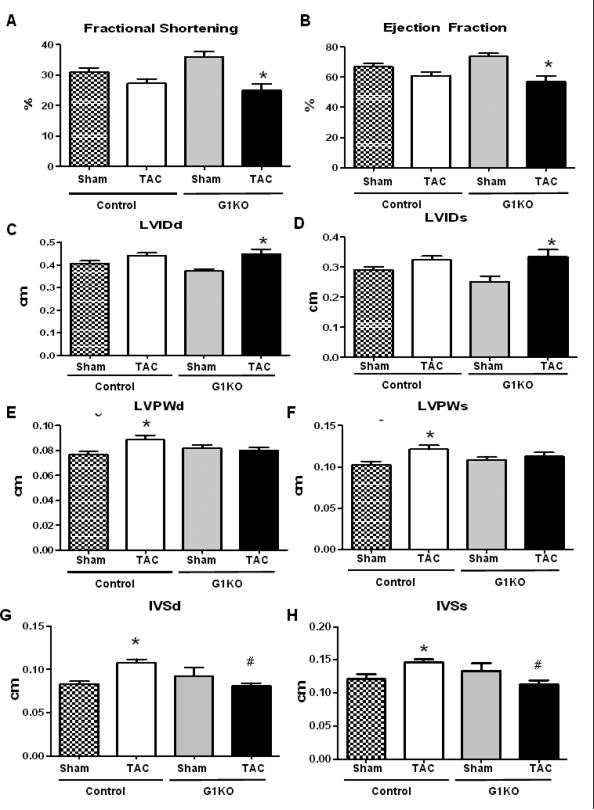
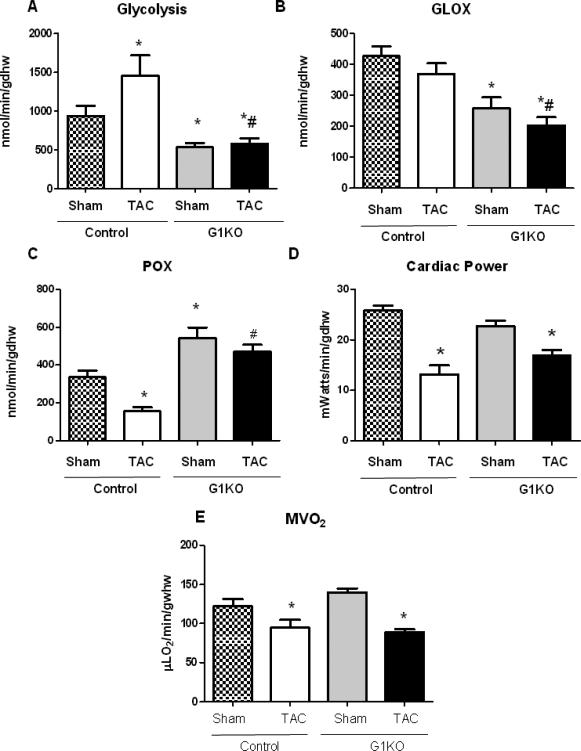
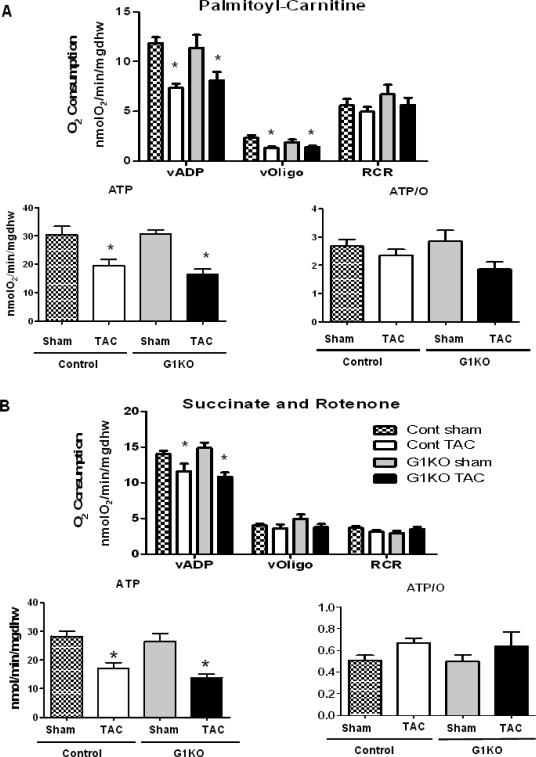
The aim of this study was to determine whether endogenous GLUT1 induction and the increased glucose utilization that accompanies pressure overload hypertrophy (POH) are required to maintain cardiac function during hemodynamic stress, and to test the hypothesis that lack of GLUT1 will accelerate the transition to heart failure. To determine the contribution of endogenous GLUT1 to the cardiac adaptation to POH, male mice with cardiomyocyte-restricted deletion of the GLUT1 gene (G1KO) and their littermate controls (Cont) were subjected to transverse aortic constriction (TAC). GLUT1 deficiency reduced glycolysis and glucose oxidation by 50%, which was associated with a reciprocal increase in fatty acid oxidation (FAO) relative to controls. Four weeks after TAC, glycolysis increased and FAO decreased by 50% in controls, but were unchanged in G1KO hearts relative to shams. G1KO and controls exhibited equivalent degrees of cardiac hypertrophy, fibrosis, and capillary density loss after TAC. Following TAC, in vivo left ventricular developed pressure was decreased in G1KO hearts relative to controls, but+dP/dt was equivalently reduced in Cont and G1KO mice. Mitochondrial function was equivalently impaired following TAC in both Cont and G1KO hearts. GLUT1 deficiency in cardiomyocytes alters myocardial substrate utilization, but does not substantially exacerbate pressure-overload induced contractile dysfunction or accelerate the progression to heart failure.
Keywords: Cardiac hypertrophy; Cardiac metabolism; Glucose transport.
Copyright © 2014 Elsevier Ltd. All rights reserved.
Figures
Similar articles
-
PGC-1β deficiency accelerates the transition to heart failure in pressure overload hypertrophy.Circ Res. 2011 Sep 16;109(7):783-93. doi: 10.1161/CIRCRESAHA.111.243964. Epub 2011 Jul 28. Circ Res. 2011. PMID: 21799152 Free PMC article.
-
Inducible overexpression of GLUT1 prevents mitochondrial dysfunction and attenuates structural remodeling in pressure overload but does not prevent left ventricular dysfunction.J Am Heart Assoc. 2013 Sep 19;2(5):e000301. doi: 10.1161/JAHA.113.000301. J Am Heart Assoc. 2013. PMID: 24052497 Free PMC article.
-
USP20 deletion promotes eccentric cardiac remodeling in response to pressure overload and increases mortality.Am J Physiol Heart Circ Physiol. 2024 Nov 1;327(5):H1257-H1271. doi: 10.1152/ajpheart.00329.2024. Epub 2024 Oct 4. Am J Physiol Heart Circ Physiol. 2024. PMID: 39365672
-
Mitochondrial Structure and Function in Human Heart Failure.Circ Res. 2024 Jul 5;135(2):372-396. doi: 10.1161/CIRCRESAHA.124.323800. Epub 2024 Jul 4. Circ Res. 2024. PMID: 38963864 Free PMC article. Review.
-
Matrix revisited: mechanisms linking energy substrate metabolism to the function of the heart.Circ Res. 2014 Feb 14;114(4):717-29. doi: 10.1161/CIRCRESAHA.114.301863. Circ Res. 2014. PMID: 24526677 Free PMC article. Review.
Cited by
-
Cardiac lipid metabolism, mitochondrial function, and heart failure.Cardiovasc Res. 2023 Aug 19;119(10):1905-1914. doi: 10.1093/cvr/cvad100. Cardiovasc Res. 2023. PMID: 37392421 Free PMC article. Review.
-
Oncometabolism: A Paradigm for the Metabolic Remodeling of the Failing Heart.Int J Mol Sci. 2022 Nov 11;23(22):13902. doi: 10.3390/ijms232213902. Int J Mol Sci. 2022. PMID: 36430377 Free PMC article. Review.
-
Cardiac Energy Metabolism in Heart Failure.Circ Res. 2021 May 14;128(10):1487-1513. doi: 10.1161/CIRCRESAHA.121.318241. Epub 2021 May 13. Circ Res. 2021. PMID: 33983836 Free PMC article. Review.
-
Mitochondrial dysfunction and its impact on diabetic heart.Biochim Biophys Acta Mol Basis Dis. 2017 May;1863(5):1098-1105. doi: 10.1016/j.bbadis.2016.08.021. Epub 2016 Sep 1. Biochim Biophys Acta Mol Basis Dis. 2017. PMID: 27593695 Free PMC article.
-
Metabolic Coordination of Physiological and Pathological Cardiac Remodeling.Circ Res. 2018 Jun 22;123(1):107-128. doi: 10.1161/CIRCRESAHA.118.312017. Circ Res. 2018. PMID: 29929976 Free PMC article. Review.
References
-
- Taegtmeyer H. Energy metabolism of the heart: from basic concepts to clinical applications. Curr Probl Cardiol. 1994;19:59–113. - PubMed
-
- Nascimben L, Friedrich J, Liao R, Pauletto P, Pessina AC, Ingwall JS. Enalapril treatment increases cardiac performance and energy reserve via the creatine kinase reaction in myocardium of Syrian myopathic hamsters with advanced heart failure. Circulation. 1995;91:1824–33. - PubMed
-
- Abel ED. Glucose transport in the heart. Frontiers in bioscience : a journal and virtual library. 2004;9:201–15. - PubMed
-
- Morissette MR, Howes AL, Zhang T, Heller Brown J. Upregulation of GLUT1 expression is necessary for hypertrophy and survival of neonatal rat cardiomyocytes. Journal of molecular and cellular cardiology. 2003;35:1217–27. - PubMed
-
- Pereira RO, Wende AR, Olsen C, Soto J, Rawlings T, Zhu Y, et al. Inducible overexpression of GLUT1 prevents mitochondrial dysfunction and attenuates structural remodeling in pressure overload but does not prevent left ventricular dysfunction. Journal of the American Heart Association. 2013;2:e000301. - PMC - PubMed
Publication types
MeSH terms
Substances
Grants and funding
LinkOut - more resources
Full Text Sources
Other Literature Sources
Medical
Miscellaneous
