. 2014 Jul;21(7):1081-94.
doi: 10.1038/cdd.2014.27. Epub 2014 Feb 28.

Notch1 regulates progenitor cell proliferation and differentiation during mouse yolk sac hematopoiesis

Affiliations

Notch1 regulates progenitor cell proliferation and differentiation during mouse yolk sac hematopoiesis

I Cortegano et al. Cell Death Differ. 2014 Jul.

Abstract

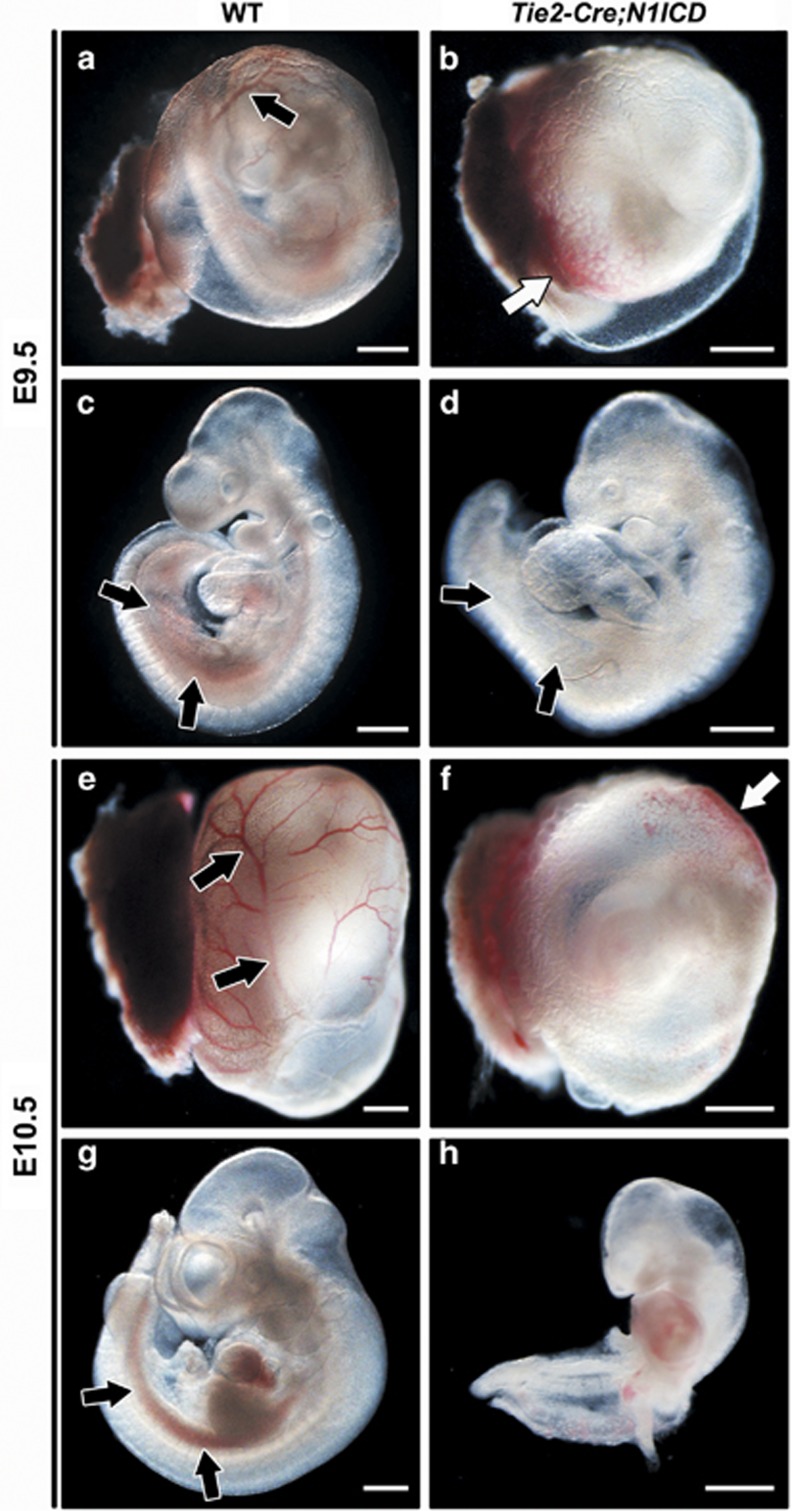
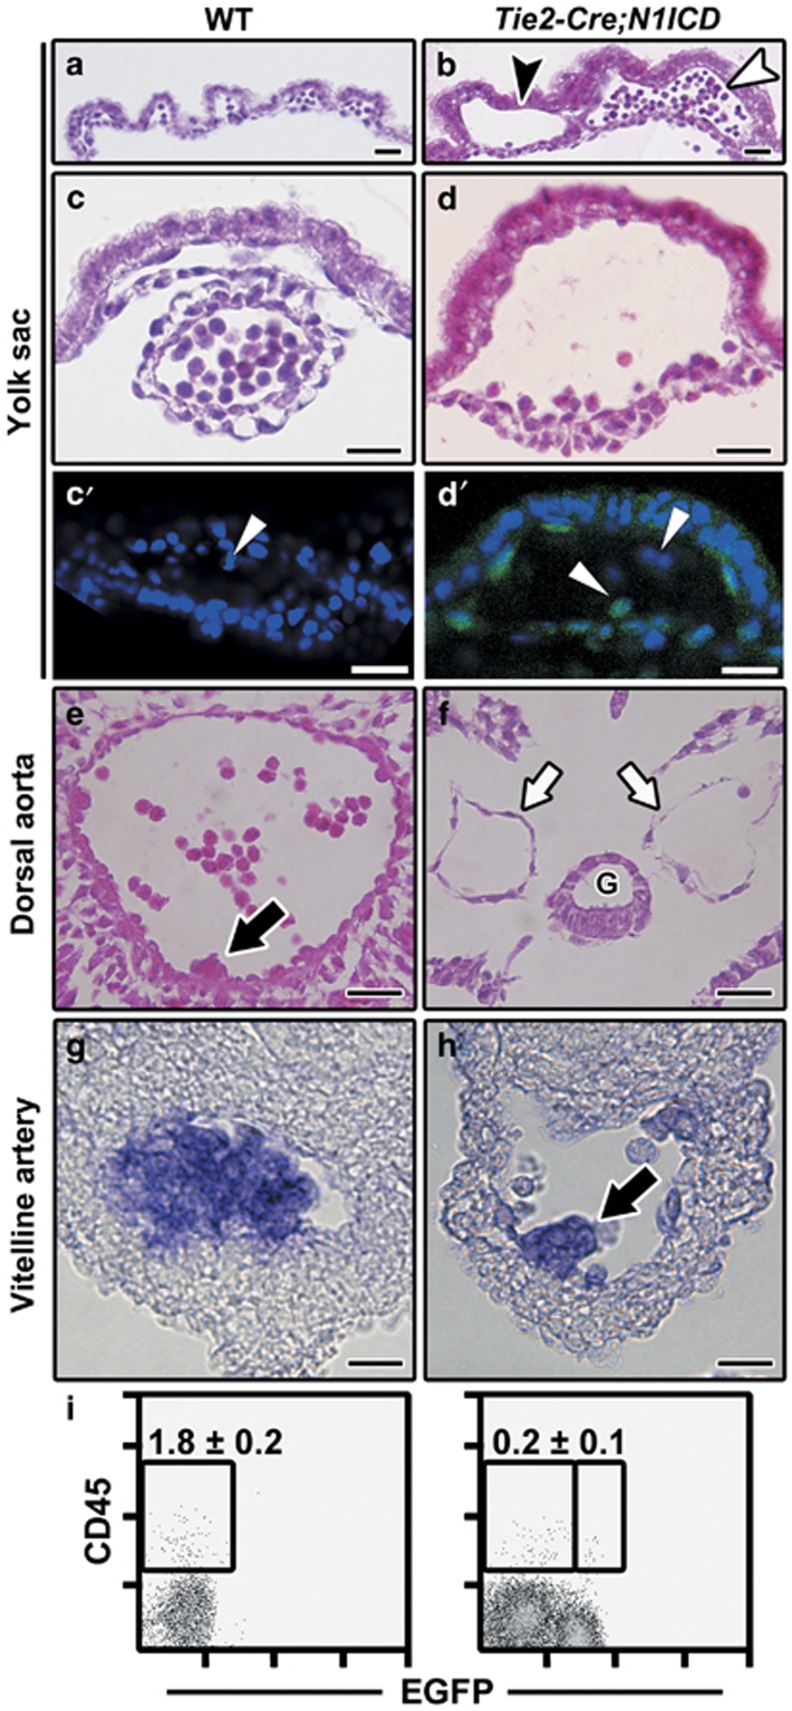
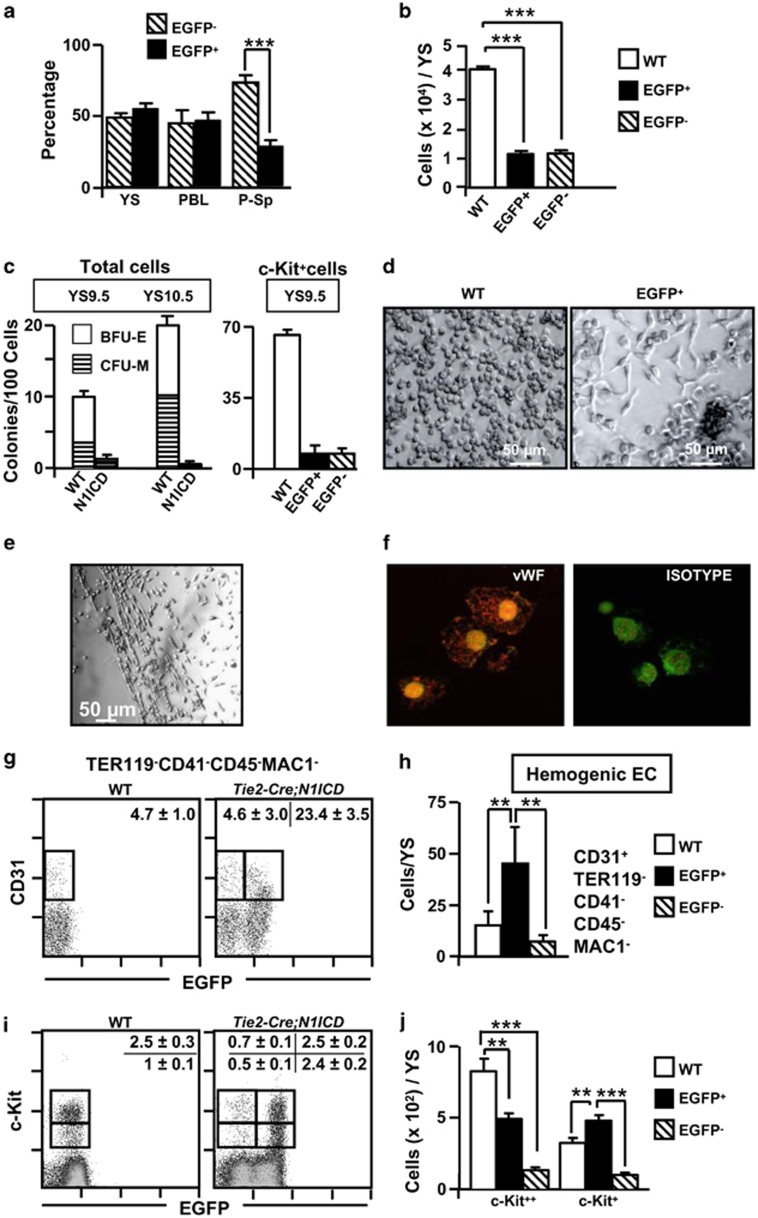
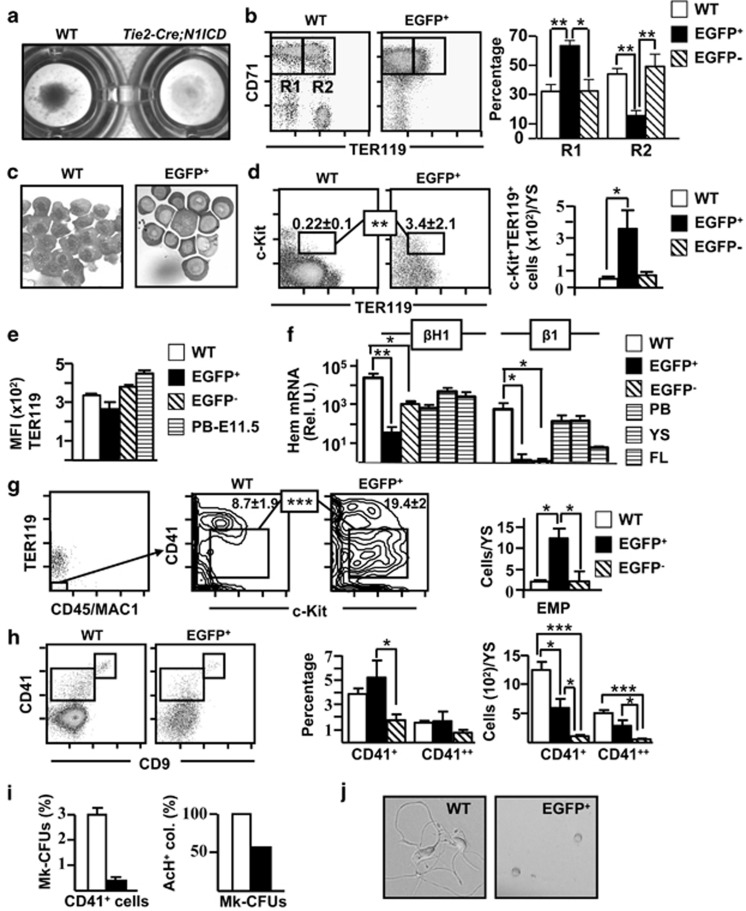
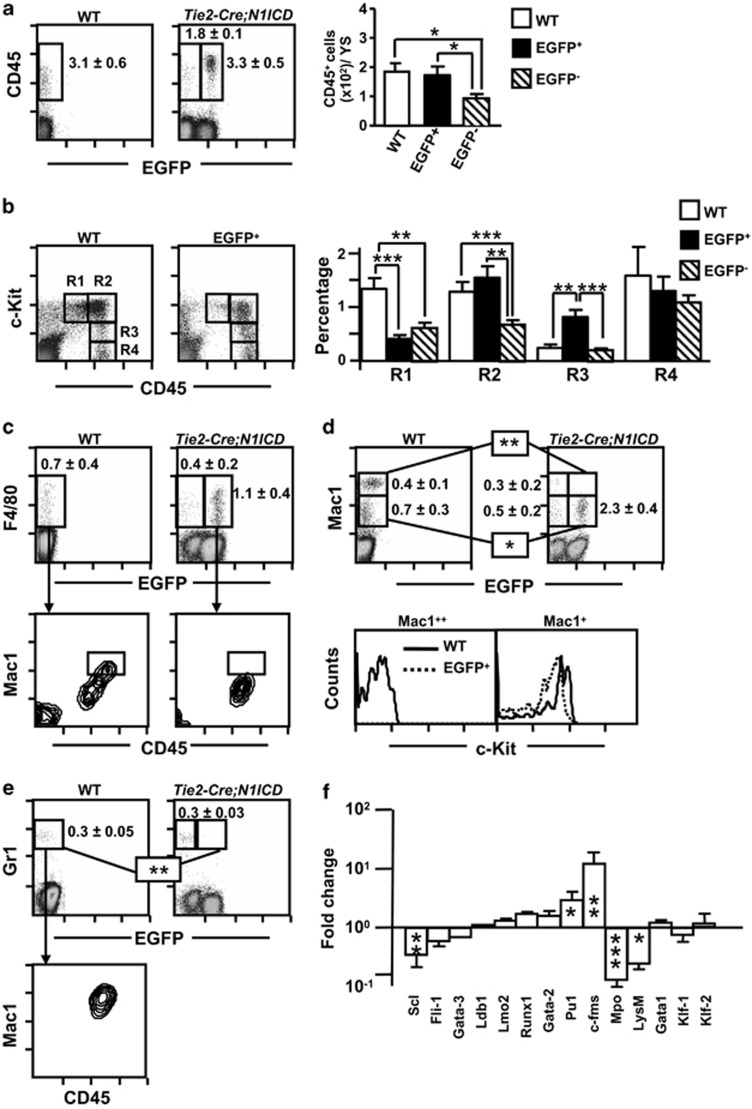
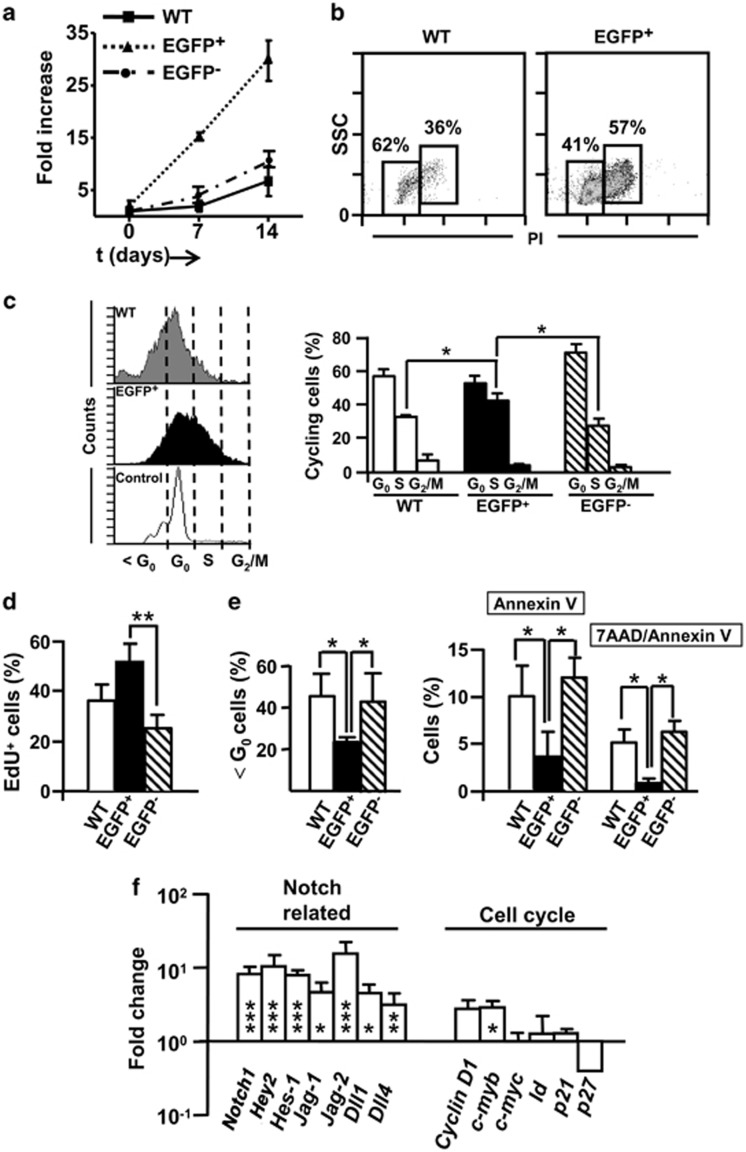
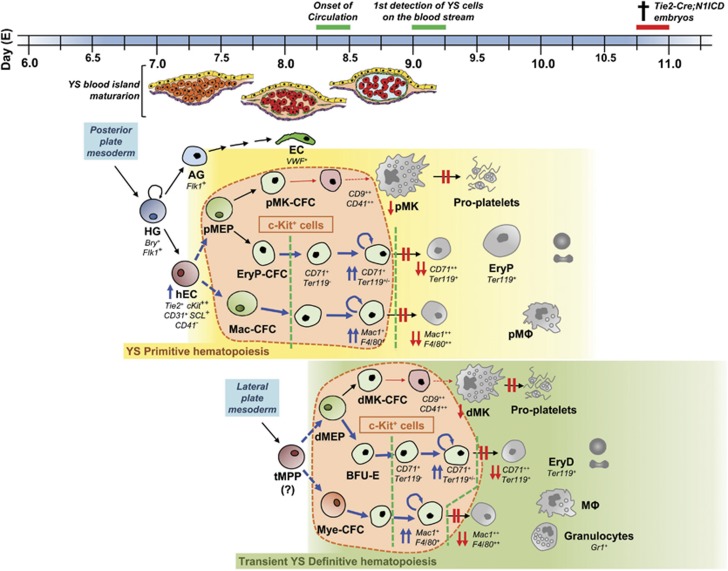
Loss-of-function studies have demonstrated the essential role of Notch in definitive embryonic mouse hematopoiesis. We report here the consequences of Notch gain-of-function in mouse embryo hematopoiesis, achieved by constitutive expression of Notch1 intracellular domain (N1ICD) in angiopoietin receptor tyrosine kinase receptor-2 (Tie2)-derived enhanced green fluorescence protein (EGFP(+)) hematovascular progenitors. At E9.5, N1ICD expression led to the absence of the dorsal aorta hematopoietic clusters and of definitive hematopoiesis. The EGFP(+) transient multipotent progenitors, purified from E9.5 to 10.5 Tie2-Cre;N1ICD yolk sac (YS) cells, had strongly reduced hematopoietic potential, whereas they had increased numbers of hemogenic endothelial cells. Late erythroid cell differentiation stages and mature myeloid cells (Gr1(+), MPO(+)) were also strongly decreased. In contrast, EGFP(+) erythro-myeloid progenitors, immature and intermediate differentiation stages of YS erythroid and myeloid cell lineages, were expanded. Tie2-Cre;N1ICD YS had reduced numbers of CD41(++) megakaryocytes, and these produced reduced below-normal numbers of immature colonies in vitro and their terminal differentiation was blocked. Cells from Tie2-Cre;N1ICD YS had a higher proliferation rate and lower apoptosis than wild-type (WT) YS cells. Quantitative gene expression analysis of FACS-purified EGFP(+) YS progenitors revealed upregulation of Notch1-related genes and alterations in genes involved in hematopoietic differentiation. These results represent the first in vivo evidence of a role for Notch signaling in YS transient definitive hematopoiesis. Our results show that constitutive Notch1 activation in Tie2(+) cells hampers YS hematopoiesis of E9.5 embryos and demonstrate that Notch signaling regulates this process by balancing the proliferation and differentiation dynamics of lineage-restricted intermediate progenitors.


Figures

Figure 1
Figure 1
Constitutive Notch1 activation on Tie2+ progenitor cells impairs hematopoietic development. WT and Tie2-Cre;N1ICD embryos (left and right panels, respectively) at E9.5 (ad) and E10.5 (eh), with the YS (a, b, e and f) and without it (c, d, g and h). (a, b) Morphology of the YS of WT and Tie2-Cre;N1ICD embryos. WT YS contains normally developed blood vessels (black arrow in a) that are absent in transgenic YS. Tie2-Cre;N1ICD YS is very pale, with hemoglobinized cells concentrated at one pole (white arrow in b). (c, d) Lateral views of WT and Tie2-Cre;N1ICD embryos. Black arrows indicate the P-Sp/AGM region with hemoglobinized content in WT, and the pale region in the transgenic embryo, indicative of defective definitive hematopoietic development. (eh) At E10.5, defects in Tie2-Cre;N1ICD YS and embryos are more severe. Black arrows in (e) mark the well-developed WT YS blood vessels that are never seen in transgenic YS (f), which instead contains randomly located pockets of high hemoglobin content (white arrow). Lateral views of WT (g) and Tie2-Cre;N1ICD (h) embryos show the hemoglobinized dorsal aorta in the AGM region (black arrows) of a WT embryo that is absent in the transgenic embryo. Scale bars: 800 μm
Figure 2
Figure 2
Tie2-Cre;N1ICD embryos display severe vascular alterations and a blockade of intraembryonic definitive hematopoiesis. (ad) Bright-field images of H&E-stained transverse sections of YS from E9.5 WT (a, c) and Tie2-Cre;N1ICD (b, d) embryos, showing the differences in blood vessel diameter and circulating cell number. Transgenic YS (b) exhibits two types of blood island, with the lumen empty (black arrowhead) or with a high concentration of circulating cells (white arrowhead). Panels (c) and (d) show detailed views of a normal blood vessel in WT YS (c) and a dilated vessel of Tie2-Cre;N1ICD YS (d). (c′, d′) Confocal image of a WT (c′) and Tie2-Cre;N1ICD YS (d′) stained with DAPI. The white arrowheads in point to the circulating cells in WT YS that do not express EGFP (c′), and to EGFP+ coexisting with EGFP circulating cells in the transgenic YS (d′). (e, f) Transverse sections of E9.5 dorsal aorta at the P-Sp/AGM region level in WT (e) and Tie2-Cre;N1ICD embryos (f); transgenic animals have bilateral dorsal aortas (white arrows) and lack the hematopoietic cell clusters that start to bud off from the endothelium in WT embryos (black arrows in e). G, gut. (g, h) In situ hybridization of AML1/Runx1 in WT (g) and Tie2-Cre;N1ICD (h) vitelline artery. Hematopoietic cells almost obliterate the lumen of WT vitelline artery, whereas a single small hematopoietic cell cluster is seen in the Tie2-Cre;N1ICD vessel (black arrow in h). (i) Dot plots showing a marked reduction in the CD45+ cell population in the caudal portion of Tie2-Cre;N1ICD (right) versus WT (left) embryos. Data show frequency (mean±S.E.M., N=3). Scale bars: 25 μm
Figure 3
Figure 3
Immature progenitor cell populations in E9.5 Tie2-Cre;N1ICD mice have a weak hematopoietic potential and maintain endothelial progenitors. (a) Contribution of EGFP and EGFP+ (N1ICD transgene-expressing) cells to YS, blood and P-Sp in E9.5Tie2-Cre;N1ICD embryos. The graph shows the relative percentage of EGFP+ and EGFP cells in preparations of the indicated cell suspensions (mean±S.E.M., N=13 for YS and P-Sp and N=7 for blood). (b) N1ICD expression in Tie2-Cre;N1ICD YS reduces the numbers of cells expressing and not expressing the transgene at E9.5. Bar chart shows quantification of YS cells in WT and in Tie2-Cre;N1ICD EGFP and EGFP+ cell populations. Bars represent mean±S.E.M. (N=15). (c) Hematopoietic potential of WT and Tie2-Cre;N1ICD YS cells. Cells were cultured in MethoCult3434 medium for 7 days. Graphs show the absolute numbers of BFU-E and CFU-M (erythroid and myeloid, respectively) per 100 cells, detected in cultures of total cells at E9.5 and E10.5 (left) or from FACS-purified c-Kit-expressing progenitor cells of WT and EGFP and EGFP+ Tie2-Cre;N1ICD cells at E9.5 (right). Data are mean±S.E.M. (N=3). (d) Microphotographs showing representative colonies of WT and EGFP+ cells. The periphery of EGFP+ colonies is populated by elongated, polarized cells. (e) Pseudo-endothelial structures formed after in vitro culture of EGFP+ CFUs on fibronectin-coated plates in the presence of the pro-endothelial factors bFGF and VEGF. (f) Merged microphotographs of EGFP+ CFU cells stained with vWF antibody (left) or with an isotype control antibody (right). (g) Representative cytometry plots of E9.5 YS cells from WT and Tie2-Cre;N1ICD mice stained for CD41, CD31, CD45, TER119 and CD11b/Mac1. CD41+CD45+TER119+CD11b+ cells were electronically excluded, and CD31+ is plotted showing green channel fluorescence to identify EGFP+ cells. Boxed areas define hemogenic EC cells as CD31+CD41CD45TER119CD11b. Numbers are percentages of gated cells, as mean±S.E.M, (N=4). (i) Representative cytometry plots of E9.5 YS cells from WT and Tie2-Cre;N1ICD mice stained for c-Kit, and plotted against green fluorescence channel. Boxes define c-Kit+ and c-Kit++ cell populations, and numbers are percentages of gated cells, as mean±S.E.M. (N=25). (h, j) The graphs show the number of cells of each population per YS; bars are mean±S.E.M,; data were calculated from the total YS cell counts presented in (b). Bars are labeled as in (b). **P<0.01, ***P<0.001
Figure 4
Figure 4
Abnormal erythroid and megakaryocyte differentiation in Tie2-Cre;N1ICD YS. (a) YS cells centrifuged on 96-well plates, revealing the low hemoglobin content of Tie2-Cre;N1ICD YS, indicating defective erythroid differentiation. (b) Representative dot plots of double-stained WT and electronically gated EGFP+ cells for the erythroid marker TER119 and the transferrin receptor CD71. Boxed areas define CD71++TER119 (R1) and CD71++/TER119+ (R2) cells. The graph in the right shows the relative percentage of R1 and R2 cell populations (mean±S.E.M.; N=6) in WT and electronically gated EGFP+ and EGFP cells. (c) Microphotographs of May Grümwald-Giemsa staining in WT and FACS-purified EGFP+ Tie2-Cre;N1ICD cells. (d) Representative dot plots of WT and electronically gated EGFP+ cells for TER119 and c-Kit. Numbers are relative percentages of the TER119+c-Kit+, cells boxed (mean±S.E.M.; N=6). The right graph shows the quantification of numbers of TER119+c-Kit+ cells/YS calculated as in Figure 3j (mean±S.E.M.; N=6) for WT and electronically gated EGFP+ and EGFP cells. (e) The graph represents the mean fluorescence intensity (MFI) data obtained from E9.5 WT and electronically gated EGFP+ and EGFP cells from Tie2-Cre;N1ICD mice stained for TER119, as mean±S.E.M. (N=4). Staining of blood cells at E11.5 is shown as a control. (f) Quantifications of embryo-derived primitive (βH1) and definitive (β1) hemoglobins are shown in the bar graph. WT and FACS-purified EGFP+ and EGFP Tie2-Cre;N1ICD cells were submitted to RNA extraction, cDNA was synthesized and RT-qPCR was performed as indicated in Materials and Methods. The Bio-Rad CFX Manager software was used to calculate the CT of each reaction, and the relative amount of specific cDNA in each sample was determined by the ΔCT method. Results are displayed as the relative expression of each transcript over Gα gene expression (mean±S.E.M.; N=4). (g) Representative FACS analysis of WT and Tie2-Cre;N1ICD mice stained for TER119, CD45/Mac1, CD41 and c-Kit. TER119CD45/Mac1 cells were gated (left dot plot) and analyzed for CD41 and c-Kit, as indicated in the plots from WT and electronically gated EGFP+ cells. The boxes identify the c-Kit+CD41+ erythro-myeloid progenitor (EMP) population; numbers are percentages (mean±S.E.M.; N=4). The right graph shows the EMP quantification/YS calculated as in Figure 3j (mean±S.E.M.; N=4) for WT and electronically gated EGFP+ and EGFP cells. (h) Representative FACS analysis of WT and electronically gated EGFP+ cells stained for CD9 and CD41. Boxed areas define the double-positive CD9++CD41++ megakaryocytic population and the CD9+CD41+ cell population. The graphs in the right show the relative percentages and absolute numbers of both cell populations in WT and electronically gated EGFP+ and EGFP Tie2-Cre;N1ICD YS (N=5). (i) Left panel, Representative graph of the relative percentage of megakaryocyte progenitors (MK-CFUs) present in FACS-purified CD41+ cells from WT versus EGFP+ populations (N=3). Right panel, Relative percentages of MK-CFUs expressing acetylthiocholiniodide (AcH) in WT versus EGFP+ cells (N=3). (j) Microphotographs showing cultures of CD9++CD41++ FACS-purified cells from E9.5 WT and EGFP+ Tie2-Cre;N1ICD YS cells at 48 h of culture. *P<0.05, **P<0.01, ***P<0.001
Figure 5
Figure 5
N1ICD inhibits the differentiation of YS myeloid progenitors. Total WT and Tie2-Cre;N1ICD YS cells were stained with the indicated antibodies and analyzed by flow cytometry. (a) CD45+ cell numbers are elevated in YS from Tie2-Cre;N1ICD mice at E9.5. Dot plots show a representative detection of myeloid CD45+ cells (boxed areas) in WT and Tie2-Cre;N1ICD preparations. Inside the plots cell percentages are shown as mean±S.E.M., N=15. The bar chart shows the number of CD45+ cells per YS, calculated for each sample using the corresponding data presented in Figure 3b. (b) Dot plots of WT and electronically gated EGFP+ YS cells stained for the hematopoietic markers CD45 and c-Kit. Gates define the following subpopulations: c-Kit++CD45+ (R1), c-Kit++CD45++ (R2), c-Kit+CD45++ (R3) and c-KitCD45++ (R4). The bar chart shows relative percentages of electronically gated WT and EGFP+ and EGFP Tie2-Cre;N1ICD YS cells as mean±S.E.M., N=10. (c) Upper panel: dot plots show a representative detection of the macrophage marker F4/80, boxed areas with relative percentages as mean (±S.E.M., N=4), in total WT and Tie2-Cre;N1ICD YS cells, detected in the green fluorescence channel to identify EGFP+ cells. Lower panel: dot plots show Mac1 and CD45 expression in electronically gated WT F4/80+ cells and EGFP+F4/80+cells. The boxed areas highlight a Mac1++CD45++ subpopulation not found among EGFP+F4/80+cells. (d) Mac1 antibody staining in total WT and Tie2-Cre;N1ICD YS cells, displayed as in (c). The boxes mark the Mac1+ and Mac1++ subpopulations, with relative numbers shown to the right as mean±S.E.M., N=4; Mac1++ cells are absent in EGFP+ transgenic mice. The lower histograms show c-Kit-stained cells in the electronically gated Mac1+ and Mac1++ subpopulations from WT or EGFP+ YS. Mac1+ cells in WT (solid line) and EGFP+ (open line) YS cells (left histogram) co-express c-Kit. WT Mac1++ cells do not express c-Kit, indicating their more mature phenotype (right histogram). (e) Dot plots of Gr1 staining (boxed areas) showing the absence of Gr1+ cells in the EGFP+ Tie2-Cre;N1ICD YS cells. The percentage of Gr1+ cells is indicated as mean±S.E.M., N=3. The contour plot (bottom) shows co-expression of Mac1 and CD45 in electronically gated WT Gr1+ cells. (f) Quantitative PCR analysis of FACS-purified WT and EGFP+ cells for the expression of selected genes implicated in early hematopoiesis (SCL, Fli1, GATA3, Ldb1, Lmo2 and Runx1), myeloid development (GATA2, PU.1, c-fms, Mpo and LysM) and erythroid development (GATA1, KLF1 and KLF2). Data are shown as the fold change in mRNA expression level (ΔΔCt method) between EGFP+ cells from Tie2-Cre;N1ICD YS relative to WT YS cells. Bars are mean±S.E.M., N=3. *P<0.05, **P<0.01, ***P<0.001
Figure 6
Figure 6
Proliferation, cell cycle and apoptosis in Tie2-Cre;N1ICD YS. (a) Equal numbers (2 × 10³ cells/well) of WT or Tie2-Cre;N1ICD YS cells were cultured on OP9 stromal cells. Cells were recovered after 7 days, counted, replated at 2 × 10³ cells/well and cultured for further 7 days. The percentage of EGFP+ cells was detected by flow cytometry, and absolute numbers of each cell type were calculated from the total number of recovered cells. Fold increase in cell number was calculated at 7 and 14 days. Mean±S.E.M., N=3. (b) Representative dot plots of FACS-purified WT and EGFP+ Tie2-Cre;N1ICD cells, showing cell size (SSC) and propidium iodide staining for cell-cycle analysis. Boxed areas define Go/G1 phase (left box) and the S plus G2M phase populations (right box), and numbers are the percentages in this experiment (N=2). (c) DNA content quantified by cytometric analysis of electronically gated EGFP+ Tie2-Cre;N1ICD and WT cells stained with Hoechst 33342. Representative histograms are shown for WT, EGFP+ and EGFP YS cell populations. Vertical dotted lines indicate the cell-cycle phases defined by the control cells used (adult thymus). The bar chart shows cells in G0/G1, S and G2M as a percentage of total cells found in cycle (>G0) (N=4). (d) Relative percentage of EGFP+, EGFP and WT cells that incorporated the nucleotide-analog EdU 1 h after intraperitoneal injection into the pregnant females (N=6 for cells purified from YS of Tie2-Cre;N1ICD mice and N=11 for WT YS cells). (e) Left panel, Percentages of apoptotic cells (<G0 cell population) detected in the DNA content cytometry analysis shown in (c) in WT and EGFP+ YS cells. Right panel, Percentages of apoptotic WT and EGFP+ and EGFP YS cells defined by cytometric analysis of staining with Annexin V and 7-aminoactinomycin D (7AAD) (N=4). (f) Fold change (ΔΔCt method) in mRNA expression levels of Notch pathway and cell-cycle regulatory genes in FACS-purified EGFP+ Tie2-Cre;N1ICD cells relative to WT cells. The data were obtained as in Figure 5f for each sample. *P<0.05, **P<0.01, ***P<0.001
Figure 7
Figure 7
Yolk sac hematopoiesis alterations in Tie2-Cre;N1ICD embryos. In the mouse at around embryonic day (E) 7.0–7.25 early hemangioblasts (HG) emerged from the posterior streak mesoderm and give rise to hemogenic endothelial cells (hEC), and angioblasts (AG) progenitor cells on the extraembryonic YS blood island. The AG will produce part of the YS vascular endothelial cells (EC). On the other hand, YS hematopoiesis occurs in two waves, the primitive (from ∼E7.25, yellow box) and definitive (green box) waves that overlap, temporally and spatially, and produce relatively short-lived cells. hEC give rise, first, to bipotential primitive megakaryocyte/erythroid progenitor (pMEP) that will in turn generate specific primitive progenitors for both cell lineages (pMK-CFC and EryP-CFC); and second, to primitive macrophage precursor cells (Mac-CFC). These progenitors will generate the primitive hematopoietic cell lineages: primitive erythrocytes (EryP), primitive megakaryocytes (pMK) – able to give rise to proplatelets – and primitive macrophages (pMΦ). This short-lived primitive wave is rapidly followed by the second hematopoietic wave that comprises YS definitive erythroid, megakaryocyte and several myeloid lineages. The YS definitive populations are believed to arise from transient multipotent progenitors (tMPPs) – but not from hematopoietic stem cells, which emerge in the mouse YS at around E9.0 – that are detected from ∼E8.25 and generate different transient cell populations of restricted erythro-myeloid progenitors (EMPs). EMPs comprise definitive-type bipotential megakaryocyte/erythroid progenitor (dMEP) that will give rise to transient definitive megakaryocyte and erythrocyte progenitors (dMK-CFC and BFU-E) and definitive myeloid progenitors (Mye-CFC), from which definitive-type erythrocytes (EryD), megakaryocytes (dMK) – with the capacity to originate proplatelets – and several myeloid lineages: macrophages (MΦ), granulocytes and mast cells will be produced. The expression of N1ICD in early Tie2+ progenitors produces severe alterations in both YS primitive and definitive hematopoiesis characterized by high frequency of c-Kit-expressing multipotential and lineage-restricted progenitors (encircled by the orange bubbles) at E9.5, whereas it blocks the generation of the last maturation stages of erythrocytes, megakaryocytes and myeloid lineages. First, no CD71++TER119+ and Mac1++F4/80++ cells are produced. In contrast, lineage-restricted progenitors accumulate in the initial or intermediate stages of their differentiation (CD71++TER119 proerythroblasts and Mac1+F4/80+ myeloid progenitors). Accordingly, diminished numbers of CD9++CD41++ megakaryoblasts are found among EGFP+ YS cells and the final steps of differentiation in vitro are selectively blocked. On the other hand, ectopic N1ICD expression in these intermediate progenitors (delimited by green open lines) induces misbalanced proliferation and apoptosis, preventing their normal differentiation. Thick blue arrows denote an increase in cell frequency; weak red arrows indicate a restriction on cell frequency

Similar articles

Cited by

References

    1. Artavanis-Tsakonas S, Rand MD, Lake RJ. Notch signaling: cell fate control and signal integration in development. Science. 1999;284:770–776. - PubMed
    1. Radtke F, Fasnacht N, Macdonald HR. Notch signalling in the immune system. Immunity. 2010;32:14–27. - PubMed
    1. Lieber T, Kidd S, Alcamo E, Corbin V, Young MW. Antineurogenic phenotypes induced by truncated Notch proteins indicate a role in signal transduction and may point to a novel function for Notch in nuclei. Genes Dev. 1993;7:1949–1965. - PubMed
    1. Rebay I, Fehon RG, Artavanis-Tsakonas S. Specific truncations of Drosophila Notch define dominant activated and dominant negative forms of the receptor. Cell. 1993;74:319–329. - PubMed
    1. Struhl G, Fitzgerald K, Greenwald I. Intrinsic activity of the Lin-12 and Notch intracellular domains in vivo. Cell. 1993;74:331–345. - PubMed

Publication types