Clinical Trial
. 2014 May 1;20(9):2433-44.
doi: 10.1158/1078-0432.CCR-13-2617. Epub 2014 Feb 28.

Phase I dendritic cell p53 peptide vaccine for head and neck cancer

Affiliations
Clinical Trial

Phase I dendritic cell p53 peptide vaccine for head and neck cancer

Patrick J Schuler et al. Clin Cancer Res. .

Abstract

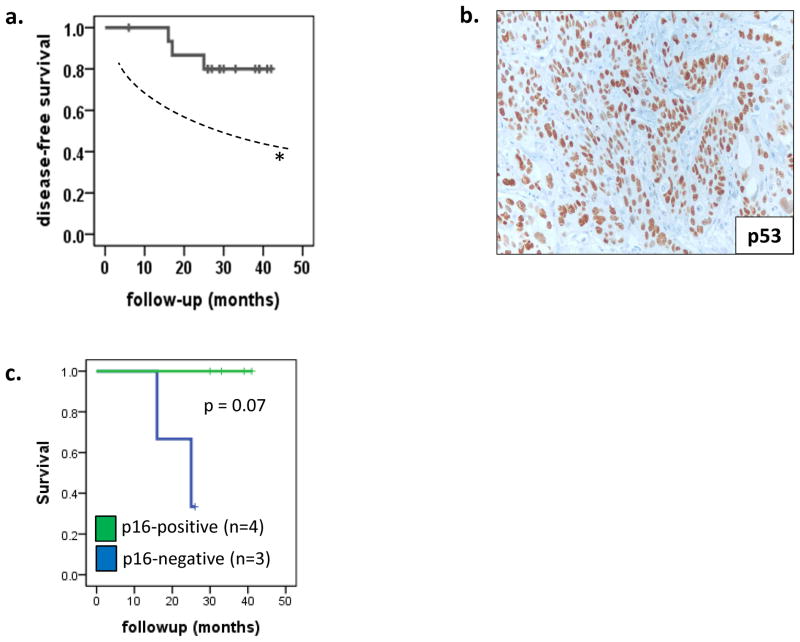
Background: p53 accumulation in head and neck squamous cell carcinoma (HNSCC) cells creates a targetable tumor antigen. Adjuvant dendritic cell (DC)-based vaccination against p53 was tested in a phase I clinical trial.

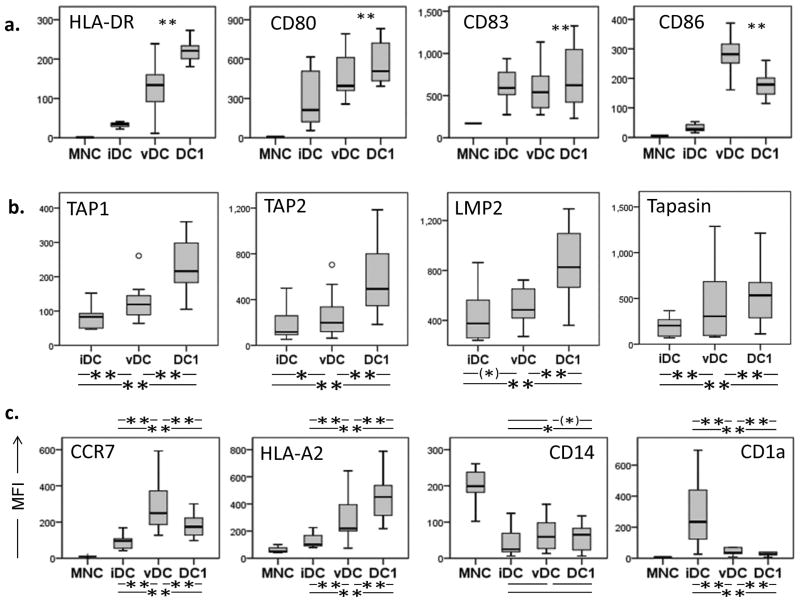
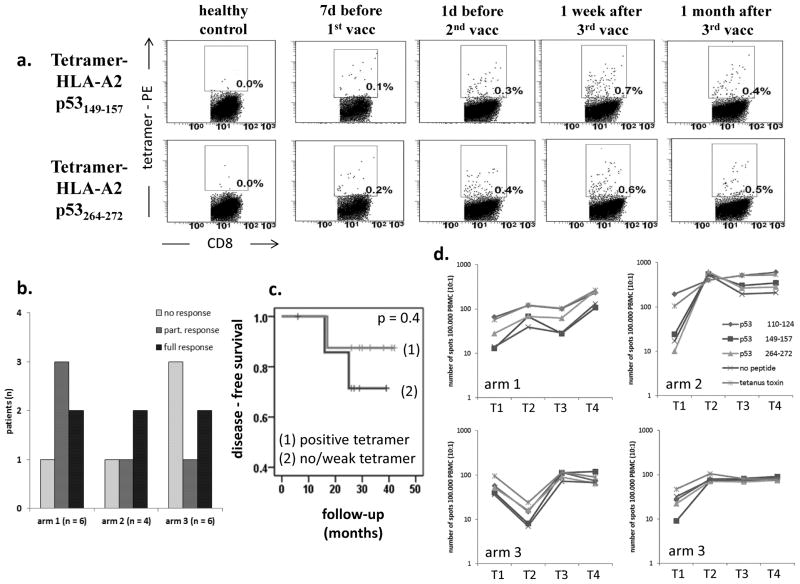
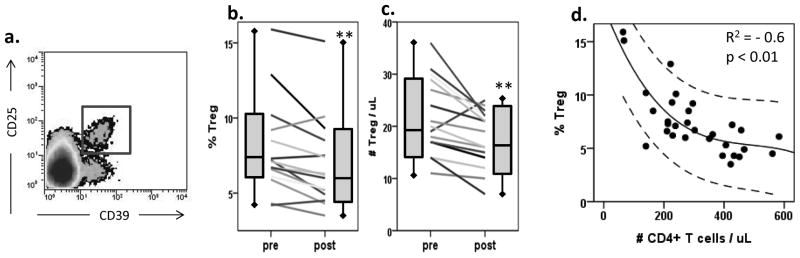
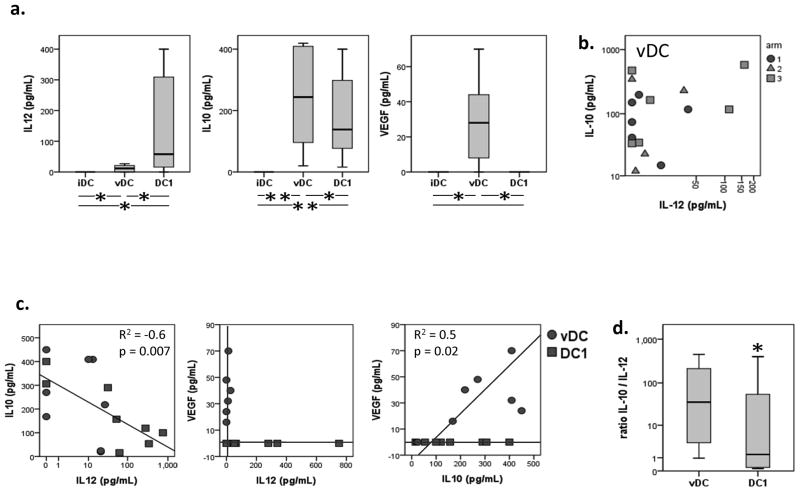
Experimental methods: Monocyte-derived DC from 16 patients were loaded with two modified HLA-class I p53 peptides (Arm 1), additional Th tetanus toxoid peptide (Arm 2), or additional Th wild-type (wt) p53-specific peptide (Arm 3). Vaccine DCs (vDC) were delivered to inguinal lymph nodes at three time points. vDC phenotype, circulating p53-specific T cells, and regulatory T cells (Treg) were serially monitored by flow cytometry and cytokine production by Luminex. vDC properties were compared with those of DC1 generated with an alternative maturation regimen.

Results: No grade II-IV adverse events were observed. Two-year disease-free survival of 88% was favorable. p53-specific T-cell frequencies were increased postvaccination in 11 of 16 patients (69%), with IFN-γ secretion detected in four of 16 patients. Treg frequencies were consistently decreased (P = 0.006) relative to prevaccination values. The phenotype and function of DC1 were improved relative to vDC.

Conclusion: Adjuvant p53-specific vaccination of patients with HNSCC was safe and associated with promising clinical outcome, decreased Treg levels, and modest vaccine-specific immunity. HNSCC patients' DC required stronger maturation stimuli to reverse immune suppression and improve vaccine efficacy.


Conflict of interest statement

Conflicts of Interest: none

Figures

Figure 1
Figure 1. Disease-free survival (DFS) and tumor immunohistochemistry
(a) Disease-free survival (DFS) was 88% after 2 years and 80% after 3 years. (b) Representative IHC of an HNSCC tumor positive for p53 (10X magnification) (c) DFS for patients (n=7) based on HPV p16-status.
Figure 2
Figure 2. Phenotypic and functional characteristics of vDC
(a) Monocyte- derived immature DC (iDC) were loaded with wt p53 peptides and matured in a conventional cytokine cocktail prior to vaccination or in an alternative cytokine cocktail generating DC1. Mature DC for vaccination (vDC) and DC-1 were phenotyped for the maturation markers. Box plots for all patients’ vDC show quartiles for 25, 50, 75 as boxes, and values for 0% and 100% as whiskers. (b) Intracellular expression of antigen-presenting machinery (APM) components TAP1, TAP2, LMP2 and tapasin was determined in iDC and vDC of all study patients (n=16). Intracellular expression of antigen-presenting machinery (APM) components was determined in vDC and DC1 of all study patients (n=16). *p < 0.05, **p < 0.01. (c) Immature DC (iDC) were generated from monocytes (MNC) obtained from study patients with HNSCC. iDC were matured with two different maturation cocktails (vDC and DC1). MNC, iDC, vDC and DC1 were phenotyped for additional maturation markers. Wilcoxon paired signed-rank test **p < 0.005, *p < 0.05, (*) p < 0.1.
Figure 3
Figure 3. Immune response to the vaccine
(a) The frequency of CTL specific for wt p53149-157 or wt p53262-274 sequences in patients’ peripheral blood was determined by tetramer-flow cytometry at baseline and at three follow-up time points, as indicated. Dot plots are from one representative HNSCC patient and one normal control (NC). Boxes indicate tetramer-positive CD8+ T cells. (b) Numbers of patients in each treatment arm with positive, partial or no tetramer response. 6/16 patients (38%) showed a positive immune response; 5/16 patients (31%) showed a partial response with an elevated CTL frequency for only one peptide; and 5/16 patients (31%) showed no peptide-specific immune response to both wt p53 peptides. Patients in treatment arm 1 had the most favorable immune response, without reaching significance (p > 0.2). (c) DFS by the positivity of tetramer responses; patients are classified as ‘positive tetramer response’ or ‘no/weak tetramer response’. Overall DFS was similar for each tetramer response group (log rank p = .754). (d) Representative IFN-γ ELISPOT data at four different time points: T1: baseline, T2: one day before 2nd vaccine, T3: one week after 3rd vaccine, and T4: one month after 3rd vaccine. CTL reactive against wt p53 peptides, tetanus toxoid or no peptide were measured in PBMC stimulated with peptide-loaded T2 cells. Longer term follow up data are shown for four patients with a positive immune response.
Figure 4
Figure 4. Regulatory T cells (Treg) in the peripheral blood and phenotype of dendritic cells
(a) Treg were defined as CD4+CD39+CD25+ cells by flow cytometry, which are regularly identified as a defined population. (b) Percentages of CD4+CD39+CD25+ Treg in the peripheral blood of patients (n=16) before and after vaccination. Wilcoxon paired signed-rank test **p = 0.006. (c) Absolute numbers of CD4+CD39+CD25+ Treg in the peripheral blood of patients (n=16) before and after vaccination. Wilcoxon paired signed-rank test **p = 0.005. (d) The frequency of Treg in the peripheral circulation inversely correlates to the absolute number of CD4+ T cells (R2 = −0.6, p < 0.01). Upper and lower lines denote 95% confidence interval.
Figure 5
Figure 5. Functional characteristics of cytokine secretion by vDC and DC1
(a) Production of cytokines IL-10 and IL-12 was measured by LuminexTM in CD40L-stimulated vDC (b) and DC1. (c) Production of IL-10 and IL-12 was inversely correlated in all DC (R2 = −0.6, p = 0.007) and production of IL-10 and VEGF was positively correlated in vDC (panel (d), R2 = 0.5, p = 0.02). Wilcoxon paired signed-rank test *p < 0.05, **p < 0.01.

References

    1. Argiris A, Karamouzis MV, Raben D, Ferris RL. Head and neck cancer. Lancet. 2008;371(9625):1695–709. - PMC - PubMed
    1. Shurin MR, Shurin GV, Lokshin A, Yurkovetsky ZR, Gutkin DW, Chatta G, et al. Intratumoral cytokines/chemokines/growth factors and tumor infiltrating dendritic cells: friends or enemies? Cancer metastasis reviews. 2006;25(3):333–56. doi: 10.1007/s10555-006-9010-6. Epub 2006/10/10. - DOI - PubMed
    1. Whiteside TL, Stanson J, Shurin MR, Ferrone S. Antigen-processing machinery in human dendritic cells: up-regulation by maturation and down-regulation by tumor cells. Journal of immunology. 2004;173(3):1526–34. - PubMed
    1. Ferris RL, Whiteside TL, Ferrone S. Immune escape associated with functional defects in antigen-processing machinery in head and neck cancer. Clin Cancer Res. 2006;12(13):3890–5. doi: 10.1158/1078-0432.CCR-05-2750. Epub 2006/07/05. - DOI - PubMed
    1. Strauss L, Bergmann C, Whiteside TL. Functional and phenotypic characteristics of CD4+CD25highFoxp3+ Treg clones obtained from peripheral blood of patients with cancer. International journal of cancer. 2007;121(11):2473–83. - PubMed

Publication types

MeSH terms