Clinical Trial
. 2014 Feb 15;5(3):587-98.
doi: 10.18632/oncotarget.1782.

Immune regulation by low doses of the DNA methyltransferase inhibitor 5-azacitidine in common human epithelial cancers

Affiliations
Clinical Trial

Immune regulation by low doses of the DNA methyltransferase inhibitor 5-azacitidine in common human epithelial cancers

Huili Li et al. Oncotarget. .

Abstract

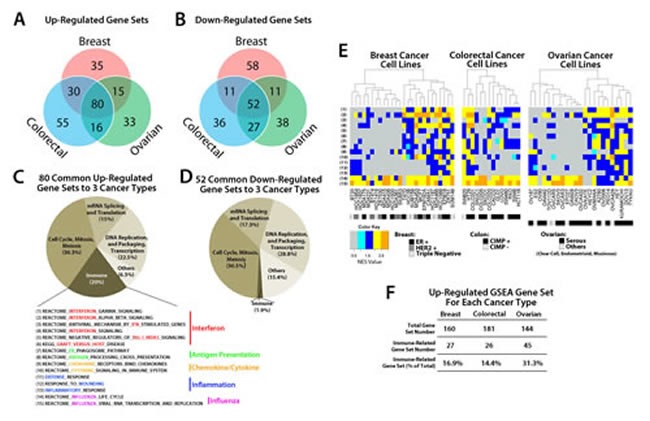
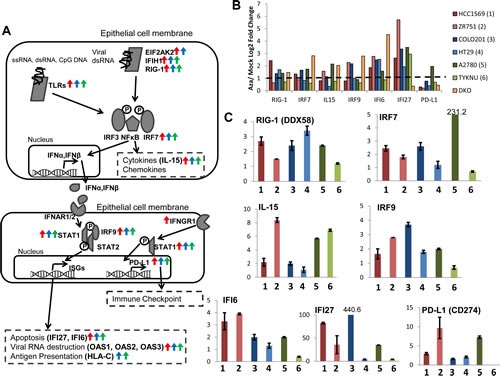
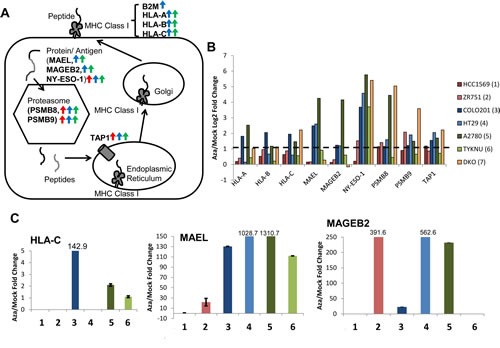
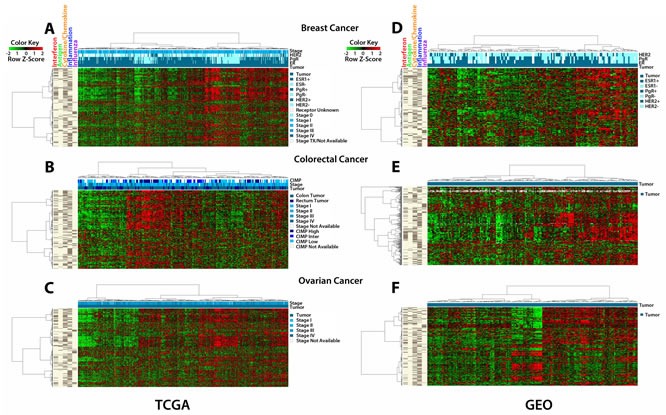
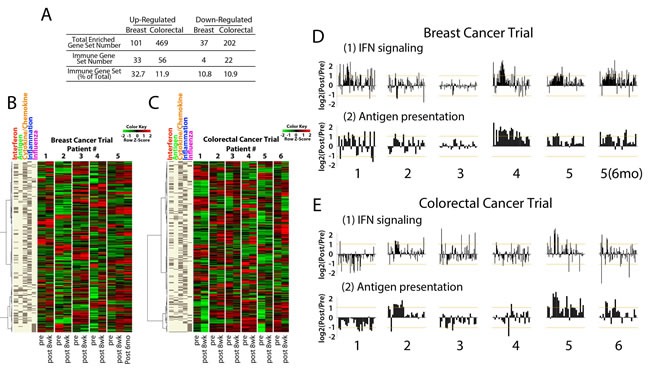
Epigenetic therapy is emerging as a potential therapy for solid tumors. To investigate its mechanism of action, we performed integrative expression and methylation analysis of 63 cancer cell lines (breast, colorectal, and ovarian) after treatment with the DNA methyltransferase inhibitor 5-azacitidine (AZA). Gene Set Enrichment Analysis demonstrated significant enrichment for immunomodulatory pathways in all three cancers (14.4-31.3%) including interferon signaling, antigen processing and presentation, and cytokines/chemokines. Strong upregulation of cancer testis antigens was also observed. An AZA IMmune gene set (AIMs) derived from the union of these immunomodulatory pathway genes classified primary tumors from all three types, into "high" and "low" AIM gene expression subsets in tumor expression data from both TCGA and GEO. Samples from selected patient biopsies showed upregulation of AIM genes after treatment with epigenetic therapy. These results point to a broad immune stimulatory role for DNA demethylating drugs in multiple cancers.

Trial registration: ClinicalTrials.gov NCT01105377 NCT01349959.


Figures

Figure 1
Figure 1. GSEA analysis of transcripts regulated by AZA in breast, colorectal, and ovarian cancer cell lines reveals pathways common to all three cancer types
Venn Diagram showing the number of GSEA gene sets A) upregulated (NES > 2.15, FDR < 0.25) and B) downregulated (NES <−2.15, FDR < 0.25) by AZA in breast, colorectal, and ovarian cell lines. Agilent array data were normalized and analyzed by GSEA. Pie charts of gene sets common to all three cancer types that were C) upregulated and D) downregulated show the different categories of the common GSEA pathways. The “Immune” sector is broken down further into specific pathways characterized as part of the interferon response, antigen presentation, cytokines/chemokines, inflammation, and influenza virus. E) Heat maps showing the NES value from GSEA for each cell line (x axis) and each of the 15 immune pathways (y-axis) shown in C. The colored rectangle corresponding to NES is graded from gray (low) to orange (high). Subtypes for each cancer type are coded by the black, grey, and white boxes shown below the figure. F) Summary of GSEA gene sets upregulated by AZA in each cancer type and the percent that were immune-related.
Figure 2
Figure 2. AZA activates diverse pathways involved in the immune response in breast, colorectal, and ovarian cancers
A). Schematic of the interferon response to pathogens in an epithelial cell. Arrows next to gene names indicate that they are upregulated twofold by AZA in breast (red), colorectal (blue), or ovarian (green) cell lines. B) Upregulation of immune genes by AZA treatment in two cell lines from each tumor type (red = breast cancer, green = ovarian cancer, blue = colorectal cancer). Yellow bars denote the fold change of the DKO cell line (haploinsufficient for DNMT1 and null for DNMT3) compared to the parent HCT116 cell line. Y-axis represents AZA/Mock fold change (log2). C) qRT-PCR validations of genes from 2B. Y-axis represents AZA/Mock fold change (linear). Cell lines are the same colors as in 2B. Each bar represents the average and standard deviation of three biological replicates.
Figure 3
Figure 3. AZA activates genes involved in antigen presentation and processing in breast, colorectal, and ovarian cancers
A) Schematic of antigen processing. Arrows next to gene names indicate that they are upregulated twofold by AZA in breast (red), colorectal (blue), or ovarian (green) cell lines. B) Upregulation of antigen presentation genes by AZA treatment in two cell lines from each tumor type (red = breast cancer, blue = colorectal cancer, green = ovarian cancer). Yellow bars denote the fold change of the DKO cell line (haploinsufficient for DNMT1 and null for DNMT3) compared to the parent HCT116 cell line. C) qRT-PCR validations of genes from 3b. HLA-C was undetectable by qRT-PCR in HCC1569, ZR751, and HT29. Each bar represents the average and standard deviation of three biological replicates.
Figure 4
Figure 4. The AIM 317 gene panel clusters TCGA and GEO tumors into high and low immune signatures
Tumors from The Cancer Genome Atlas (TCGA) cluster into “high” and “low” immune groups based on the AIM genes. The bars on the far left show the five sets of AIM genes driving the clustering, interferon, antigen, cytokines/chemokines, inflammation and influenza. The shades of blue bars at the top denote tumor vs. normal, stage, and receptor status for breast cancer, CIMP, stage, and colon vs rectum for colon/rectum cancer, and stage for ovarian cancer. The heat map shows transcript levels from green (low) to red (high). A) breast cancers; B) colorectal cancers; C) ovarian cancers. Tumors from publicly available (GEO) data sets show similar clustering: D) breast cancers; E) colorectal cancers; F) ovarian cancers.
Figure 5
Figure 5. Core biopsies from breast and colorectal cancer patients treated with AZA/entinostat show upregulation of the AIM genes
A) Summary of GSEA gene sets upregulated and downregulated by AZA/entinostat in breast and colorectal cancer biopsies. Percentages of gene sets that are immune-related are listed. Heat maps for B) triple negative breast and C) colorectal cancer trial samples. Each pair includes “Pre” (baseline or before AZA/entinostat treatment) and “Post” = 8 weeks after AZA/entinostat treatment) and depicts levels of AIM genes (listed on the left). D-E). Bar plots for each breast cancer (D) or colorectal cancer (E) patient biopsy represent a log2 (Pre/Post) fold change (y axis) of individual genes in the GSEA interferon signaling and antigen presentation gene sets. Breast cancer patient #5 6 mo) represents the 6 month post biopsy specimen.

Similar articles

Cited by

References

    1. Baylin SB, Jones PA. A decade of exploring the cancer epigenome - biological and translational implications. Nature reviews Cancer. 2011;11(10):726–734. - PMC - PubMed
    1. Kaminskas E, Farrell A, Abraham S, Baird A, Hsieh LS, Lee SL, Leighton JK, Patel H, Rahman A, Sridhara R, Wang YC, Pazdur R. Approval summary: azacitidine for treatment of myelodysplastic syndrome subtypes. Clinical cancer research : an official journal of the American Association for Cancer Research. 2005;11(10):3604–3608. - PubMed
    1. Juergens RA, Wrangle J, Vendetti FP, Murphy SC, Zhao M, Coleman B, Sebree R, Rodgers K, Hooker CM, Franco N, Lee B, Tsai S, Delgado IE, Rudek MA, Belinsky SA, Herman JG, et al. Combination epigenetic therapy has efficacy in patients with refractory advanced non-small cell lung cancer. Cancer discovery. 2011;1(7):598–607. - PMC - PubMed
    1. Matei D, Fang F, Shen C, Schilder J, Arnold A, Zeng Y, Berry WA, Huang T, Nephew KP. Epigenetic resensitization to platinum in ovarian cancer. Cancer research. 2012;72(9):2197–2205. - PMC - PubMed
    1. Wrangle J, Wang W, Koch A, Easwaran H, Mohammad HP, Vendetti F, Vancriekinge W, Demeyer T, Du Z, Parsana P, Rodgers K, Yen RW, Zahnow CA, Taube JM, Brahmer JR, Tykodi SS, et al. Alterations of immune response of non-small cell lung cancer with Azacytidine. Oncotarget. 2013 - PMC - PubMed

Publication types

MeSH terms

Associated data