. 2014 Apr;17(4):513-21.
doi: 10.1038/nn.3668. Epub 2014 Mar 2.

Mutant Huntingtin promotes autonomous microglia activation via myeloid lineage-determining factors

Affiliations

Mutant Huntingtin promotes autonomous microglia activation via myeloid lineage-determining factors

Andrea Crotti et al. Nat Neurosci. 2014 Apr.

Abstract

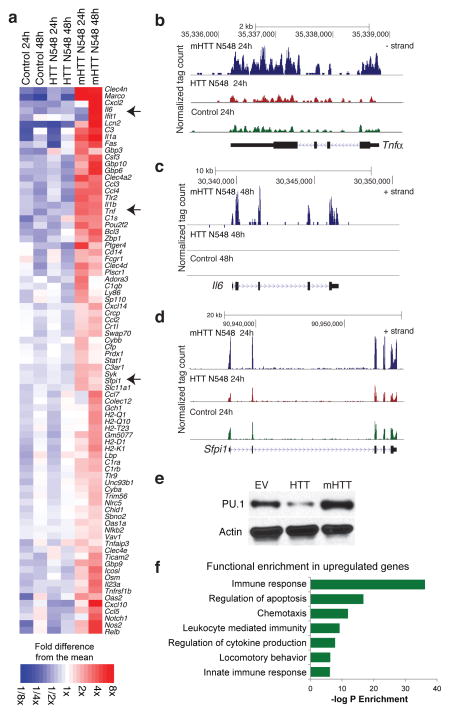
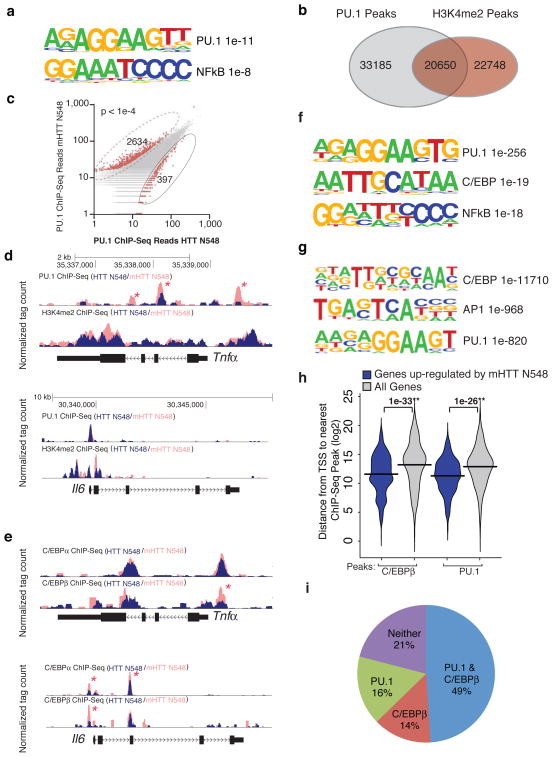
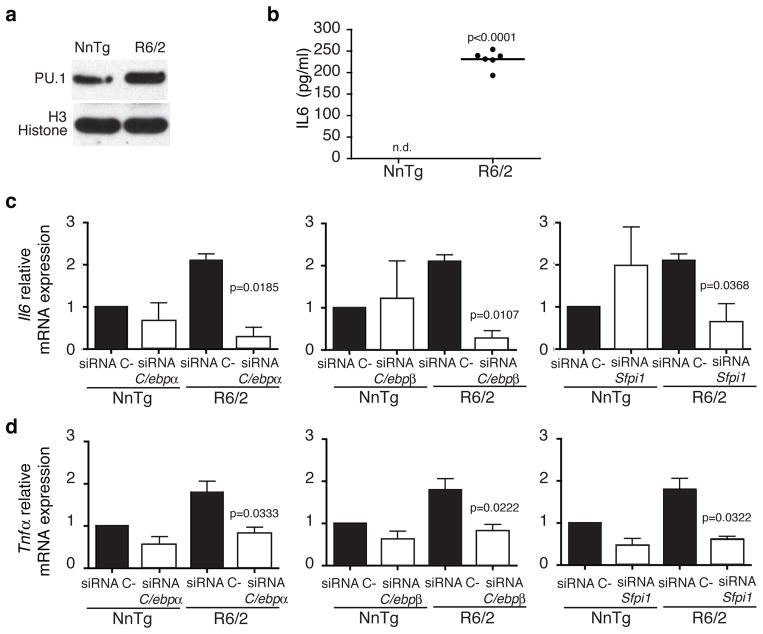
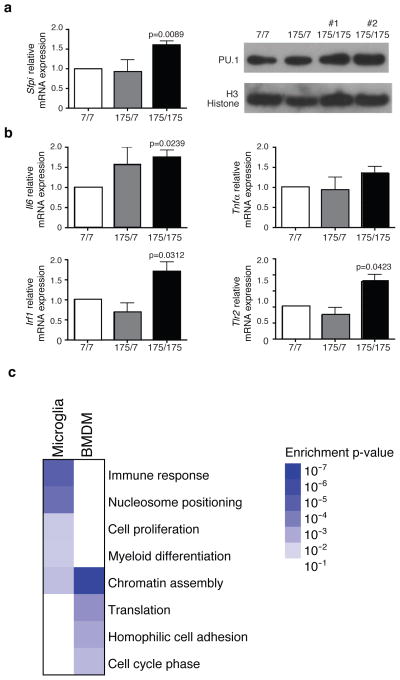
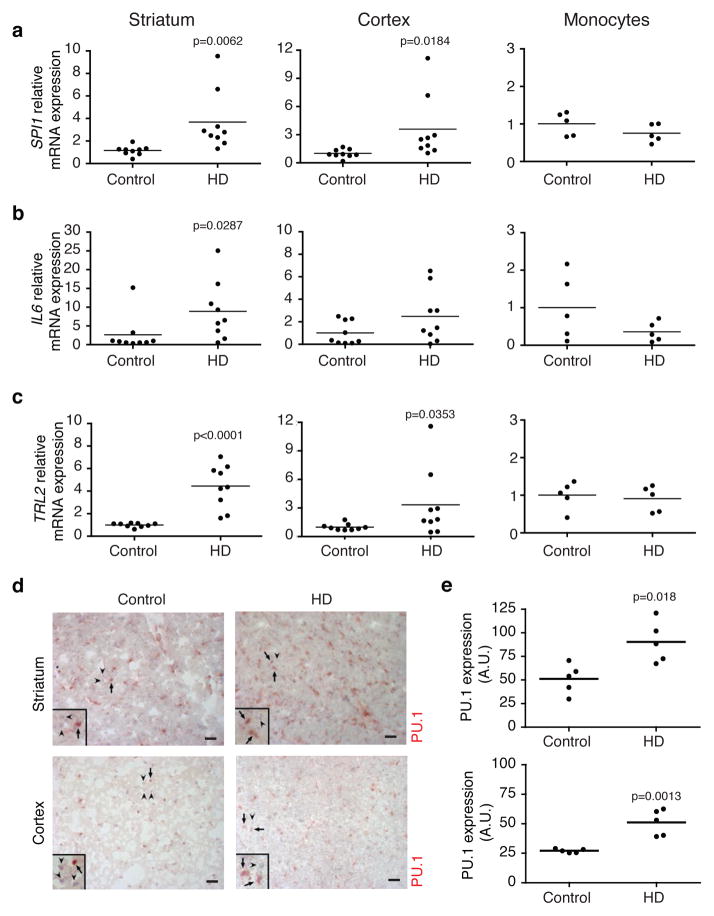
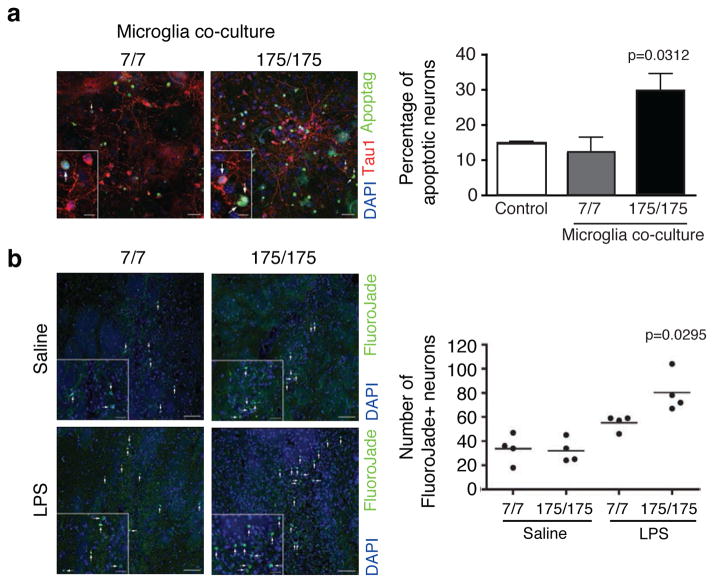
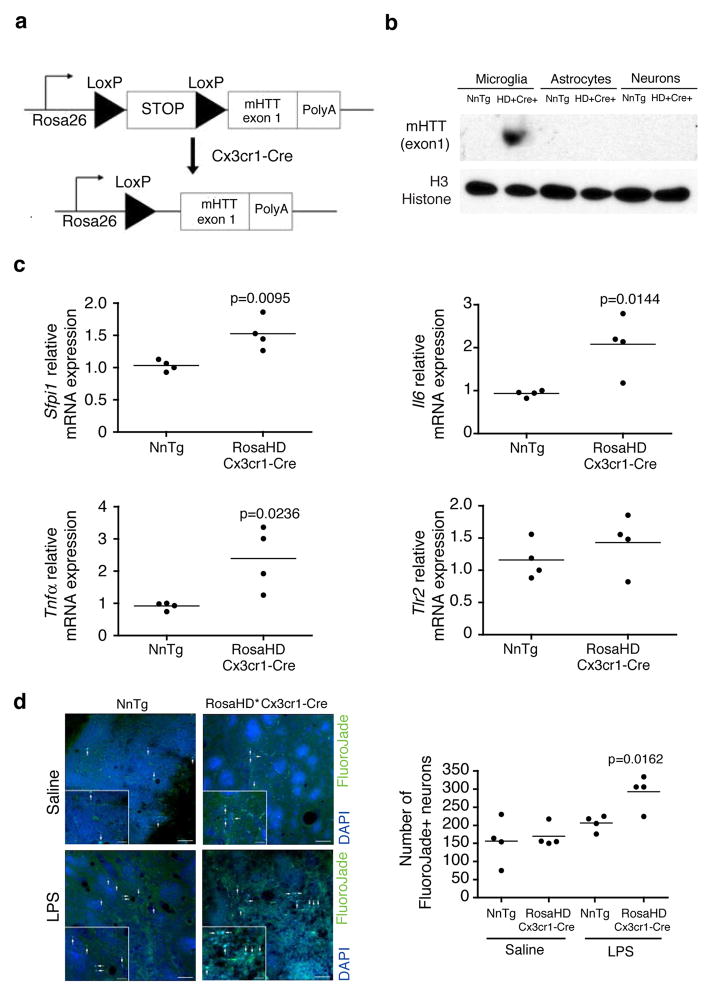
Huntington's disease (HD) is a fatal neurodegenerative disorder caused by an extended polyglutamine repeat in the N terminus of the Huntingtin protein (HTT). Reactive microglia and elevated cytokine levels are observed in the brains of HD patients, but the extent to which neuroinflammation results from extrinsic or cell-autonomous mechanisms in microglia is unknown. Using genome-wide approaches, we found that expression of mutant Huntingtin (mHTT) in microglia promoted cell-autonomous pro-inflammatory transcriptional activation by increasing the expression and transcriptional activities of the myeloid lineage-determining factors PU.1 and C/EBPs. We observed elevated levels of PU.1 and its target genes in the brains of mouse models and individuals with HD. Moreover, mHTT-expressing microglia exhibited an increased capacity to induce neuronal death ex vivo and in vivo in the presence of sterile inflammation. These findings suggest a cell-autonomous basis for enhanced microglia reactivity that may influence non-cell-autonomous HD pathogenesis.


Conflict of interest statement

COMPETING FINANCIAL INTERESTS:

The authors declare no competing financial interests.

Figures

Figure 1
Figure 1
RNA-Seq analysis reveals that Mutant Huntingtin N-terminus expression triggers pro-inflammatory gene expression in BV2 microglia. (a) Heatmap representing RNA-Seq gene expression of up-regulated inflammatory genes in BV2 microglia cell lines transduced with lentivirus expressing mHTT N548 in comparison to empty vector (Control) and expressing HTT N548 at 24 and 48h after plating. (bd) UCSC Browser images representing normalized RNA-Seq read density from BV2 microglia cell lines transduced with empty vector (Control), HTT N548 or mHTT N548 mapped at the (b) Tnfα, (c) Il6 and (d) Spfi1 (PU.1) genomic loci. (e) Western blots of PU.1 expression in BV2 microglia cell lines transduced with lentivirus empty vector (EV), HTT N548 or HTT N548 expression vectors. One representative experiment out of 3 biological replicates. Image shown has been cropped from the original one. Full-length blot is presented in Supplementary Figure 8. (f) Gene Ontology analysis of functional annotations associated with up-regulated genes in BV2 microglia expressing mutant Huntingtin in comparison to wild-type Huntingtin.
Figure 2
Figure 2
Mutant Huntingtin promotes pro-inflammatory gene expression via PU.1 and C/EBPs. (a) Motif enrichment in promoters of up-regulated genes in BV2 microglia expressing mHTT N548 in comparison to HTT N548. (b) Venn diagram representing the overlap between PU.1 peaks and H3K4me2 peaks in BV2 cells expressing HTT N548 as detected by Chip-Seq. (c) Scatter Plot of normalized tag counts for PU.1 peaks detected in microglia cell lines overexpressing wild-type vs mutant Huntingtin (data points color-coded red indicate >4 fold difference, p-value < 1e−4) (d) PU.1 and H3K4me2 Chip-Seq read density from BV2 microglia overexpressing wild-type vs mutant Huntingtin at the Tnfα and Il6 loci. Asterisks denote differential PU.1 binding. (e) Motif enrichment at PU.1 peaks specific for BV2 cells expressing mHTT N548. (f) C/EBPα,β Chip-seq read density from BV2 microglia overexpressing wild-type vs mutant Huntingtin at the Tnfα and Il6 loci. Asterisks denote differential C/EBP binding. (g) Motif enrichment at C/EBPβ peaks in BV2 cells expressing mHTT N548. (h) Distribution of distances from either mHTT N548 up-regulated genes’ promoters or all promoters to the nearest C/EBPβ and PU.1 Chip-Seq peaks. (i) Pie diagram representing the fraction of genes up-regulated by the presence of mHTT N548 with a C/EBPβ and/or PU.1 peak within 5kb of the TSS.
Figure 3
Figure 3
PU.1 and PU.1-C/EBPs target genes are upregulated in primary microglia from R6/2 mice. (a) PU.1 expression in P0 primary microglia purified from nontransgenic littermates and R6/2 pups. Immunoblot represents lysates of pool of microglia cells obtained from 5 pups per group. Image shown has been cropped from the original one. Full-length blot is presented in Supplementary Figure 8. (b) IL6 protein secretion in culture supernatant from P0 primary microglia from R6/2 pups and nontransgenic littermates. Graph represents pg/ml of IL6 in pooled microglia culture supernatants from 5 pups respectively in each biological replicate, (n= 3 biological replicates, n.d.=not detected). qRT-PCR analysis for Il6 (c) and Tnαf (d) mRNAs expression levels in presence of C/ebpα,β or Spfi1 siRNAs respectively in nontransgenic littermates and R6/2 primary microglia (mean±sd, n= 3 biological replicates). In all cases p values were calculated using the two-tailed paired student t-test. Each experiment is representative of at least three independent replicates.
Figure 4
Figure 4
PU.1 and PU.1-C/EBPs target genes are up-regulated in primary microglia from Hdh175/175 Knock-in mice. (a) qRT-PCR analysis for Spfi1 (PU.1) mRNA and protein expression in primary microglia purified from Hdh7/7, Hdh175/7 and Hdh175/175 newborn (P0) pups (mean±sd, n= 3 biological replicates). Image shown has been cropped from the original one. Full-length blot is presented in Supplementary Figure 8. (b) qRT-PCR analysis for Il6, Tnfα, Irf1 and Tlr2 mRNAs expression in primary microglia purified from Hdh7/7, Hdh175/7 and Hdh175/175 pups (mean±sd, n= 3 biological replicates). All p values were determined by two-tailed paired student t-test. (c) Gene Ontology analysis reporting the biological processes enriched in genes up-regulated in Hdh175/175 versus Hdh7/7 for microglia and BMDM obtained from adult mice (18–20 months old). RNAseq results are based on mRNA extraction from pooled microglia cells or BMDM obtained from 4 mice per group.
Figure 5
Figure 5
Inflammation in vivo in HD individuals. qRT-PCR analysis for SPI1(a), IL6 (b) and TLR2 (c), mRNAs expression in striatum (first column, n= 9 individual specimen per group), cortex (second column, n= 9 individual specimen per group) and monocytes (third column, n= 5 individual specimen per group) from controls and HD individuals (Vonsattel Grade 3 and 4). Each dot is representative of one individual. All p values were determined by unpaired student t-test. (d) PU.1 IHC staining on post-mortem frozen samples of striatum (Caudate/Putamen) and cortex (Brodman Area 4) from HD (n=5, Vonsattel Grade 3) and matching controls (n=5). One representative picture is shown for each group. (e) Densitometric analysis of PU.1 staining. Each dot is representative of PU.1 expression of one individual. (n= 5 individual specimen per group). Arbitrary Unit is defined by the number of pixels representing the area of PU.1 staining normalized by the number of PU.1+ microglia cells. PU.1+ microglia cells were distinguished morphologically from endothelial cells. All p values were determined by unpaired student t-test. Scale bar: 100μm. Insets highlight PU.1+ cells. Arrows in representative pictures and insets for each condition point to PU.1+ nuclei, arrowheads point to PU.1 nuclei.
Figure 6
Figure 6
Effect of mutant Huntingtin expressing microglia on primary neurons ex vivo and in vivo. (a) TUNNEL assay for neurons/astrocytes/microglia co-culture in presence of primary microglia from wild-type Hdh7/7 or homozygous mutant Huntingtin knock-in mice (Hdh175/175). Arrows in representative pictures for each condition point to apoptotic neurons. Insets highlight TUNEL positive neurons. Scale bar: 30μm in panels and 10μm in insets. Quantitative representation of the percentage of Apoptag+ neurons, obtained by the ratio between the number of triple positive cells (Apoptag+, TAU1+ and DAPI+ cells)/total number of double positive (TAU1+ and DAPI+) cells, (mean±sd, n= 3 biological replicates) with pools of microglia from 4 pups per group. Ctrl represents neurons/astrocytes co-cultured without microglia added. p value was determined by one-tailed paired student t-test. (b) FluoroJadeB staining of coronal brain sections from wild-type (Hdh7/7) or homozygous mutant Huntingtin knock-in mice (Hdh175/175) injected with saline solution or LPS (5μg). One representative image for each condition is shown (left). Arrows in representative pictures and insets for each condition point to FluoroJadeB+ neurons. Scale bar: 50μm in panels and 20μm in insets. Quantitative representation of the number of FluoroJadeB+ degenerated/dead neurons (right). Each dot represents the number of FlurojadeB+ neurons per mouse (n=4 mice per group, one-way Anova and Tukey’s post-hoc test).
Figure 7
Figure 7
Effect of mutant Huntingtin expressing microglia on primary wild-type neurons in vivo. (a) The schematics of conditional HD mice in which expression of mHTT (exon 1) was dependent on the expression of Cx3cr1-driven Cre recombinase. Mutant huntingtin (exon 1) is targeted to the Rosa26 locus. The targeted locus contains the endogenous Rosa26 promoter, a transcriptional STOP sequence, two loxP sites (black triangles), mHTT exon 1 with 103 mixed CAA-CAG repeat (encoding for poly glutamine expansion) and a poly-adenylation signal (PolyA). (b) mHTT (exon 1) protein expression in primary microglia, astrocytes and neurons purified from RosaHD+ x Cx3cr1-Cre+ and nontrasngentic littermates. Immunoblot represents lysates of pool of microglia, astrocytes and neurons respectively obtained from 4 pups per group. Image shown has been cropped from the original one. Full-length blot is presented in Supplementary Figure 8. (c) qRT-PCR analysis for Sfpi1, Il6, Tnfα and Tlr2 mRNAs expression in striatum from 8 weeks old non-transgenic littermates and RosaHD x Cx3cr1-Cre mice. Each dot is representative of one mouse. All p values were determined by unpaired student t-test (n=4 mice per group). (d) FluoroJadeB staining of coronal brain sections from nontransgenic Littermates or RosaHD x Cx3cr1-Cre mice injected with saline solution or LPS (5μg). One representative image for each condition is shown (left). Arrows in representative pictures and insets for each condition point to FluoroJadeB+ neurons. Scale bar: 50μm in panels and 20μm in insets. Quantitative representation of the number of FluoroJadeB+ degenerated/dead neurons (right). For details about counting procedure see Material and Methods section. Each dot represents the number of FlurojadeB+ neurons per mouse (n=4 mice per group, one-way Anova and Tukey’s post-hoc test).

Similar articles

Cited by

References

    1. Streit WJ, Walter SA, Pennell NA. Reactive microgliosis. Prog Neurobiol. 1999;57:563–581. - PubMed
    1. Samii A, Nutt JG, Ransom BR. Parkinson’s disease. Lancet. 2004;363:1783–1793. - PubMed
    1. Schellenberg GD, Montine TJ. The genetics and neuropathology of Alzheimer’s disease. Acta Neuropathol. 2012;124:305–323. - PMC - PubMed
    1. HDRCG A novel gene containing a trinucleotide repeat that is expanded and unstable on Huntington’s disease chromosomes. Cell. 1993;72:971–983. - PubMed
    1. Reiner A, et al. Differential loss of striatal projection neurons in Huntington disease. Proc Natl Acad Sci U S A. 1988;85:5733–5737. - PMC - PubMed

Publication types

MeSH terms

Associated data