. 2014 Apr;46(4):364-70.
doi: 10.1038/ng.2913. Epub 2014 Mar 2.

An epigenetic mechanism of resistance to targeted therapy in T cell acute lymphoblastic leukemia

Affiliations

An epigenetic mechanism of resistance to targeted therapy in T cell acute lymphoblastic leukemia

Birgit Knoechel et al. Nat Genet. 2014 Apr.

Abstract

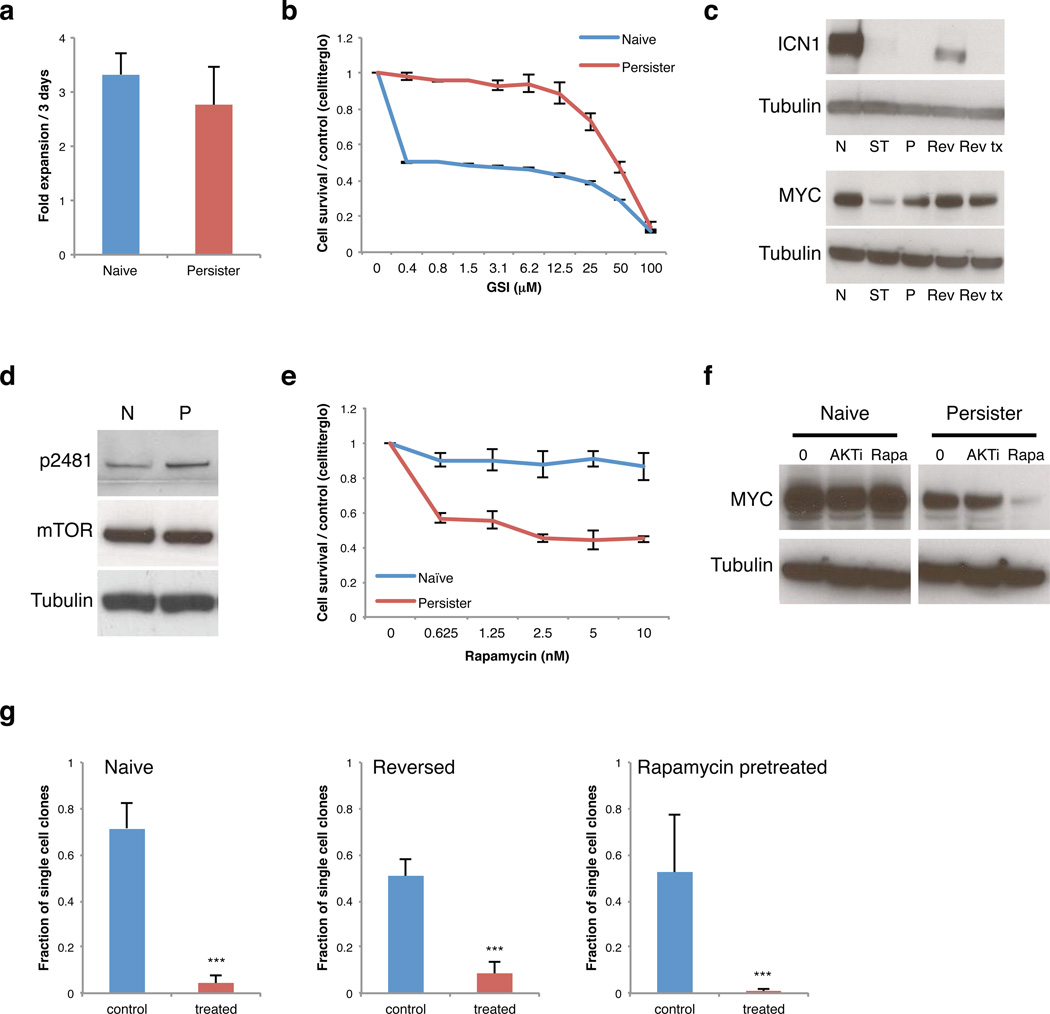
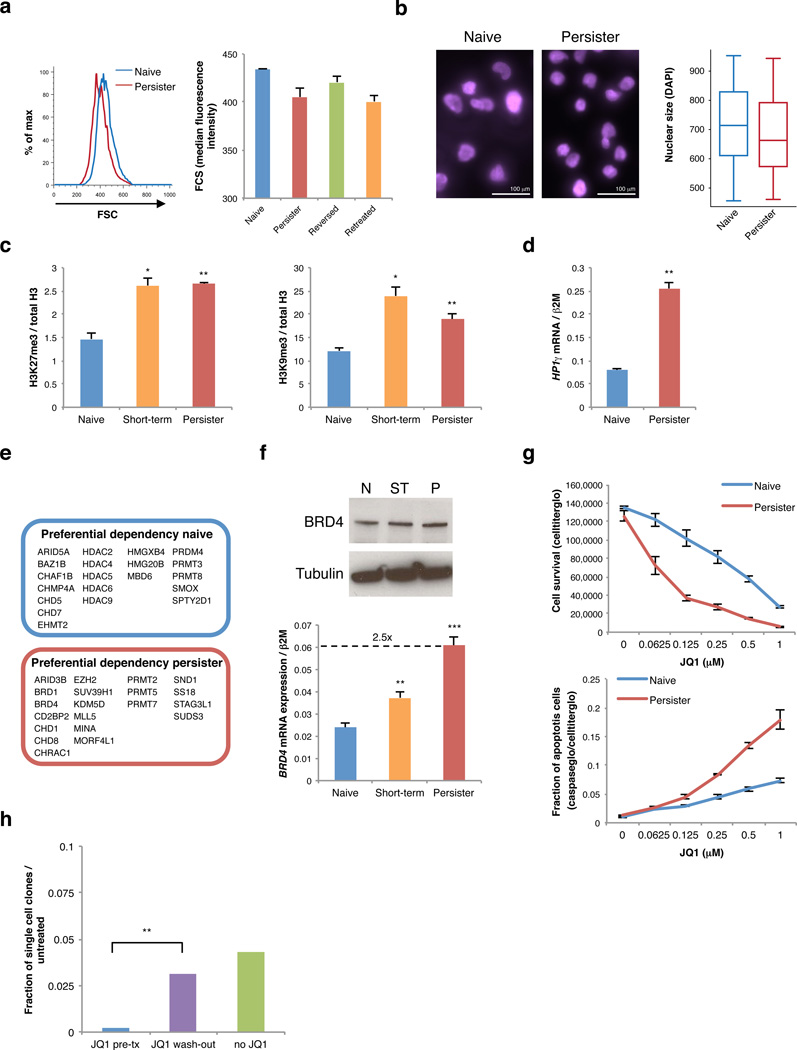
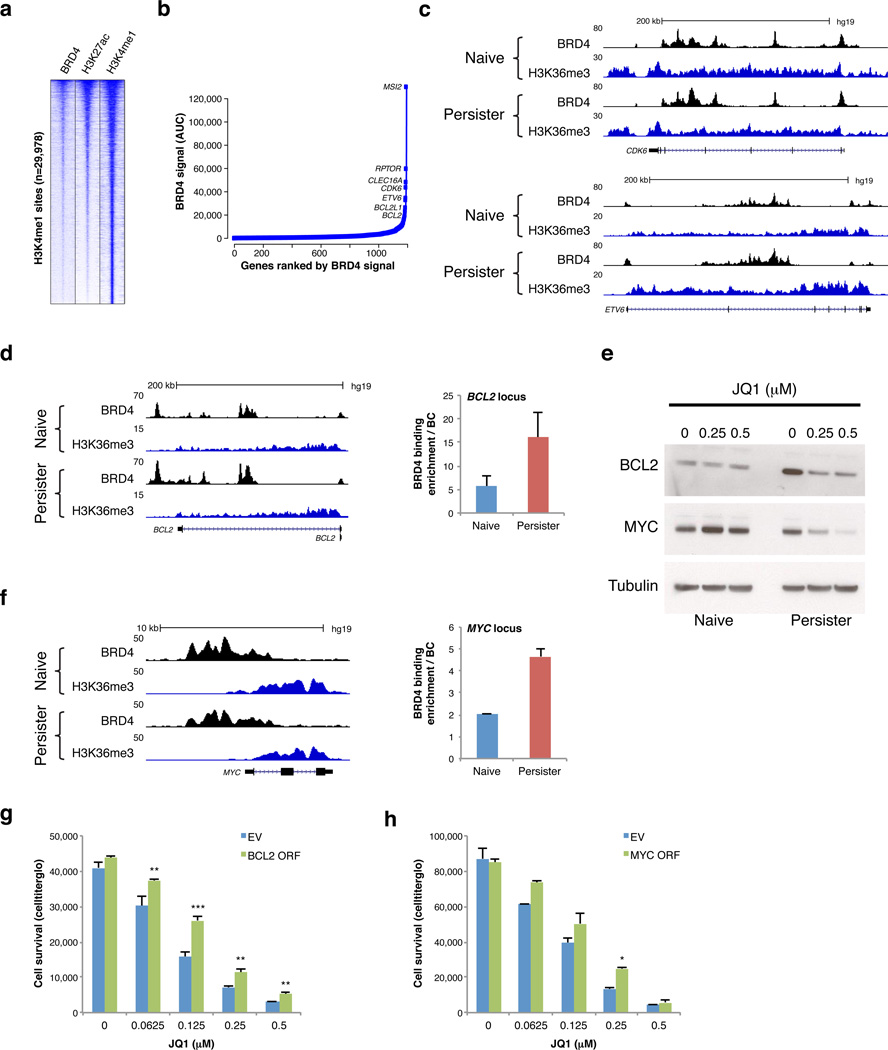
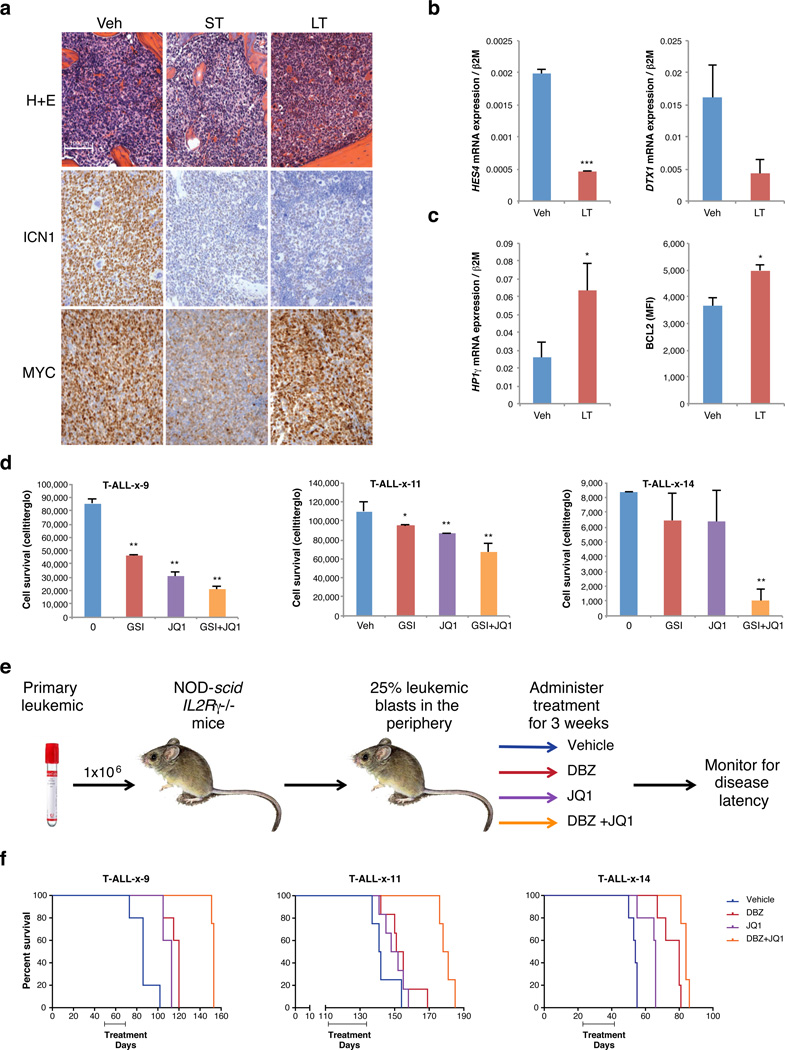
The identification of activating NOTCH1 mutations in T cell acute lymphoblastic leukemia (T-ALL) led to clinical testing of γ-secretase inhibitors (GSIs) that prevent NOTCH1 activation. However, responses to these inhibitors have been transient, suggesting that resistance limits their clinical efficacy. Here we modeled T-ALL resistance, identifying GSI-tolerant 'persister' cells that expand in the absence of NOTCH1 signaling. Rare persisters are already present in naive T-ALL populations, and the reversibility of their phenotype suggests an epigenetic mechanism. Relative to GSI-sensitive cells, persister cells activate distinct signaling and transcriptional programs and exhibit chromatin compaction. A knockdown screen identified chromatin regulators essential for persister viability, including BRD4. BRD4 binds enhancers near critical T-ALL genes, including MYC and BCL2. The BRD4 inhibitor JQ1 downregulates expression of these targets and induces growth arrest and apoptosis in persister cells, at doses well tolerated by GSI-sensitive cells. Consistently, the GSI-JQ1 combination was found to be effective against primary human leukemias in vivo. Our findings establish a role for epigenetic heterogeneity in leukemia resistance that may be addressed by incorporating epigenetic modulators in combination therapy.


Figures

Figure 1
Figure 1. A sub-population of drug tolerant T-ALL cells mediates resistance to NOTCH inhibition
a. Bar plot compares expansion rates of naïve T-ALL cells (grown in the absence of GSI) to persister cells grown continuously in 1 µM GSI (2 replicates, error bar reflect s.d.). b. Proliferation of naïve and persister cells treated with the indicated doses of NOTCH inhibitor for 6 days (2 replicates, error bars reflect s.d.). c. Western blot shows activated intracellular NOTCH1 (ICN1) and MYC levels in naïve cells (N), short-term treated cells (ST, 5 days of 1 µM GSI), persister cells in 1 µM GSI (P), ‘reversed’ persister cells removed from GSI for 2 weeks (Rev), and reversed cells re-exposed to GSI (Rev tx, 5 days). Reactivation of NOTCH signaling in reversed cells suggests that the persister phenotype is reversible. d. Western blot shows phospho-mTOR (p2481), a marker of activated mTOR signaling, total mTOR and Tubulin in naïve (N), and persister (P) cells. e. Proliferation of naïve and persister cells treated with indicated concentrations of Rapamycin for 6 days (4 replicates, error bar reflect s.d.). f. Western blots show MYC expression in naïve and persister cells after 3 days treatment with 2 µM AKT inhibitor, MK-2206 (AKTi), or 10 nM mTOR inhibitor, Rapamycin (Rapa). (Data shown for DND-41 cells; Data for KOPT-K1 in Figure S2). g. Rare drug tolerant cells pre-exist in naïve T-ALL populations. Single cells from a naïve DND-41 population, a reversed population (reversed for 1 month) or a naïve population pre-treated with 10 nM Rapamycin for 3 days were sorted into individual wells of 96 well plates and cultured in 1 µM GSI (treated) or without drug (control) for 4 – 6 weeks. Bar plot indicates the fraction of single cells that form colonies (sorted single cells per condition: naïve n = 936, reversed n = 936, Rapamycin pretreated n = 858, pooled from 2 independent experiments; *** = p value < 0.001, error bars reflect s.d.). These data suggest that GSI tolerance is already evident in a small fraction of naïve T-ALL cells and is reversible.
Figure 2
Figure 2. Drug tolerant T-ALL cells adopt an altered chromatin state and are BRD4 dependent
a. Forward scatter analysis indicates size distributions of naïve (blue), persister (red), reversed (green) cells, and reversed cells re-exposed to GSI for 5 days (retreated, orange). b. Size of naïve (left) and persister (right) cell nuclei is shown by DAPI stain and quantified in box plot (far right; naïve n = 585, persister n = 496; p value < 10−4). c. Bar plots indicate relative levels of repressive histone modifications per ELISA of bulk histones from naïve, short-term treated (3 days) and persister cells (2 replicates, error bars reflect s.d., * = p value < 0.05, ** = p value < 0.01, *** = p value < 0.001). d. HP1γ mRNA expression shown for naïve and persister T-ALL cells (2 replicates, error bars reflect s.d.). e. shRNA screen identified chromatin regulators preferentially required for naïve or persister cell survival. Top hits for each cell state are indicated. f. BRD4 expression is shown for naïve (N), short-term treated (ST, 5 days) and persister (P) cells (top: protein expression; bottom: mRNA expression, 3 replicates, error bars reflect s.d., ** = p value < 0.01, *** = p value < 0.001). (Data shown for DND-41 cells; Data for KOPT-K1 in Figure S3). g. Proliferation (6 days treatment, 4 replicates) and rate of apoptosis (4 days treatment, 3 replicates) shown for naïve and persister cells treated with indicated doses of JQ1 (error bars reflect s.d.). h. Naïve DND-41 populations were pretreated with 0.5 µM JQ1 for 4 days (JQ1 pre-tx), pretreated with 0.5 µM JQ1 for 4 days but then cultured for 24 hours without JQ1 (JQ1 wash-out), or never exposed to JQ1 (no JQ1). Single cells from each of these populations were sorted into individual wells of 96 well plates and cultured with GSI (1 µM) or without GSI (control) for 6 weeks. Bar plot indicates the fraction of single cells that form colonies in GSI, relative to control (sorted single cells per condition: n = 936, data pooled from 2 independent experiments, error bars reflect s.d.). Pre-treatment with JQ1 eliminates pre-existing GSI tolerant cells from naïve T-ALL populations, but this effect is reversed by 24 hour JQ1 wash-out.
Figure 3
Figure 3. BRD4 binds enhancers near developmental, cell cycle and pro-survival genes in T-ALL
a. Heatmap shows enrichment signals for BRD4, H3K27ac and H3K4me1 over 29,978 H3K4me1-marked distal sites in persister cells (rows; 10 kb regions, centered on H3K4me1 peaks, ranked by overall signal intensities of BRD4 and H3K27ac). b. BRD4 peaks were ranked by signal intensity of area under the curve (AUC) in persister cells averaging BRD4 signal intensities of DND-41 and KOPT-K1 persisters to identify candidate ‘super-enhancers’. Plot depicts top ranked sites linked to an active gene in T-ALL (see Methods). c. Tracks show BRD4 binding and H3K36me3 enrichment (marks transcribed regions) over the CDK6 and ETV6 loci, both of which contain BRD4-bound ‘super-enhancers’. d, f. Tracks show BRD4 binding and H3K36me3 enrichment across the BCL2 and MYC loci in naïve and persister cells (left). Plots (middle) show BRD4 enrichment as measured by ChIP-qPCR over putative regulatory elements in the BCL2 and MYC loci in naïve and persister cells (2 replicates, error bars reflect s.d.). e. Western blots show BCL2 and MYC expression in naïve and persister cells after 4 days treatment with indicated JQ1 doses. (Data shown for KOPT-K1 cells; Data for DND-41 in Figure S5). g. Plot shows relative proliferation of DND-41 persister cells transfected with BCL2 expression vector (BLC2 ORF) or empty vector control (EV) after 6 days treatment with indicated JQ1 doses (3 replicates, error bars reflect s.d., ** = p value < 0.01, *** = p value < 0.001). h. Plot shows relative proliferation of DND-41 persister cells transfected with MYC expression vector (MYC ORF) or empty vector control (EV) after 6 days treatment with indicated JQ1 doses (2 replicates, error bars reflect s.d., * = p value < 0.05).
Figure 4
Figure 4. Combination therapy targeting NOTCH and BRD4 in relapsed/induction failure primary T-ALL
a. NSG mice were injected with luciferase-transfected KOPT-K1 T-ALL cells and leukemic mice were treated with NOTCH inhibitor DBZ for 5 days (ST, 3 doses), DBZ for 3 weeks (LT, every other day dosing), or vehicle (Veh); (5 mice per group). LT mice were harvested when bioluminescence had plateaued and then significantly increased (see methods; Figure S7a). Images show H&E stains and IHC for activated NOTCH1 (ICN1) and MYC of bone marrow from the respective leukemic mice. b. NOTCH1 target gene expression shown for leukemia cells sorted from spleen of vehicle (Veh) or long-term (LT) treated mice. Datapoints reflect averages of 2 – 3 mice (2 replicates, error bars reflect s.d., * = p value < 0.05, ** = p value < 0.01, *** = p value < 0.001). c, left. HP1γ expression shown for leukemia cells as in panel b. c, right. Intracellular BCL2 expression measured by flow cytometry shown for leukemia cells as in panel b. d. Proliferation of three primary T-ALLs grown in vitro for 6 days in the presence of 1 µM GSI, 0.25 µM JQ1 or both compounds (2 – 3 replicates, error bars reflect s.d.). e. Experimental design for primary T-ALL xenotransplantation trials. Primary T-ALL samples from three primary pediatric T-ALLs (T-ALL-x-9, T-ALL-x-11 and T-ALL-x-14; see Table S4) were transplanted into NSG mice. Once leukemic burden reached 25% in peripheral blood by human CD45 staining, mice were randomized into 4 treatment groups (vehicle, JQ1, DBZ or DBZ+JQ1 combination). Mice were treated for 3 consecutive weeks, and were then monitored for disease and sacrificed when they became moribund. f. Kaplan-Meier survival curves for sample T-ALL-x-9, T-ALL-x-11 and T-ALL-x-14 (p value < 0.01 as assessed by the log-rank test, for details see Table S4; 4–5 mice per group). Combination treatment significantly prolonged survival over single agents and vehicle in all three trials.

Similar articles

Cited by

References

    1. Weng AP, et al. Activating mutations of NOTCH1 in human T cell acute lymphoblastic leukemia. Science. 2004;306:269–271. - PubMed
    1. Ellisen LW, et al. TAN-1, the human homolog of the Drosophila notch gene, is broken by chromosomal translocations in T lymphoblastic neoplasms. Cell. 1991;66:649–661. - PubMed
    1. Pui CH, Evans WE. Treatment of acute lymphoblastic leukemia. The New England journal of medicine. 2006;354:166–178. - PubMed
    1. Rao SS, et al. Inhibition of NOTCH signaling by gamma secretase inhibitor engages the RB pathway and elicits cell cycle exit in T-cell acute lymphoblastic leukemia cells. Cancer research. 2009;69:3060–3068. - PubMed
    1. Palomero T, Ferrando A. Therapeutic targeting of NOTCH1 signaling in T-cell acute lymphoblastic leukemia. Clinical lymphoma & myeloma. 2009;9(Suppl 3):S205–S210. - PMC - PubMed

Publication types

MeSH terms

Associated data