. 2014 Apr;15(4):365-372.
doi: 10.1038/ni.2842. Epub 2014 Mar 2.

Early specification of CD8+ T lymphocyte fates during adaptive immunity revealed by single-cell gene-expression analyses

Affiliations

Early specification of CD8+ T lymphocyte fates during adaptive immunity revealed by single-cell gene-expression analyses

Janilyn Arsenio et al. Nat Immunol. 2014 Apr.

Abstract

T lymphocytes responding to microbial infection give rise to effector cells that mediate acute host defense and memory cells that provide long-lived immunity, but the fundamental question of when and how these cells arise remains unresolved. Here we combined single-cell gene-expression analyses with 'machine-learning' approaches to trace the transcriptional 'roadmap' of individual CD8(+) T lymphocytes throughout the course of an immune response in vivo. Gene-expression signatures predictive of eventual fates could be discerned as early as the first T lymphocyte division and may have been influenced by asymmetric partitioning of the receptor for interleukin 2 (IL-2Rα) during mitosis. Our findings emphasize the importance of single-cell analyses in understanding fate determination and provide new insights into the specification of divergent lymphocyte fates early during an immune response to microbial infection.


Figures
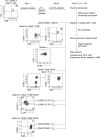
Figure 1
Figure 1
Gating strategy and experimental approach for single-cell gene expression analyses of CD8+ T cell subsets isolated from uninfected (naïve, CD8+CD44loCD62Lhi) or CD45.2 recipient mice infected with Lm-OVA 24h after intravenous adoptive transfer of unlabeled or CFSE-labeled CD45.1+OT-1 CD8+ T cells. CD8+ T cell subsets were isolated at various time points post-infection: division 1 (CD8+CD45.1+CD44hi cells within 2nd brightest CFSE peak); days 3, 5, and 7 post-infection; day 7 short lived effector (Tsle) (CD8+CD45.1+CD44hiKLRG1hiIL-7Rlo), day 7 putative memory precursor (Tmp) (CD8+CD45.1+CD44hiKLRG1loIL-7Rhi), day 45 central memory (Tcm) (CD8+CD45.1+CD44hiCD62Lhi), and day 45 effector memory (Tem) (CD8+CD45.1+CD44hiCD62Llo). Data are representative of three experiments. Data analysis approaches included unsupervised Principal Component analysis (PCA) and Jensen-Shannon Divergence (JSD), and supervised binary classifier and Hidden Markov Model (HMM).
Figure 2
Figure 2
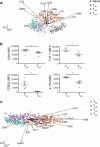
Effector and memory CD8+ T lymphocyte subsets are molecularly distinct on a single-cell level. (a) Principal component (PC) projections (PC1, horizontal axis; PC2, vertical axis) of single-cell gene expression data derived from individual lymphocytes from the indicated populations. Each circle represents an individual cell of the indicated population: naïve (gray), Tsle (green), Tcm (orange), and Tem (purple) cells. Each vector emanating from the origin represents an individual gene. PC1 and PC2 account for 11% and 9% of the variance, respectively. (b) Mean fluorescence intensity (MFI) of CD8 (Cd8a), TCF-1 (Tcf7), CD62L (Sell), and IL-7R (Il7r) protein expression in Tcm and Tem cells, assessed by flow cytometry. * P < 0.05, ** P < 0.01 (Kolmogorov-Smirnov test). Data are representative of two experiments with at least 3 mice in each experiment (error bars, s.e.m.). (c) PC projections of single-cell gene expression data derived from individual lymphocytes from the indicated populations: Tmp (pink), Tsle (green), Tcm (orange), and Tem (purple) cells. Each vector emanating from the origin represents an individual gene. PC1 and PC2 account for 11% and 6% of the variance, respectively.
Figure 3
Figure 3
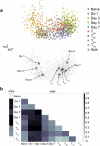
Early heterogeneity of gene expression exhibited by individual CD8+ T lymphocytes during an immune response. (a) Projections of single-cell gene expression data derived from individual lymphocytes from the indicated populations (top). Each circle represents an individual cell of the indicated population representing: naïve (gray), division 1 (brown), day 3 (yellow), day 5 (light green), day 7 (green), Tmp (pink), Tsle (teal), Tcm (orange), and Tem (purple) cells. PC1 and PC2 account for 10% and 7% of the variance, respectively. Analysis derived from pooled “bulk” samples from each experimental condition, shown as colored stars (bottom). Stars filled with each color represent “bulk” naïve (gray), division 1 (brown), day 3 (yellow), day 5 (light green), day 7 (green), Tmp (pink), Tsle (teal), Tcm (orange), and Tem (purple) cells with grayed-out single-cell data points in the background for clarity. (c) Intra- (left) and inter-population (right) Jensen-Shannon Divergence (JSD) of mean gene expression within and between the indicated CD8+ T cell populations is shown.
Figure 4
Figure 4
Classifier analysis predicts eventual fates of individual CD8+ T lymphocytes. (a) Predictions by the classifier on sort-purified Tcm and Tsle cells that were cross-validated during training. Horizontal red lines indicate the voting margin for each individual cell and internal confidence of the classifier’s prediction for that cell; percentages indicate rate of misclassification of a Tsle as Tcm and of a Tcm as Tsle. (b) Binary classifier trained to distinguish between a pair of differentiated cell fates (Tcm vs. Tsle). Single vertical lines along the x-axis represent each individual sort-purified Tcm or Tsle cell and its expression of each gene. (c) Individual CD8+ T cells (horizontal blue lines) from the indicated populations (cells isolated at day 5 or 7 post-infection; proximal (“prox”) or distal daughter (“distal”) cells at the first division) were interrogated by the classifier and predictions were sorted by confidence from the most Tcm-like to most Tsle-like cells. Percentages indicate proportion of cells predicted to be more Tcm-like (left) or Tsle-like (right) within each cell population. (d) Violin plots showing expression levels of the indicated genes by first division proximal (blue) and distal daughter (red) cells. Black crosses and squares represent mean and mode values, respectively.
Figure 5
Figure 5
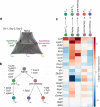
Temporal model predicts the differentiation paths of individual CD8+ T lymphocytes. (a) Cells in early states of differentiation (division 1, day 3, day 5) were ranked by their Tsle- or memory-like expression profiles (green to purple gradient in middle row). Cells were then linked to sorted naïve (black top row) and sorted Tsle, Tem and Tcm cells (green to purple to orange gradient in bottom row) in a random fashion, forming hypothetical differentiation paths (black lines) that were analyzed with a Hidden Markov Model. (b) Most likely model of CD8+ T lymphocyte differentiation with key gene expression changes associated with each of 5 unique transitions: naïve to pre-Tsle, naïve to pre-memory, pre-Tsle to Tsle, pre-memory to Tcm, and pre-memory to Tem. Colored circles represent each cell state or fate. (c) Summary of key changes in gene expression during each transition phase predicted by temporal model of CD8+ T lymphocyte differentiation.
Figure 6
Figure 6
Asymmetric segregation of IL-2Rα during T lymphocyte division influences the eventual fates of the daughter cells. (a) IL-2Rα and CD62L expression (left) by OT-1 CD8+ T cells undergoing their first division following adoptive transfer into recipients and subsequent infection with Lm-OVA 24h later. Frequencies of IL-2RαloCD62Lhi and IL-2RαhiCD62Llo cells (right); each circle represents an individual mouse and lines indicate the mean. (b) Frequencies of IFN-γ and granzyme B expression by IL-2RαloCD62Lhi and IL-2RαhiCD62Llo cells as in (a). (c) CD62L expression (left) on d49 post-infection by CD45.1+CD8+ T cells in CD45.2+ mice (n=13) that had been previously challenged with Lm-OVA and injected with sort-purified 1st division IL-2RαloCD62Lhi or IL-2RαhiCD62Llo cells 48h later. Frequencies of CD62L+ cells (right); each circle represents an individual mouse and lines indicate the mean. (d) Expansion of CD45.1+CD8+ T cells, assessed by serial bleeding, in mice depicted in (c) that were subsequently re-challenged with Lm-OVA at d50 post-primary infection. (e) Morphology of IL-2Rα (green, top panel) or CD62L (green, bottom panel), β-tubulin (red), and DNA (blue), assessed by confocal microscopy, in sorted OT-1 CD8+ T cells undergoing their first division following adoptive transfer into LM-OVA-infected recipients. Asymmetric segregation of IL-2Rα and CD62L was observed in 60% (n=96) and 62% (n=74) of cells, respectively. Data are representative of 2 (c, d) or 3 experiments (a, b, e); error bars represent s.e.m. * P < 0.05, ** P < 0.01, *** P = 0.0002 (Kolmogorov-Smirnov test).

Comment in

Similar articles

Cited by

References

    1. Ahmed R, Gray D. Immunological memory and protective immunity: understanding their relation. Science. 1996;272:54–60. - PubMed
    1. Joshi NS, et al. Inflammation directs memory precursor and short-lived effector CD8(+) T cell fates via the graded expression of T-bet transcription factor. Immunity. 2007;27:281–95. - PMC - PubMed
    1. Masopust D, Kaech SM, Wherry EJ, Ahmed R. The role of programming in memory T-cell development. Curr Opin Immunol. 2004;16:217–25. - PubMed
    1. Sallusto F, Lenig D, Forster R, Lipp M, Lanzavecchia A. Two subsets of memory T lymphocytes with distinct homing potentials and effector functions. Nature. 1999;401:708–12. - PubMed
    1. Stemberger C, et al. A single naive CD8+ T cell precursor can develop into diverse effector and memory subsets. Immunity. 2007;27:985–97. - PubMed

Publication types

MeSH terms

Associated data