. 2014 Apr;15(4):384-392.
doi: 10.1038/ni.2843. Epub 2014 Mar 2.

Quantitative proteomics analysis of signalosome dynamics in primary T cells identifies the surface receptor CD6 as a Lat adaptor-independent TCR signaling hub

Affiliations

Quantitative proteomics analysis of signalosome dynamics in primary T cells identifies the surface receptor CD6 as a Lat adaptor-independent TCR signaling hub

Romain Roncagalli et al. Nat Immunol. 2014 Apr.

Abstract

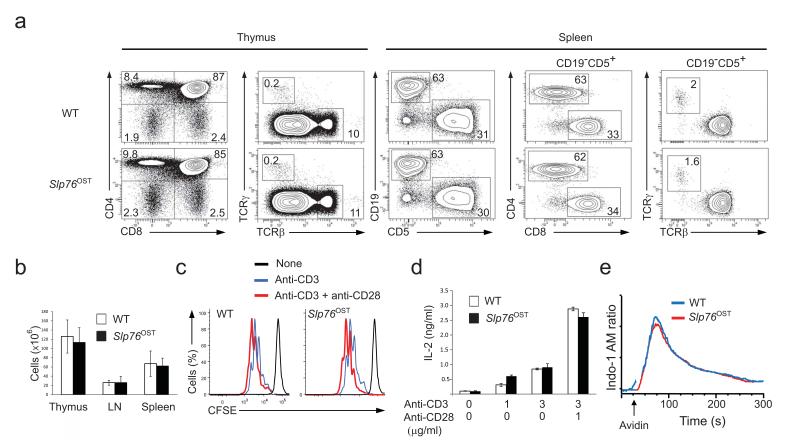
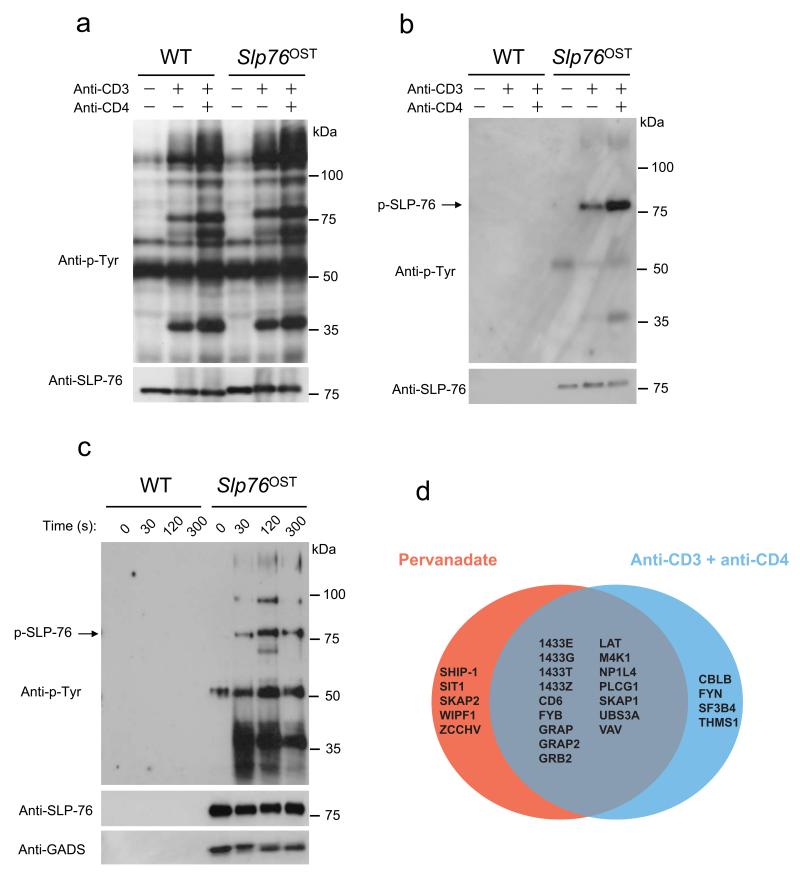
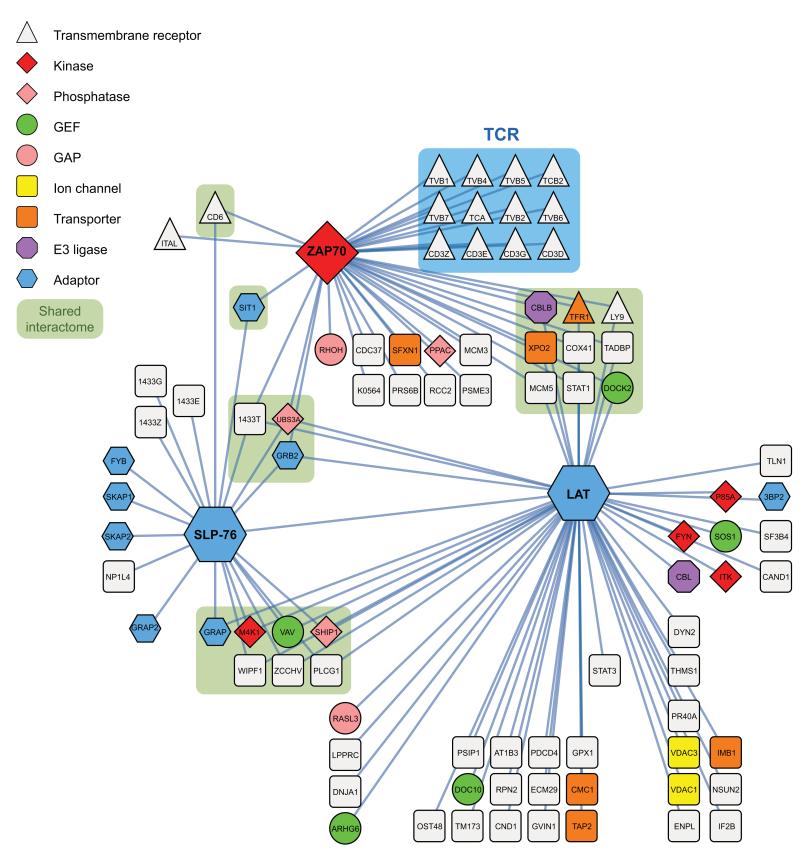
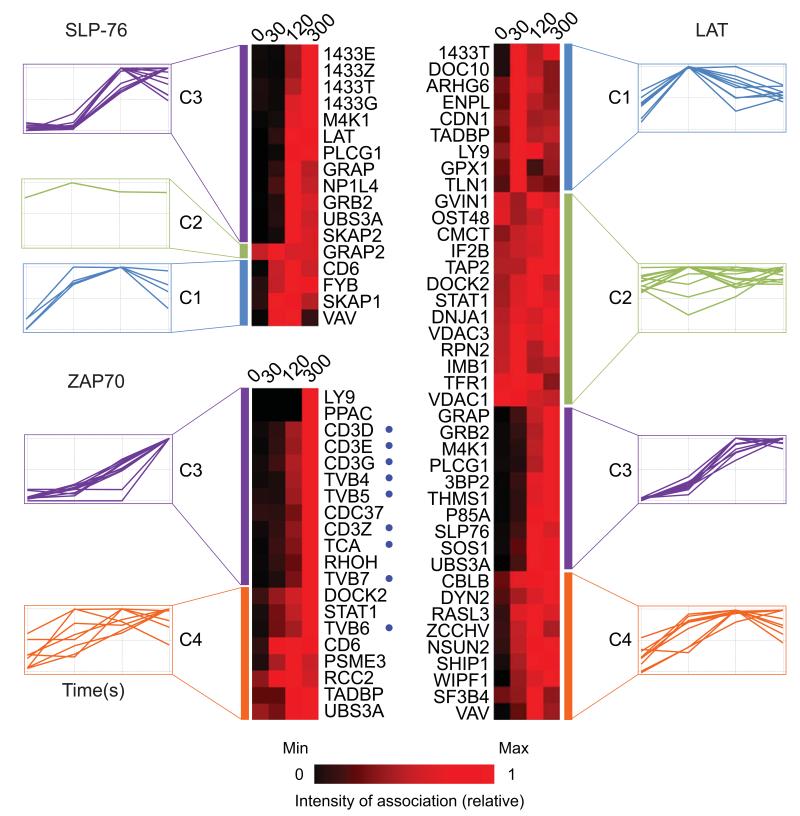
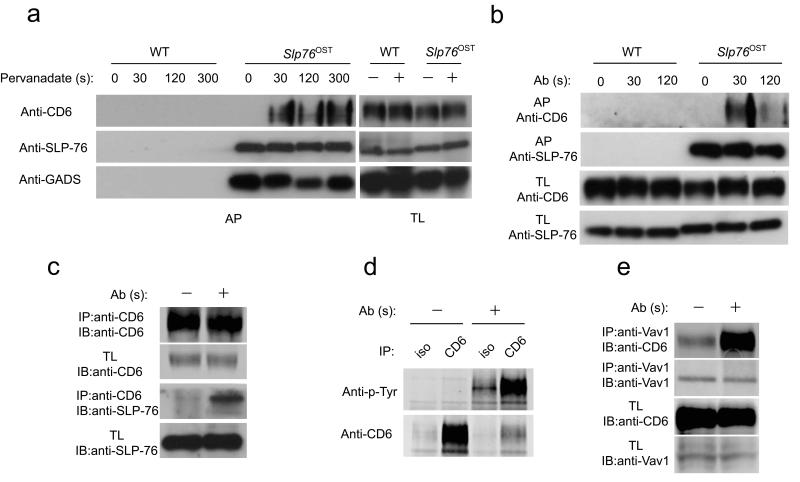
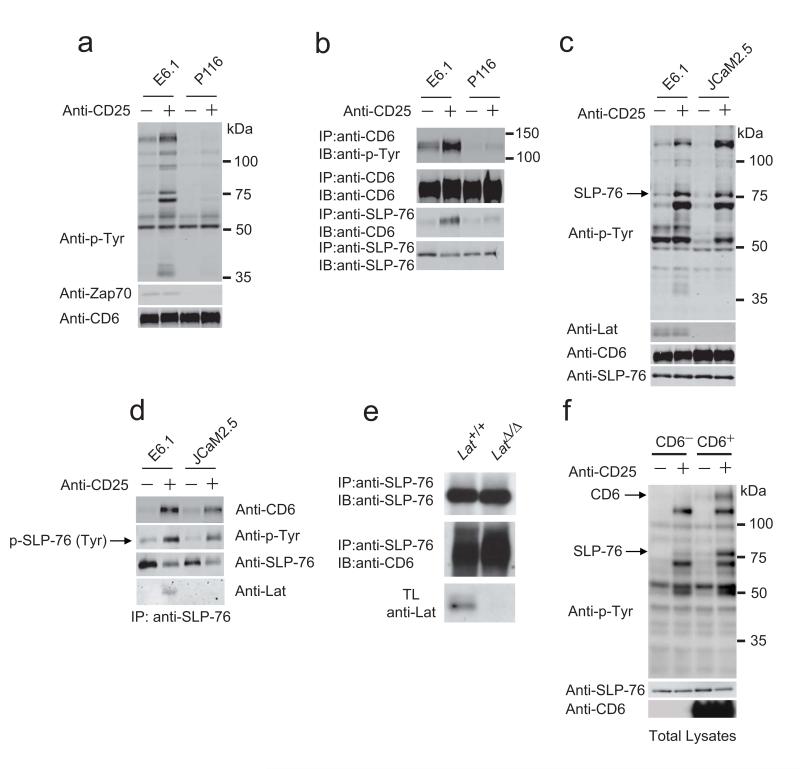
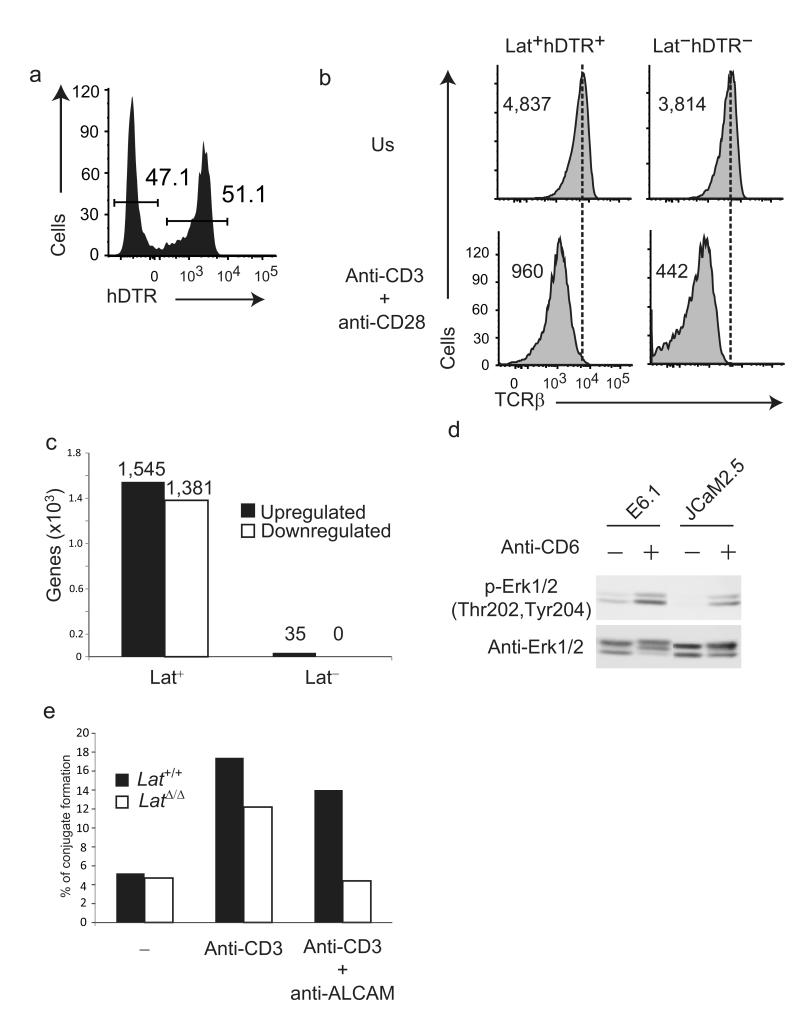
T cell antigen receptor (TCR)-mediated activation of T cells requires the interaction of dozens of proteins. Here we used quantitative mass spectrometry and activated primary CD4(+) T cells from mice in which a tag for affinity purification was knocked into several genes to determine the composition and dynamics of multiprotein complexes that formed around the kinase Zap70 and the adaptors Lat and SLP-76. Most of the 112 high-confidence time-resolved protein interactions we observed were previously unknown. The surface receptor CD6 was able to initiate its own signaling pathway by recruiting SLP-76 and the guanine nucleotide-exchange factor Vav1 regardless of the presence of Lat. Our findings provide a more complete model of TCR signaling in which CD6 constitutes a signaling hub that contributes to the diversification of TCR signaling.


Figures

Figure 1
Figure 1
Normal development and function of T cells isolated from knock-in mice homozygous for the Slp76OST allele. (a) Flow cytometry analysis of thymus and spleen.Thymocytes from wild-type (WT) and Slp76OST (also known as B6-Lcp2tm2Mal) mice were analyzed for expression of CD4 and CD8 (left) and TCRαβ and TCRγδ (right). Numbers adjacent to outlined areas indicate percent double-positive cells (top right), CD4+ single-positive cells (top left), CD8+ single-positive cells (bottom right) and double-negative CD4 CD8 cells (bottom left). Wild-type and Slp76OST splenocytes were analyzed for expression of CD5 (a marker specific of T cells) and CD19 (a marker specific of B cells). Numbers adjacent to outlined areas indicate percent B cells (upper left) and T cells (bottom right). The expression of CD4 and CD8 and of TCRαβ and TCRγδ by T cells (identified as CD19CD5+ cells). Numbers adjacent to outlined areas indicate percent CD4+ and CD8+ cells (middle) and TCRαβ and TCRγδ cells (right). Data are representative of at least three experiments with two mice per genotype. (b) Cellularity of thymus, pooled axillary, brachial, inguinal and mesenteric lymph nodes (LN) and spleen from wild-type and Slp76OST mice. Data are expressed as mean value ± SEM (n = 6). (c) CFSE dilution by wild-type, and Slp76OST CD4+ T cells activated for 72 h with plate-bound anti-CD3 (3 μg/ml) in the presence or absence (key) of soluble anti-CD28 (1 μg/ml). Dotted lines, CFSE dilution at initiation of culture. (d) IL-2 in supernatants of wild-type, and Slp76OST CD4+ T cells activated for 72 h as in (c). (e) Changes in intracellular calcium in wild-type, and Slp76OST CD4+ T cells stimulated with biotinylated anti-CD3 and avidin. Arrow corresponds to the time of addition of avidin. Data are representative of at least two experiments. Corresponding results for Zap70OST and LatOST T cells are shown in Supplementary Figures 2,3.
Figure 2
Figure 2
Purification of SLP-76–associated protein complexes from CD4+ T cells from Slp76OST mice. (a,b) CD4+ T cells from wild-type (WT) or Slp76OST mice were left unstimulated or stimulated for 2 min with anti-CD3 in the presence or absence (key) of anti-CD4. (a) Equal amounts of proteins from total lysates were directly analyzed by immunoblot with anti-phosphotyrosine (Anti-P-Tyr) or anti-SLP-76. (b) Equal amounts of cell lysates were subjected to affinity purification on Strep-Tactin-Sepharose beads and proteins eluted from Strep-Tactin-Sepharose beads with D-biotin were analyzed by immunoblot as in (a). (c) CD4+ T cells from wild-type (WT) or Slp76OST mice were left unstimulated (0) or stimulated with pervanadate for 30, 120 and 300 s and analyzed as in (a). Immunoblot analysis also includes GADS. Data in a-c are representative of at least three independent experiments. (d) Venn diagrams showing the extent of overlap existing between the SLP-76 interacting proteins identified in CD4+ T cells from Slp76OST mice following stimulation with pervanadate or anti-CD3 plus anti-CD4. For more details on the identified high confidence interacting proteins see Supplementary Table 1.
Figure 3
Figure 3
Protein-protein interactions within the Zap70–Lat–SLP-76 interaction network of mouse CD4+ T cells. Bait proteins corresponded to the Zap70, Lat and SLP-76 proteins. Protein-protein interactions were identified by affinity purification and mass-spectrometry prior to and at 30, 120 and 300 s after stimulation and visualized using Cystoscape v.2.8.3. Several proteins were found associated with more than one bait (“shared interactome”). Zap-70 was the only tested bait capable of capturing the subunits of the TCR-CD3 complex (blue box). Node functions were assigned according to the legend shown in the top left corner and encompass transmembrane receptor, tyrosine or serine/threonine protein kinase (Kinase), phospholipid or tyrosine protein phosphatase (Phosphatase), guanine exchange factor (GEF), GTP-ase activating protein (GAP), ion channel, transporter, ubiquitin ligase (E3 ligase). The depicted interactions have been observed in at least two out of three independent experiments involving three biological replicates each. Each of the proteins is denoted by its Uniprot symbol (see Supplementary Table 1) except LCP2 that is called SLP-76. For more details on identified high confidence network components and protein interaction see also Supplementary Tables 1,2.
Figure 4
Figure 4
Kinetics of protein binding to the Zap70, Lat and SLP-76 baits. The kinetics of binding to a given protein bait after stimulation were determined by label-free quantitative analysis and interacting proteins were clustered based on their similarities. Four distinct clusters (C1 to C4; see margin of each heat map) were identified using Euclidean distance correlation. The names of the proteins are indicated in the margin of each heat map (see description in Supplementary Table 1). Time is shown in seconds above each heat map; time 0 corresponds to unstimulated CD4+ T cells. Relative levels of association are shown in rainbow-like, false-color scale increasing from black to red. Blue dots represent molecules belonging to TCR-CD3 complex. Data are representative of three independent experiments involving three biological replicates each.
Figure 5
Figure 5
CD6 associates to SLP-76 after TCR engagement. (a) CD4+ T cells from wild-type (WT) or Slp76OST mice were left unstimulated (0) or stimulated for 30, 120 and 300 s with pervanadate. Cell lysates were directly processed for immunoblot (Total lysates: TL) or subjected to affinity purification on Strep-Tactin-Sepharose beads (Affinity purification: AP). Equal amount of lysates and eluates were analyzed by immunoblot with anti-CD6, anti-SLP-76 and anti-GADS. (b) CD4+ T cells from wild-type (WT) or Slp76OST mice were left unstimulated or stimulated for 30 and 120 s with anti-CD3 and anti-CD4. Cell lysates were directly processed for immunoblot (Total lysates) or subjected to affinity purification (AP) as described in (a). Equal amount of lysates or eluates were analyzed by immunoblot with anti-CD6 or anti-SLP-76. (c) CD4+ T cells from wild-type mice were left untreated (-) or stimulated for 2 min with anti-CD3 and anti-CD4 (+). Total lysates (TL) were directly analyzed by immunoblot (IB) or subjected to immunoprecipitation (IP) with an anti-CD6 (Anti-CD6 IP). Total lysates and anti-CD6 immunoprecipitates were analyzed by immunoblot (IB) with anti-CD6 or anti-SLP-76. (d) CD4+ T cells from wild-type mice were treated as in c. Total lysates were immunoprecipitated (IP) with an anti-CD6 (CD6) or an isotype control antibody (iso). Total lysates and anti-CD6 immunoprecipitates were analyzed by immunoblot with anti-phosphotyrosine (Anti-p-Tyr) or anti-CD6. (e). CD4+ T cells from wild-type mice were treated as in (c). Total lysates were immunoprecipitated with anti-Vav1. Total lysates(TL) and anti-Vav1 immunoprecipitates (IP) were analyzed by immunoblot (IB) with anti-Vav1 or anti-CD6. Data in (a) to (e) are representative of at least two independent experiments.
Figure 6
Figure 6
SLP-76 associates with CD6 in a Lat-independent manner. (a,b) Jurkat cells (clone E6.1) and their Zap70-deficient (P116) and Lat-deficient (JCam2.5) variants were transfected to co express CD25ξ and human CD6. The resulting E6.1-CD25ξ-CD6 and P116-CD25ξ–CD6 cells were left unstimulated (-) or were stimulated (+) for 2 min with anti-CD25. Total lysates (a) or anti-CD6 immunoprecipitates (b) were analyzed by immunoblot with anti-phosphotyrosine (Anti-p-Tyr), anti-Zap70 and anti-CD6. (c) E6.1-CD25ξ-CD6 and JCam2.5-CD25ξ-CD6 were stimulated as in (a). Total lysates were analyzed by immunoblots with anti-CD6, anti-phosphotyrosine (Anti-p-Tyr), anti-SLP-76 and anti-LAT. (d) E6.1-CD25ξ-CD6 and JCam2.5-CD25ξ-CD6 cells were stimulated as in (a) and total lysates were subjected to immunoprecipitation with an anti-SLP-76. Immunoprecipitates (IP) were analyzed by immunoblots with anti-CD6, anti-phosphotyrosine (Anti-p-Tyr), anti-SLP-76 and anti-LAT. (e) CD4+ T cells made defective in Lat (LatΔ/Δ; see Online Methods) and wild-type CD4+ T cells (Lat+/+) were stimulated with anti-CD3 and anti-CD4 for 2 min at 37 °C. Total lysates(TL) and anti-SLP-76 immunoprecipitates (IP: anti-SLP-76) were analyzed by immunoblots (IB) with anti-CD6, anti-SLP-76 and anti-LAT. (f) Lat-deficient, JCam2.5-CD25ξ cells lacking CD6 (CD6) or expressing CD6 (CD6+) were left unstimulated (-) or were stimulated (+) for 2 min with anti-CD25. Total lysates were analyzed by immunoblot with anti-phosphotyrosine (Anti-p-Tyr), anti-SLP-76 and anti-CD6. Data are representative of at least two independent experiments.
Figure 7
Figure 7
Limited transcriptional changes occur when the TCR is engaged in the absence of Lat. (a) Expression of hDTR at the surface of CD4+ T cells of 4 week-old mice of maT-Cre x Latfl-dtr genotype. Percentages of LathDTR and Lat+hDTR+ CD4+ T cells are shown. (b) Expression of TCRβ on sorted Lat+hDTR+ and LathDTR CD4+ T cells that were stimulated for 4 h with anti-CD3 and anti-CD28 (anti-CD3 + anti-CD28) or left untreated (NS). Numbers indicate the geometric mean fluorescence. (c) Numbers of genes that were significantly induced (UP) or repressed (DOWN) in Lat+ and Lat CD4+ T cells after 4 h of stimulation with anti-CD3 and anti-CD28. For more details on the genes that were differentially regulated see also Supplementary Table 3. (d) Jurkat T cells coexpressing CD25ξ and CD6 in the presence (E6.1) or absence (JCaM2.5) of Lat were left unstimulated (-) or stimulated for 2 min with anti-CD6 (+). Total lysates were analyzed by immunoblots with phospho-specific antibodies directed against Erk1/2 pTY202/204. Blotting with anti-Erk1/2 served as a loading control. (e) CD4+ T cells made defective in Lat (LatΔ/Δ) and wild-type CD4+ T cells (Lat+/+) were labeled with PKH26 and incubated with equal number of CTV-labeled B cells for 1 h at 37 °C in the absence (-) or presence of anti-CD3. The percentage of conjugate formed between T and B cells in the presence or absence of anti-ALCAM was determined by flow cytometry analysis. Data in (a), (b), (d) and (e) are representative of at least two independent experiments.

Similar articles

Cited by

References

    1. Balagopalan L, Coussens NP, Sherman E, Samelson LE, Sommers CL. The LAT story: a tale of cooperativity, coordination, and choreography. Cold Spring Harb. Perspect. Biol. 2010;2:a005512. - PMC - PubMed
    1. Roncagalli R, Mingueneau M, Gregoire C, Malissen M, Malissen B. LAT signaling pathology: an “autoimmune” condition without T cell self-reactivity. Trends Immunol. 2010;31:253–259. - PubMed
    1. Sommers CL, et al. A LAT mutation that inhibits T cell development yet induces lymphoproliferation. Science. 2002;296:2040–2043. - PubMed
    1. Mingueneau M, et al. Loss of the LAT adaptor converts antigen-responsive T cells into pathogenic effectors that function independently of the T cell receptor. Immunity. 2009;31:197–208. - PubMed
    1. Chuck MI, Zhu M, Shen S, Zhang W. The role of the LAT-PLC-gamma1 interaction in T regulatory cell function. J. Immunol. 2010;184:2476–2486. - PMC - PubMed

Publication types

MeSH terms

Associated data