. 2014 Apr;15(4):373-83.
doi: 10.1038/ni.2834. Epub 2014 Mar 2.

The transcription factor BATF operates as an essential differentiation checkpoint in early effector CD8+ T cells

Affiliations

The transcription factor BATF operates as an essential differentiation checkpoint in early effector CD8+ T cells

Makoto Kurachi et al. Nat Immunol. 2014 Apr.

Abstract

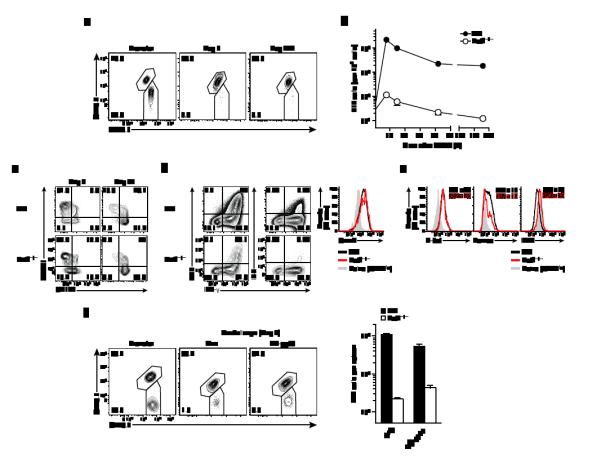
The transcription factor BATF is required for the differentiation of interleukin 17 (IL-17)-producing helper T cells (TH17 cells) and follicular helper T cells (TFH cells). Here we identified a fundamental role for BATF in regulating the differentiation of effector of CD8(+) T cells. BATF-deficient CD8(+) T cells showed profound defects in effector population expansion and underwent proliferative and metabolic catastrophe early after encountering antigen. BATF, together with the transcription factors IRF4 and Jun proteins, bound to and promoted early expression of genes encoding lineage-specific transcription-factors (T-bet and Blimp-1) and cytokine receptors while paradoxically repressing genes encoding effector molecules (IFN-γ and granzyme B). Thus, BATF amplifies T cell antigen receptor (TCR)-dependent expression of transcription factors and augments the propagation of inflammatory signals but restrains the expression of genes encoding effector molecules. This checkpoint prevents irreversible commitment to an effector fate until a critical threshold of downstream transcriptional activity has been achieved.


Figures

Figure 1
Figure 1. BATF is required for effector CD8+ T cell differentiation and viral control
Batf−/−, Batf+/-, and wild-type mice (C57Bl/6 background) were intraperitoneally infected with LCMV Arm (2×10⁵ pfu) and analyzed at the indicated time points. (a) Flow cytometry plots gated on CD8+ cells showing percentage of gp33-specific cells at d8 and d40 p.i. in the blood. (b) Number of gp33-specific CD8+ T cells per 1×10⁶ cells in the blood. Mean±s.e.m. (c) Number of gp33-specific CD8+ T cells at d8 p.i. in the spleen. Mean±s.e.m. (d) Viral titers in the spleen, liver and kidney at d5 p.i. Mean±sem. Data are representative of two independent experiments (n=3-5 per time-point). Each symbol (b and d) represents an individual mouse. *P<0.05, **P<0.01, ***P<0.001 (unpaired Student’s t-test).
Figure 2
Figure 2. BATF acts cell-intrinsically to regulate CD8+ T cell effector differentiation
Congenically different Batf−/− and wild-type P14 cells (total 5×10² ~ 1×10⁴ cells) were mixed at 1:1 ratio and adoptively transferred to naive recipients. The recipient mice were intraperitoneally infected with LCMV Arm (2×10⁵ pfu) and analyzed at indicated time-points. (a) Flow cytometry plots gated on P14 cells showing percentage of wild-type (upper, CD45.1+CD45.2+) and Batf−/− (lower, CD45.1+) at adoptive transfer and d7 and d224 in the spleen. (b) Number of Batf−/− and wild-type P14 cells per 1×10⁶ cells in the blood. (c - e) Plots gated on wild-type or Batf−/− P14 cells showing CD127 and KLRG1 expression at d8 and d44 (c), and cytokine production and granzyme B expression at d8 (b), and expression level of transcription factors at d8 (e). (e) Numbers in the plots indicate MFI (mean±2s.d.). (f) Requirement of BATF for secondary response. Wild-type (CD45.1+CD45.2+) and Batf−/− (CD45.2+) memory P14 cells were generated in separate hosts (CD45.1+) and isolated from spleen at d51 after primary infection. Equal numbers of wild type and Batf−/− memory P14 cells were mixed (total 7×10³ cells) and adoptively transferred into secondary hosts (CD45.1+). One day later recipient mice were infected with LCMV Arm (2×10⁵ pfu) or LM-gp33 (1×10⁴ cfu), and analyzed at d7 p.i. Data are representative of three (a-e) and two (f) independent experiments (n=3-5 per time point).
Figure 3
Figure 3. BATF overexpression rescues effector differentiation in Batf−/− effector CD8+ T cells
CD45.1+ Batf−/− and wild-type P14 cells were transduced with Batf overexpressing retrovirus (Batf RV) or empty retrovirus (Empty RV) one day after stimulation with anti-CD3 and anti-CD28 antibodies in vitro. Transduced P14 cells (1×10⁴ cells) were transferred into time-matched CD45.2+ mice (one day after LCMV Arm infection). (a) Plots gated on CD8+ cells show the frequency of GFP+ P14 cells at d8 p.i. in the blood. Numbers in the plots indicate percent of P14 cells among total CD8+ T cells (upper left, black gate) and percent of GFP+ cells among total P14 cells (upper right, green gate). (b) Number of P14 cells per 1×10⁶ cells in the blood. Mean±s.e.m. (c) Frequency of GFP+ cells among the transferred P14 cells in (b), tracked longitudinally in peripheral blood from mice infected with Arm. Mean±s.e.m. (d) Expression of CD127 and KLRG1 on GFP+ donor P14 cells at d8 p.i. Numbers in the plots indicate percent of each quadrant gate. Data are from four independent experiments (n=4-5 per time point).
Figure 4
Figure 4. BATF and IRF4 co-bind in effector CD8+ T cells
ChIP-Seq analysis of wild-type effector CD8+ T cells. (a) ChIP-Seq binding tracks for BATF (Red), IRF4 (Blue), Jun transcription factors (orange), and modified histones (gray) at representative genes (Il2ra, Prdm1, Il12rb2). (b) Bar graphs indicating the percentage of TF peaks within active enhancers (left), active promoters (middle), and Polycomb repressed (right) chromatin states for each TF. (c) Venn diagram of the number of genes bound by BATF and IRF4. P<2×10⁻¹⁶. Significance was assessed with a binomial probability test. (d) Distribution analysis of the combined BATF and IRF4 regions. The histogram shows the distribution of midpoint distances between a BATF site and the nearest IRF4 site in a 1 kb window. (e) De novo motif analysis of the combined BATF and IRF4 regions, BATF-only regions, and IRF4-only regions.
Figure 5
Figure 5. Temporal regulation of gene expression during effector CD8+ T cell differentiation by combinatorial binding of BATF, IRF4 and Jun
(a) Overlap of BATF target genes with genes up- or down-regulated during effector CD8+ T cell differentiation (FDR < 0.25 and fold change > 2 or < −2). Significance between each pair-wise combination tested with a hypergeometric test, and 1-(Log10 )P value indicated by color scale. (b) Clustered heat-map of regions bound by combinations of TFs (red, bound; grey, unbound), and the seven resulting combinations of TF binding indicated by the legend on the right. (c) k-means clustering of gene expression in P14 CD8+ T cells following LCMV Arm infection measured at indicated time-points. (d) Overlap between clusters of genes bound by combinations of TFs from (b) and temporal patterns of gene expression from (c). Each bar denotes whether a TF region cluster exhibits significant depletion (negative values) or enrichment (positive values) within the genes of the indicated temporal pattern. Significance, measured by the hypergeometric test, for each TF cluster genes in Pattern A (left), Pattern B (middle), and Pattern C (right).
Figure 6
Figure 6. Loss of BATF perturbs a network of transcription factors
(a) Consensus clustering of gene expression in naive and in vitro generated effector CD8+ T cells using wild-type or Batf−/− CD8+ T cells. (b) Heatmap of genes differentially expressed (FDR < 0.25) in wild-type and Batf−/− CD8+ T cells. BATF target genes are marked by the grey bars to the right of the heatmap. (c) BATF-centric interaction network of TFs. Incoming or outgoing connections are indicated by arrow direction; differential expression of TFs in Batf−/− effector CD8 T cells is indicated by color of node and edge (Red for increased expression in Batf−/− cells and Blue for decreased expression in Batf−/− cells); and presence of shared target genes indicated by thick node outline.
Figure 7
Figure 7. Loss of BATF perturbs the earliest stages of effector CD8+ T cell differentiation
Batf−/− (CD45.2+) and wild-type (CD45.1+CD45.2+) P14 cells were mixed at a 1:1 ratio and transferred to CD45.1+ mice (total 1~2×10 cells) after labeling with CFSE or Cell Trace Violet (CTV). The recipient mice were infected with LCMV Arm (2×10 pfu). (a) Proliferation was assessed by CTV dilution and longitudinal cell size (FSC) of Batf−/− and wild-type P14 cells was examined. Y-axis in CTV histogram was adjusted to the same scale to reflect relative number of both P14 cell types at a given time point. Numbers in the plots indicate percent of Batf−/− and wild-type cells among total P14 cells. (b) Number of P14 cells per spleen. Mean±s.e.m. *p=0.0212 (unpaired Student’s t-test). (c) Measurement of caspase activity by FLICA staining at d3. Numbers in the histogram indicate percent FLICA positive. Mean±s.e.m. (d) Expression of nutrient transporters, phosphorylation of the S6 ribosomal protein and reactive oxygen species production. (e) Fold increase of T-bet expression in Batf−/− and wild-type P14 cells at 4 hrs after in vitro anti-CD3 and anti-CD28 stimulation, determined by Affymetrix chip (left), and T-bet protein level at d3 in vivo (right). (f-h) Expression of cytokine receptors (f), CD62L and CD69 at d3 (g), and IFN-γ production upon in vitro restimulation (d2) and granzyme B expression ex vivo (d3) (h). Time points for analysis are shown in histogram (d, e, f and h). Data are representative of four independent experiments (n=3-5 per time point).

Similar articles

Cited by

References

    1. Kaech SM, Wherry EJ, Ahmed R. Effector and memory T-cell differentiation: implications for vaccine development. Nat Rev Immunol. 2002;2(4):251–262. - PubMed
    1. Doering TA, Crawford A, Angelosanto JM, Paley MA, Ziegler CG, Wherry EJ. Network analysis reveals centrally connected genes and pathways involved in CD8+ T cell exhaustion versus memory. Immunity. 2012;37(6):1130–1144. - PMC - PubMed
    1. Kaech SM, Wherry EJ. Heterogeneity and cell-fate decisions in effector and memory CD8+ T cell differentiation during viral infection. Immunity. 2007;27(3):393–405. - PMC - PubMed
    1. van der Windt GJ, Pearce EL. Metabolic switching and fuel choice during T-cell differentiation and memory development. Immunol Rev. 2012;249(1):27–42. - PMC - PubMed
    1. Rutishauser RL, Kaech SM. Generating diversity: transcriptional regulation of effector and memory CD8 T-cell differentiation. Immunol Rev. 2010;235(1):219–233. - PubMed

Publication types

MeSH terms

Associated data