. 2014 Apr;20(4):377-84.
doi: 10.1038/nm.3467. Epub 2014 Mar 2.

Netrin-1 promotes adipose tissue macrophage retention and insulin resistance in obesity

Affiliations

Netrin-1 promotes adipose tissue macrophage retention and insulin resistance in obesity

Bhama Ramkhelawon et al. Nat Med. 2014 Apr.

Abstract

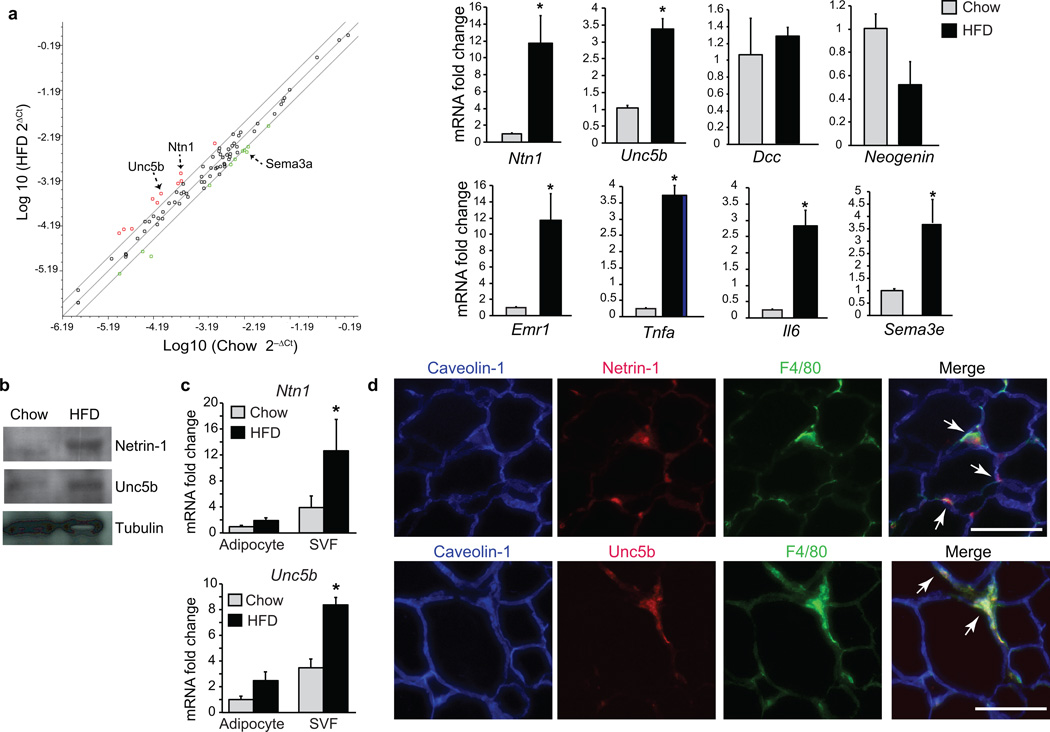
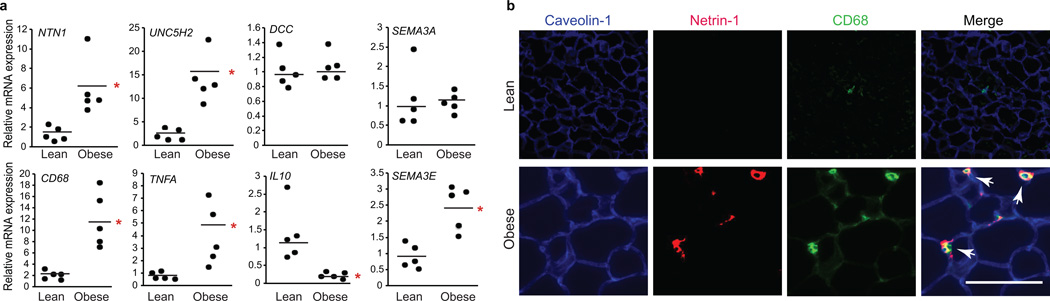
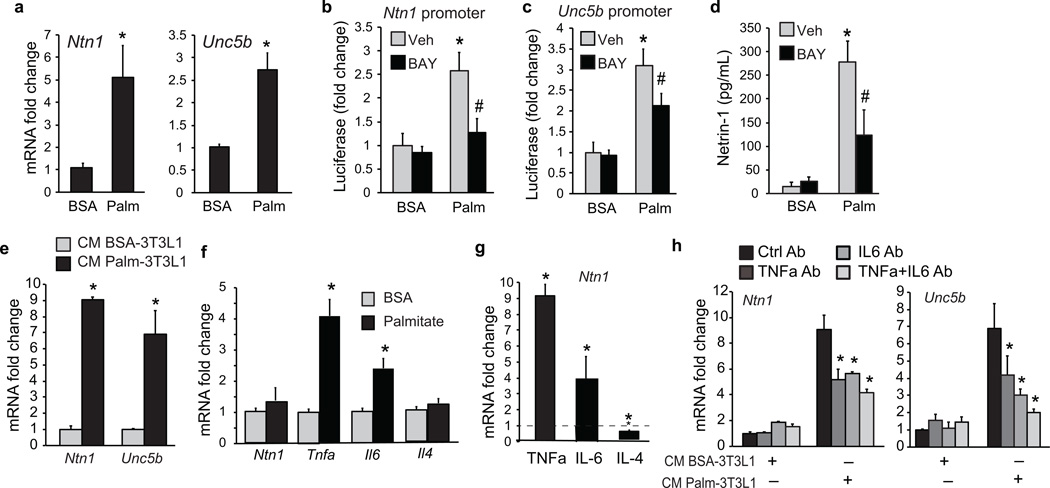
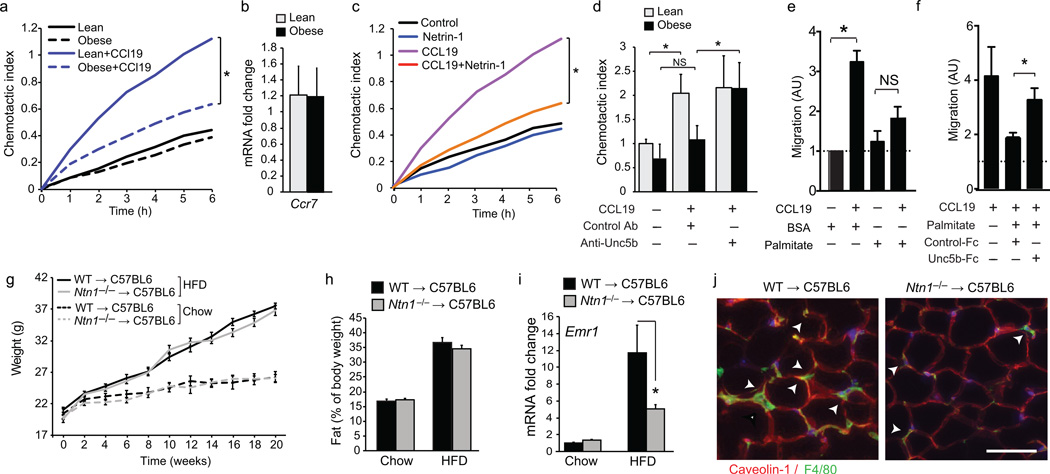
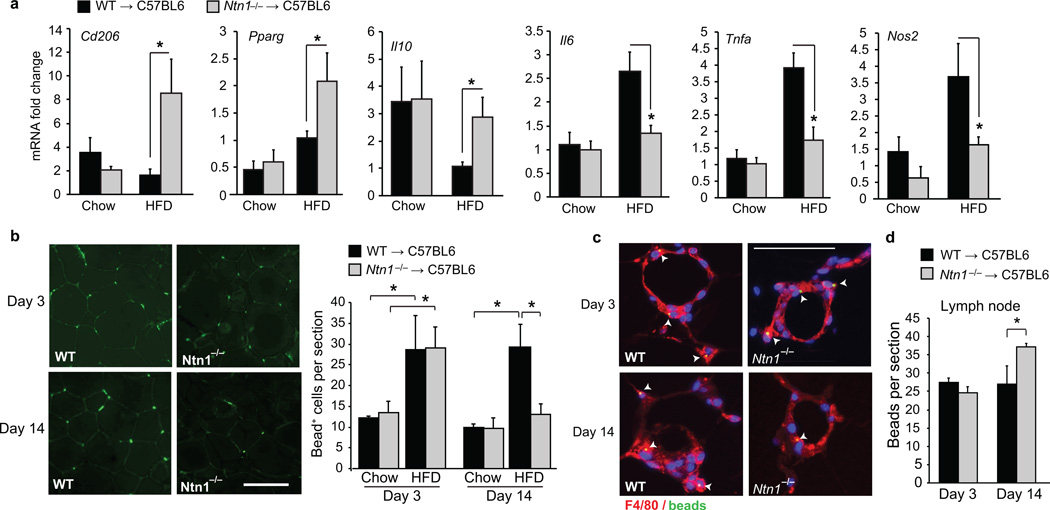
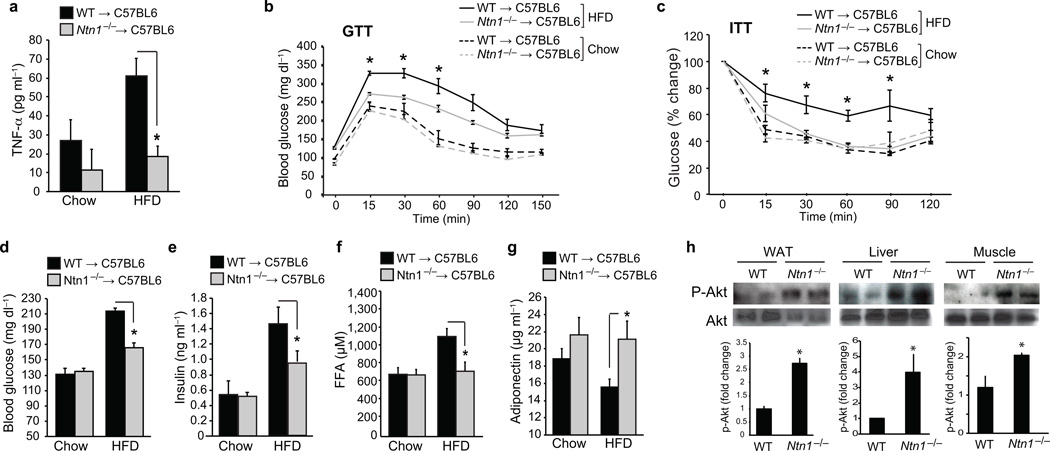
During obesity, macrophage accumulation in adipose tissue propagates the chronic inflammation and insulin resistance associated with type 2 diabetes. The factors, however, that regulate the accrual of macrophages in adipose tissue are not well understood. Here we show that the neuroimmune guidance cue netrin-1 is highly expressed in obese but not lean adipose tissue of humans and mice, where it directs the retention of macrophages. Netrin-1, whose expression is induced in macrophages by the saturated fatty acid palmitate, acts via its receptor Unc5b to block their migration. In a mouse model of diet-induced obesity, we show that adipose tissue macrophages exhibit reduced migratory capacity, which can be restored by blocking netrin-1. Furthermore, hematopoietic deletion of Ntn1 facilitates adipose tissue macrophage emigration, reduces inflammation and improves insulin sensitivity. Collectively, these findings identify netrin-1 as a macrophage retention signal in adipose tissue during obesity that promotes chronic inflammation and insulin resistance.


Figures

Figure 1
Figure 1. Netrin-1 and Unc5b are upregulated in obese-adipose tissue
(a) Scatter plot of neuronal guidance cue expression in VAT from mice fed a HFD or chow for 20 weeks: upregulated genes are indicated in red; downregulated genes in green (n = 3 mice/group). Confirmation of mRNA changes in VAT of mice fed chow (n = 5) or HFD (n = 6) by qRT-PCR (right panel). (b) Western blot of netrin-1, Unc5b, and tubulin in VAT from mice fed chow or HFD (n = 3). (c) Relative mRNA expression of Ntn1 and Unc5b in the adipocyte and SVF fraction isolated from WAT of mice fed chow (n = 4) or HFD (n = 6). (d) Immunofluorescence staining for netrin-1 (red, upper) or Unc5b (red, lower), the macrophage marker F4/80 (green) and caveolin-1 (blue) in VAT of HFD-fed mice. Co-localization of netrin-1 or Unc5b with F4/80 is seen in yellow in the merged image (arrows). Scale bar = 100 µm. Data in a and c are the mean ± s.e.m. *P < 0.05.
Figure 2
Figure 2. Netrin-1 is expressed by adipose tissue macrophages in obese human VAT
(a) qRT-PCR analysis of mRNA isolated from VAT of lean (n = 5) or obese (n = 5) human subjects. Data are the mean ± s.e.m. *P < 0.05. (b) Immunofluorescence staining of netrin-1 (red), caveolin-1 (blue), and CD68 (green) in VAT of lean and obese individuals. Co-localization of netrin-1 and CD68 is seen in yellow in the merged image (arrows). Scale bar = 100 µm.
Figure 3
Figure 3. Palmitate upregulates Ntn1 and Unc5b expression in macrophages
(a) Ntn1 and Unc5b mRNA in BMDM treated with 250 µM BSA or palmitate for 24 h. (b) Ntn1 and (c) Unc5b promoter-luciferase reporter activity in HEK293T cells treated with 250 µM BSA or palmitate in the presence of the NFkB inhibitor BAY11-7082 (10 µmol/L) or vehicle (veh). (d) Concentration of netrin-1 in culture supernatants of BMDM treated with 250 µM BSA or palmitate for 24 h in the presence of BAY11-7082 or vehicle. (e) Ntn1 and Unc5b mRNA in BMDM treated with conditioned media (CM) from 3T3L1 adipocytes exposed to BSA or palmitate (250 µM) for 24 h. (f) qRT-PCR of mRNA from 3T3L1 adipocytes treated with BSA or palmitate (250µM) for 24 h. (g) Ntn1 mRNA in BMDM treated with TNFα (10 ng/ml), IL-6 (40 ng/ml) or IL-4 (10 ng/ml) for 24 h. (h) Ntn1 and Unc5b mRNA in BMDM treated with CM from 3T3L1 adipocytes exposed to BSA or palmitate (250 µM) in the presence or absence of anti-TNFα, anti-IL-6 or both. Data presented are the mean ± s.d. of triplicate samples from a single experiment and are representative of three independent experiments. *P < 0.05.
Figure 4
Figure 4. Netrin-1 blocks chemokine-induced migration of ATM and promotes ATM accumulation during HFD-feeding
(a) Real-time migration of ATM isolated from WAT of lean (chow-fed) or obese (HFD-fed) mice to CCL19 (500 ng/ml). (b) Ccr7 mRNA in ATMs isolated from lean or obese WAT. (c) Migration of ATM isolated from lean mice to CCL19, netrin-1 (250 ng/ml) or both. (d) Migration of ATM isolated from WAT of lean or obese mice to CCL19 in the presence or absence of UNC5b blocking antibody or isotype matched control antibody (Control Ab). (e–f) Migration of peritoneal Mø pretreated with 250 µM BSA or palmitate toward CCL19 alone (e), or in the presence of Unc5b-Fc or isotype control (Control-Fc) antibody (f). (g–h) body weight (g) and fat mass (h) of C57BL6 mice transplanted with WT or Ntn1−/− bone marrow and fed chow (n = 7 per group) or HFD (n = 9 per group) for 20 weeks. (i) Emr1 (F4/80) mRNA in VAT of mice of the indicated genotype fed a chow (n = 4) or western diet (n = 9). (j) Immunofluorescence staining for F4/80 in VAT of representative HFD-fed mice. Scale bar = 100 µm. Data in panels b,d-f are the mean ± s.d. of triplicate samples from a single experiment and are representative of three independent experiments. Data in g-i are the mean ± s.e.m. *P<0.05.
Figure 5
Figure 5. Netrin-1 promotes macrophage retention in adipose tissue during obesity
(a) qRT-PCR analysis of mRNA for M1 (Nos2, Tnfa, Il6) and M2 (Cd206, IL10, Pparg) markers in macrophages isolated from the VAT of mice fed chow (n = 7) or HFD (n = 9). (b) Analysis of macrophage recruitment and retention in VAT of mice fed a chow or HFD using a fluorescent bead-tracking model. Left: Representative images of fluorescent bead-labeled cells in VAT of HFD-fed mice at day 3 and 14. Scale bar = 100 µm. Right: Mean number of bead-labeled macrophages in VAT sections (n = 5 mice per group). (c) F4/80 staining (red) of VAT from HFD-fed mice 3 and 14 days post-labeling showing fluorescent beads (green) in macrophages in crown-like structures. (d) Mean number of beads in mesenteric lymph nodes on days 3 and 14 (n = 5 mice per group). Data in a, b, and d are the mean ± s.e.m. *P<0.05.
Figure 6
Figure 6. Netrin-1 expression by ATM promotes metabolic dysfunction
(a) Serum TNFα levels in mice transplanted with WT or Ntn1−/− bone marrow and fed chow (n = 5) or HFD (n = 6) for 20 wk. (b) Glucose tolerance test (GTT) and (c) Insulin tolerance test (ITT) of mice fed a chow (n = 7) or HFD (n = 9). (d) Blood glucose levels and plasma levels of (e) insulin, (f) free fatty acid (FFA), and (g) adiponectin of mice fed a chow (n = 7) or HFD (n = 9). (h) Western blot of phosphoAKT (Ser 473) and total AKT in white adipose tissue (WAT), liver and muscle. Quantification of p-Akt/total Akt is shown at bottom (n=4 mice/group). Data in a-g are the mean ± s.e.m. *P<0.05.

References

    1. Feuerer M, et al. Lean, but not obese, fat is enriched for a unique population of regulatory T cells that affect metabolic parameters. Nature medicine. 2009;15:930–939. - PMC - PubMed
    1. Kintscher U, et al. T-lymphocyte infiltration in visceral adipose tissue: a primary event in adipose tissue inflammation and the development of obesity-mediated insulin resistance. Arteriosclerosis, thrombosis, and vascular biology. 2008;28:1304–1310. - PubMed
    1. Liu J, et al. Genetic deficiency and pharmacological stabilization of mast cells reduce diet-induced obesity and diabetes in mice. Nature medicine. 2009;15:940–945. - PMC - PubMed
    1. Nishimura S, et al. CD8+ effector T cells contribute to macrophage recruitment and adipose tissue inflammation in obesity. Nature medicine. 2009;15:914–920. - PubMed
    1. Weisberg SP, et al. Obesity is associated with macrophage accumulation in adipose tissue. The Journal of clinical investigation. 2003;112:1796–1808. - PMC - PubMed

Publication types

MeSH terms