

Multiplexed ion beam imaging of human breast tumors
- PMID: 24584119
- PMCID: PMC4110905
- DOI: 10.1038/nm.3488
Multiplexed ion beam imaging of human breast tumors
Abstract
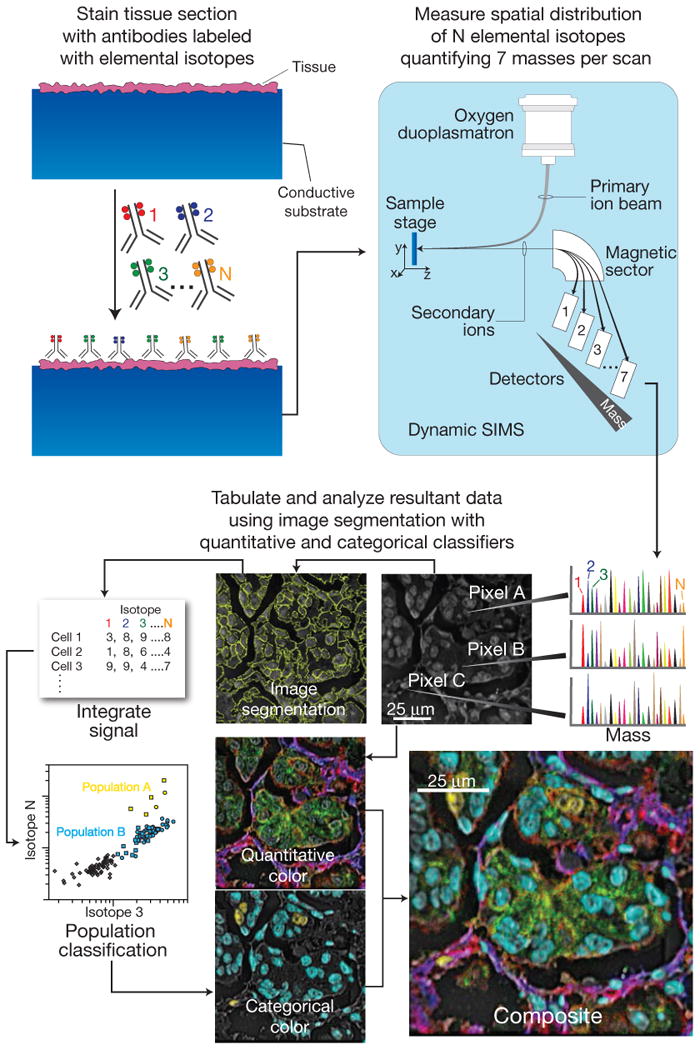
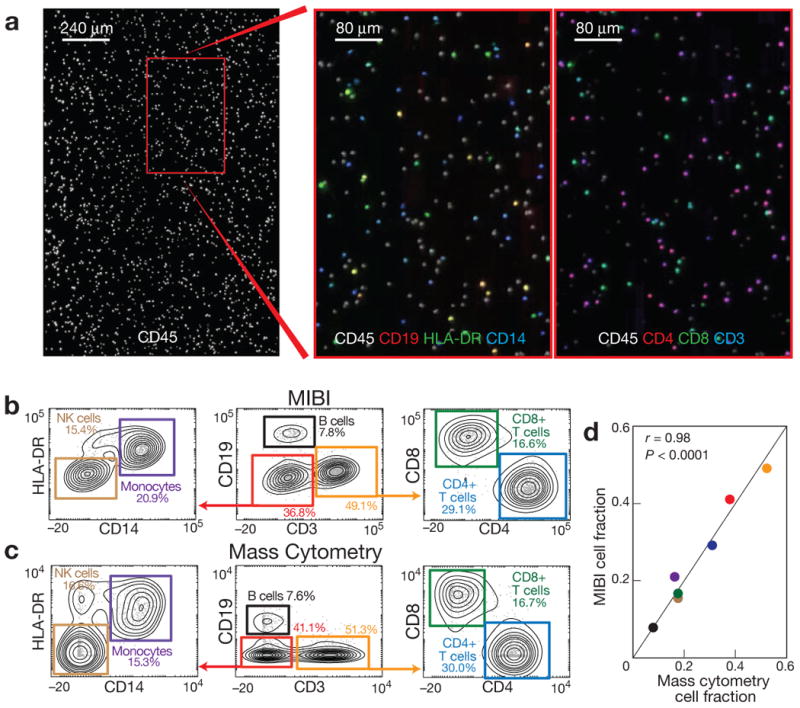
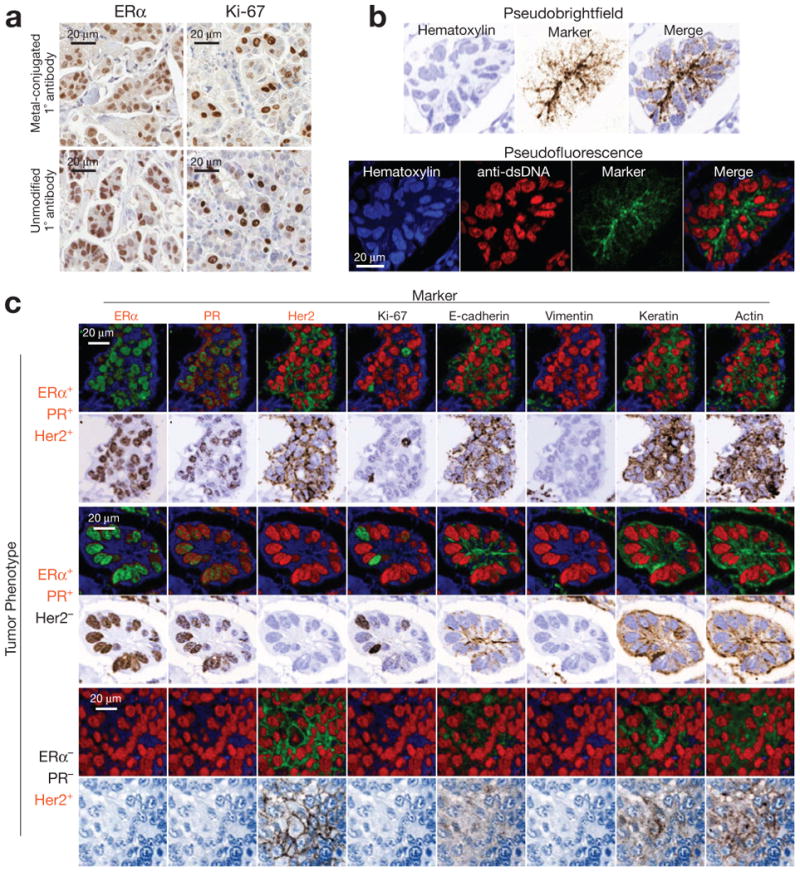
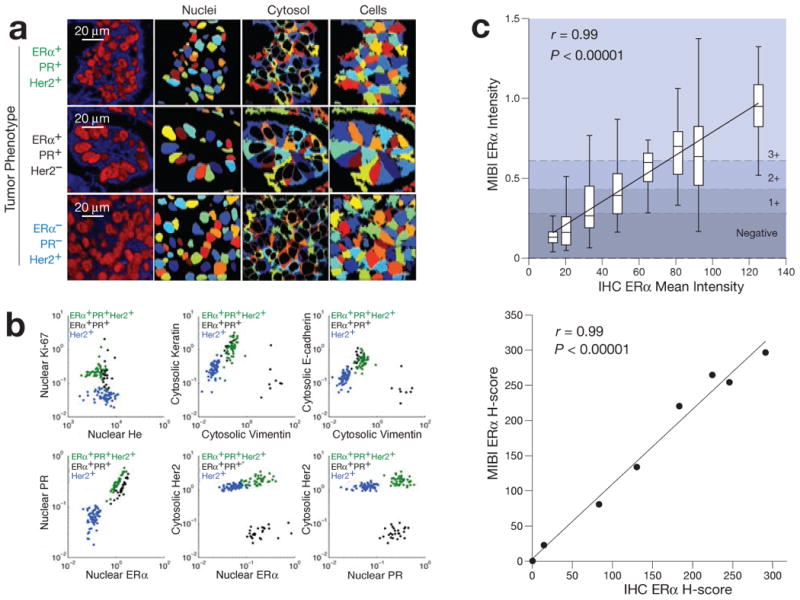
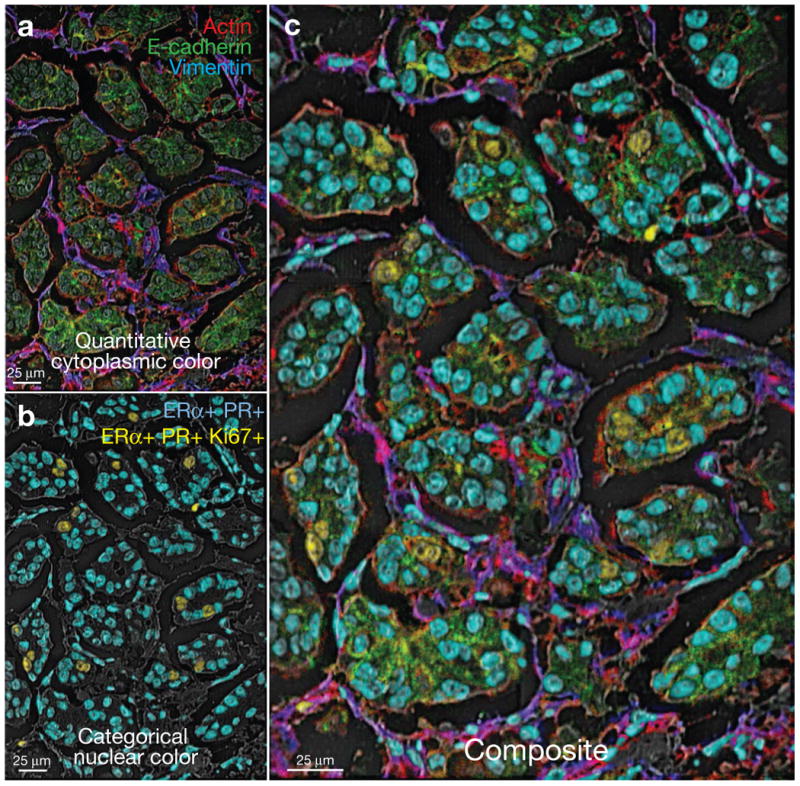
Immunohistochemistry (IHC) is a tool for visualizing protein expression that is employed as part of the diagnostic workup for the majority of solid tissue malignancies. Existing IHC methods use antibodies tagged with fluorophores or enzyme reporters that generate colored pigments. Because these reporters exhibit spectral and spatial overlap when used simultaneously, multiplexed IHC is not routinely used in clinical settings. We have developed a method that uses secondary ion mass spectrometry to image antibodies tagged with isotopically pure elemental metal reporters. Multiplexed ion beam imaging (MIBI) is capable of analyzing up to 100 targets simultaneously over a five-log dynamic range. Here, we used MIBI to analyze formalin-fixed, paraffin-embedded human breast tumor tissue sections stained with ten labels simultaneously. The resulting data suggest that MIBI can provide new insights into disease pathogenesis that will be valuable for basic research, drug discovery and clinical diagnostics.
Figures
Comment in
-
Imaging: Lighting up tumours.Nat Rev Clin Oncol. 2014 May;11(5):240. doi: 10.1038/nrclinonc.2014.57. Epub 2014 Mar 25. Nat Rev Clin Oncol. 2014. PMID: 24663125 No abstract available.
References
-
- Coons AH, Creech HJ, Jones RN, Berliner E. The demonstration of pneumococcal antigen in tissues by the use of fluorescent antibody. J Immunol. 1942;45:159–170.
-
- Rimm DL. What brown cannot do for you. Nat Biotechnol. 2006;24:914–916. - PubMed
-
- McCabe A, Dolled-Filhart M, Camp RL, Rimm DL. Automated quantitative analysis (AQUA) of in situ protein expression, antibody concentration, and prognosis. J Natl Cancer Inst. 2005;97:1808–1815. - PubMed
Publication types
MeSH terms
Substances
Grants and funding
- P30 CA093373/CA/NCI NIH HHS/United States
- 5R25CA11868107/CA/NCI NIH HHS/United States
- R01 CA130826/CA/NCI NIH HHS/United States
- PN2 EY018228/EY/NEI NIH HHS/United States
- P01 CA034233/CA/NCI NIH HHS/United States
- N01-HV-00242/HV/NHLBI NIH HHS/United States
- R01 CA120525/CA/NCI NIH HHS/United States
- U54CA149145/CA/NCI NIH HHS/United States
- R21 DK073928/DK/NIDDK NIH HHS/United States
- 5U54CA143907/CA/NCI NIH HHS/United States
- P50 CA114747/CA/NCI NIH HHS/United States
- R01 AI035304/AI/NIAID NIH HHS/United States
- RFA CA 09-009/CA/NCI NIH HHS/United States
- P01 CA034233-22A1/CA/NCI NIH HHS/United States
- U54 CA143907/CA/NCI NIH HHS/United States
- HHSN268201000034C/HL/NHLBI NIH HHS/United States
- U19 AI057229/AI/NIAID NIH HHS/United States
- P01 AI036535/AI/NIAID NIH HHS/United States
- S10 RR027582/RR/NCRR NIH HHS/United States
- U19 AI100627/AI/NIAID NIH HHS/United States
- 1R01CA130826/CA/NCI NIH HHS/United States
- K99 GM104148/GM/NIGMS NIH HHS/United States
- N01 HV028183/HL/NHLBI NIH HHS/United States
- R01 AI073724/AI/NIAID NIH HHS/United States
- S10 RR027431/RR/NCRR NIH HHS/United States
- U54 CA149145/CA/NCI NIH HHS/United States
- U54 CA119367/CA/NCI NIH HHS/United States
- HHSN272200700038C/AI/NIAID NIH HHS/United States
- S10 OD016318/OD/NIH HHS/United States
- RFA CA 09-011/CA/NCI NIH HHS/United States
- R00 GM104148/GM/NIGMS NIH HHS/United States
- R25 CA118681/CA/NCI NIH HHS/United States
- PN2EY018228/EY/NEI NIH HHS/United States
- 1K99 GM104148-01/GM/NIGMS NIH HHS/United States
LinkOut - more resources
Full Text Sources
Other Literature Sources
Medical
Miscellaneous
