

doi: 10.1038/nmeth.2878.
Epub 2014 Mar 2.
Live-cell imaging of alkyne-tagged small biomolecules by stimulated Raman scattering
Affiliations
- PMID: 24584195
- PMCID: PMC4040164
- DOI: 10.1038/nmeth.2878
Item in Clipboard
Live-cell imaging of alkyne-tagged small biomolecules by stimulated Raman scattering
Nat Methods.
2014 Apr.
Abstract
Sensitive and specific visualization of small biomolecules in living systems is highly challenging. We report stimulated Raman-scattering imaging of alkyne tags as a general strategy for studying a broad spectrum of small biomolecules in live cells and animals. We demonstrate this technique by tracking alkyne-bearing drugs in mouse tissues and visualizing de novo synthesis of DNA, RNA, proteins, phospholipids and triglycerides through metabolic incorporation of alkyne-tagged small precursors.
Figures
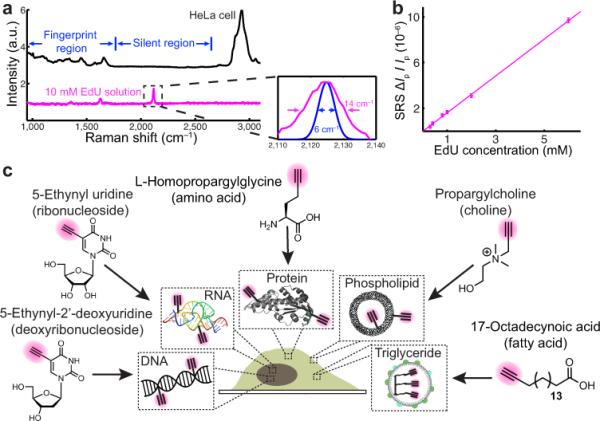
a, Apparatus (detail in online methods). In the resonant condition, the Pump and Stokes photons, which jointly accelerate the vibrational excitation via SRS, experience stimulated Raman loss and Raman gain, respectively. b, Spontaneous Raman spectra of HeLa cells and 10 mM EdU solution. Inset: the calculated SRS excitation profile (FWHM 6 cm−1, blue) is well fitted within the 2125 cm−1 alkyne peak (FWHM 14 cm−1, magenta). c, Linear dependence of stimulated Raman loss signals (2125 cm−1) with EdU concentrations under a 100 μs acquisition time. d, The metabolic incorporation scheme for a broad spectrum of alkyne-tagged small precursors. a.u. arbitrary units.
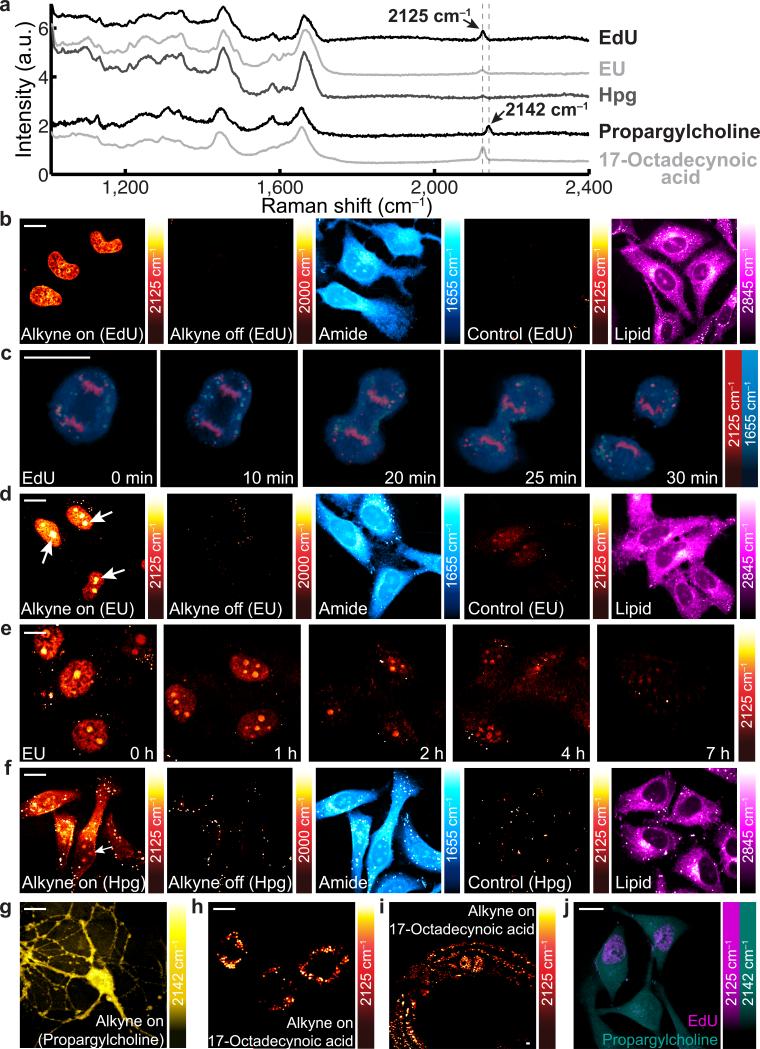
a, Raman spectra of cells incubated with EdU, EU, Hpg, propargylcholine and 17-octadecynoic acid (17-ODYA). b, 2125 cm−1 images of live cells incubated with 100 μM EdU (alkyne-on) and with both 100 μM EdU and 10 mM hydroxyurea (Control). c, Time-lapse imaging of a dividing cell incubated with EdU (100 μM). d, 2125 cm−1 images of live cells incubated with 2 mM EU (alkyne-on) and with both 2 mM EU and 200 nM actinomycin D (Control). e, Pulse-chase imaging of RNA turnover in cells incubated with 2 mM EU for 12 h and then changed to regular media. f, 2125 cm−1 images of live cells incubated with 2 mM Hpg (alkyne-on) and with both 2 mM Hpg and 2 mM methionine (Control). g, 2142 cm−1 image of live neurons incubated with 1 mM propargylcholine (alkyne-on). h, 2125 cm−1 image of live macrophages incubated with 400 μM 17-ODYA (alkyne-on). i, 2125 cm−1 image of C. elegans fed with 17-ODYA (alkyne-on). j, Dual-color SRS images of simultaneous EdU (2125 cm−1, magenta) and propargylcholine (2142 cm−1, green) incorporation. For b, d and f, 2000 cm−1 (alkyne-off) images and 1655 cm−1 (amide) images display the same set of cells as in the alkyne-on images; the 2845 cm−1 (lipid) images capture the same cells as in the control images. Scale bars, 10 μm. Representative images of 10– 15 trials. a.u. arbitrary units.
References
-
- Zhang J, Campbell RE, Ting AY, Tsien RY. Nat. Rev. Mol. Cell Biol. 2002;3:906–918. - PubMed
-
- Sasic S, Ozaki Y, editors. Raman, infrared, and near-infrared chemical imaging. Wiley; 2011.
-
- Cheng J-X, Xie XS. Coherent Raman Scattering Microscopy. CRC Press; 2012.
-
- Masters BR, So PTC, editors. Handbook of biomedical nonlinear optical microscopy. Oxford University Press; 2008.
-
- Prescher JA, Bertozzi CR. Nat. Chem. Biol. 2005;1:13–21. - PubMed
Publication types
MeSH terms
Substances
Grants and funding
LinkOut - more resources
Full Text Sources
Other Literature Sources
