. 2014 May;80(9):2889-900.
doi: 10.1128/AEM.00342-14. Epub 2014 Feb 28.

Establishment of intestinal microbiota during early life: a longitudinal, explorative study of a large cohort of Danish infants

Affiliations

Establishment of intestinal microbiota during early life: a longitudinal, explorative study of a large cohort of Danish infants

Anders Bergström et al. Appl Environ Microbiol. 2014 May.

Abstract

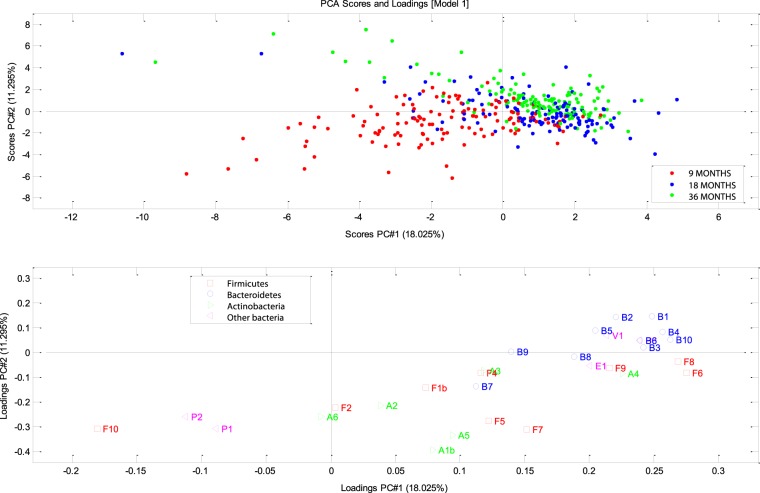
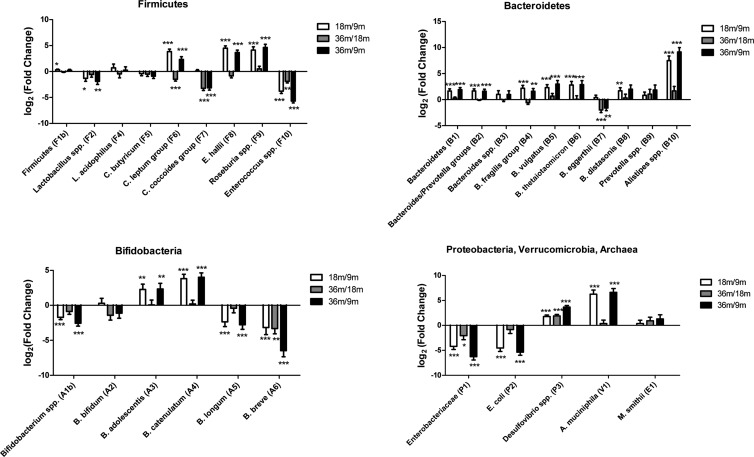
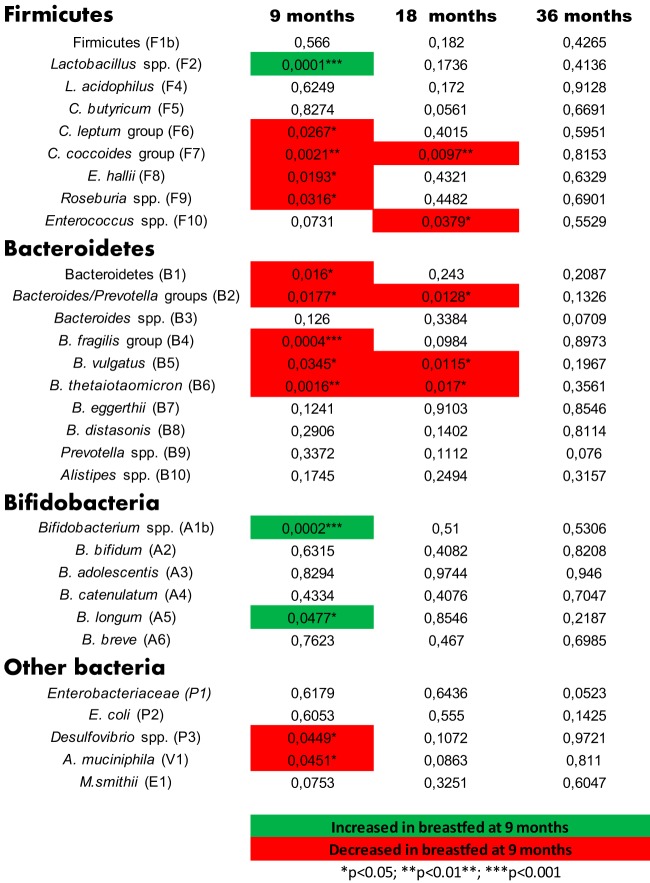
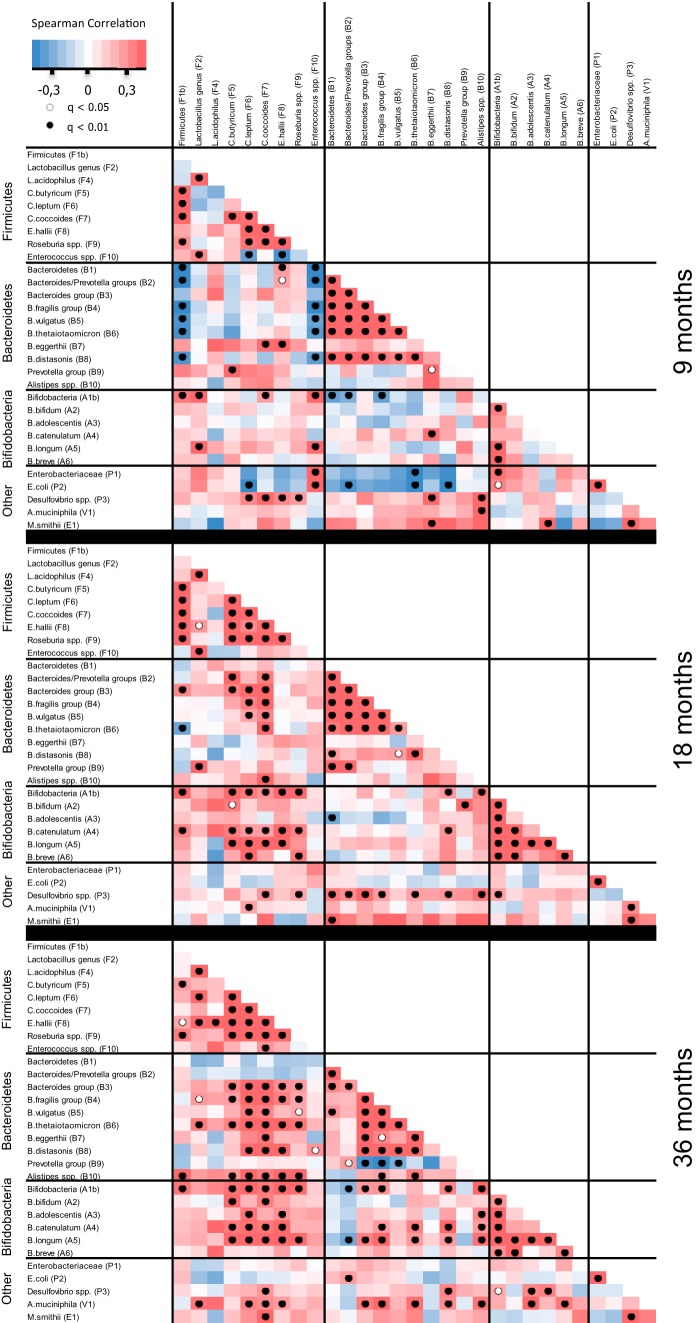
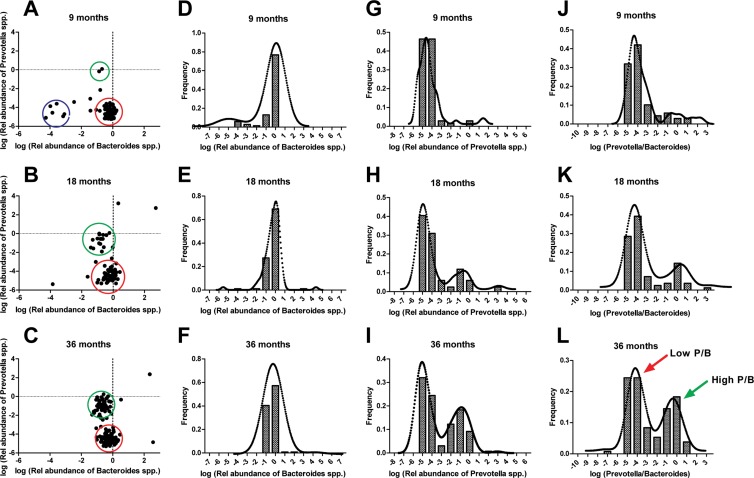
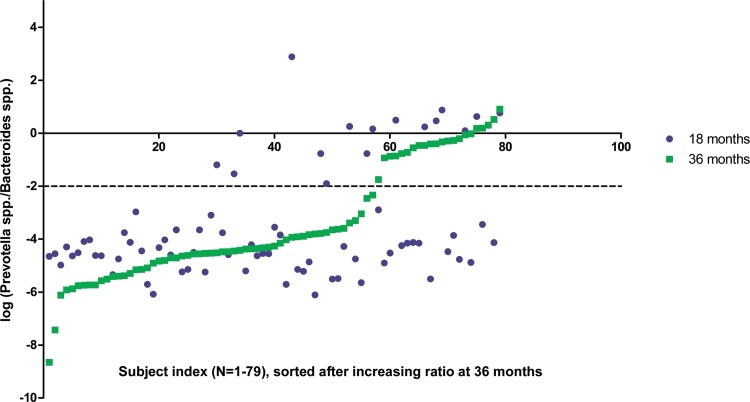
Fecal samples were obtained from a cohort of 330 healthy Danish infants at 9, 18, and 36 months after birth, enabling characterization of interbacterial relationships by use of quantitative PCR targeting 31 selected bacterial 16S rRNA gene targets representing different phylogenetic levels. Nutritional parameters and measures of growth and body composition were determined and investigated in relation to the observed development in microbiota composition. We found that significant changes in the gut microbiota occurred, particularly from age 9 to 18 months, when cessation of breastfeeding and introduction of a complementary feeding induce replacement of a microbiota characterized by lactobacilli, bifidobacteria, and Enterobacteriaceae with a microbiota dominated by Clostridium spp. and Bacteroides spp. Classification of samples by a proxy enterotype based on the relative levels of Bacteroides spp. and Prevotella spp. showed that enterotype establishment occurs between 9 and 36 months. Thirty percent of the individuals shifted enterotype between 18 and 36 months. The composition of the microbiota was most pronouncedly influenced by the time of cessation of breastfeeding. From 9 to 18 months, a positive correlation was observed between the increase in body mass index and the increase of the short-chain-fatty-acid-producing clostridia, the Clostridum leptum group, and Eubacterium hallii. Considering previously established positive associations between rapid infant weight gain, early breastfeeding discontinuation, and later-life obesity, the corresponding microbial findings seen here warrant attention.


Figures

FIG 1
FIG 1
Principal component analysis (PCA) of the GULDA microbiota. Upper plot: scores (individuals); lower plot: loadings (bacterial 16S rRNA gene targets). This figure shows the two primary principal components, PC1 and PC2, which explain 18.02% and 11.29% of data variation, respectively. Bacterial targets primarily associated with the lower left quadrant and thus relatively highly abundant in the 9-month samples were Enterococcus spp. (F10), Enterobacteriaceae (P1), and Escherichia coli (P2) and, to a lesser extent, B. breve (A6) and Lactobacillus spp. (F2). Bacterial targets appearing in higher abundances in the 36-month samples were the Bacteroidetes (B1), the Bacteroides-Prevotella group (B2), Bacteroides spp. (B3), B. fragilis group (B4), B. vulgatus (B5), Bacteroides thetaiotaomicron (B6), Alistipes spp. (B10), A. muciniphila (V1), and Desulfovibrio spp. (P3). Complete explanations for all labels are given in Table 1.
FIG 2
FIG 2
Progressive development of the gut microbial composition. Log2(fold changes) of microbial 16S rRNA gene targets occurring from 9 to 18 months (white) and 18 to 36 months (gray) and cumulative values from 9 to 36 months (black). Statistical significance of one-sided t tests: *, P < 0.05; **, P < 0.01; ***, P < 0.001. Data were corrected for multiple testing, using a maximal false discovery rate of 5%.
FIG 3
FIG 3
Effect of breastfeeding on infant gut microbiota. P values of Mann-Whitney statistical tests addressing differences between relative bacterial abundances at 9, 18, and 36 months, dependent on whether or not the infants were still breastfed at the 9-month examination. Green indicates an increase in children breastfed at 9 months, and red indicates a corresponding decrease.
FIG 4
FIG 4
Spearman pairwise correlation map of measured bacterial 16S rRNA gene targets at 9, 18, and 36 months. Because each time point was analyzed separately, the included number of individuals was >200 at each of the three samplings. The color gradient denotes Spearman R values. Dots indicate significant correlations, corrected for false discovery rates (q).
FIG 5
FIG 5
Enterotype defined as P/B development from 9 to 36 months. Relative abundances of log(Bacteroides spp.) and log(Prevotella spp.) show a distinct development from 9 to 36 months (A to C), moving from low relative abundances of both groups (blue circle) to a Bacteroides-prevalent microbiota (red circle) at 9 months. From 9 to 36 months, an increasing subgroup of Prevotella-prevalent samples appear (green circle), indicating segregation of specific individuals from a Bacteroides-driven into a Prevotella-driven enterotype. This progressive development is also evident from the corresponding histograms of frequency distributions of log(Bacteroides spp.) (D to F) and log(Prevotella spp.) (G to I) abundance, and particularly from the distributions of the logged P/B (J to L). The dotted curve in panels D to L shows a Kernel density plot, which is a modification of the histogram patterns, supporting the underlying statistical distributions found. Panels A, D, G, and J (9 months) represent 69 individuals; panels B, E, H, and K (18 months) represent 84 individuals; and panels C, F, I, and L (36 months) represent 130 individuals, as only individuals with relative abundances of Bacteroides spp. and Prevotella spp. exceeding the detection limit were included.
FIG 6
FIG 6
Changes in P/B occurring between age 18 and 36 months The 79 individuals giving qPCR results for both 18 (blue) and 36 (green) months were sorted after increasing logged P/B at 36 months. Samples above the dotted line belong to the high-P/B group (Prevotella-driven enterotype), while samples below this line belong to the low-P/B group (Bacteroides-driven enterotype). Forty-eight of 79 individuals remained in the low-P/B group, while 8/79 individuals remained in the high-P/B group from age 18 to age 36 months. Fourteen of 79 and 9/79 individuals shifted from low to high P/B, or from high to low P/B, respectively.

References

    1. Adlerberth I, Wold AE. 2009. Establishment of the gut microbiota in Western infants. Acta Paediatr. 98:229–238. 10.1111/j.1651-2227.2008.01060.x - DOI - PubMed
    1. Fallani M, Young D, Scott J, Norin E, Amarri S, Adam R, Aguilera M, Khanna S, Gil A, Edwards CA, Dore J. 2010. Intestinal microbiota of 6-week-old infants across Europe: geographic influence beyond delivery mode, breast-feeding, and antibiotics. J. Pediatr. Gastroenterol. Nutr. 51:77–84. 10.1097/MPG.0b013e3181d1b11e - DOI - PubMed
    1. Fallani M, Amarri S, Uusijarvi A, Adam R, Khanna S, Aguilera M, Gil A, Vieites JM, Norin E, Young D, Scott JA, Dore J, Edwards CA. 2011. Determinants of the human infant intestinal microbiota after the introduction of first complementary foods in infant samples from five European centres. Microbiology 157:1385–1392. 10.1099/mic.0.042143-0 - DOI - PubMed
    1. Harmsen HJ, Wildeboer-Veloo AC, Raangs GC, Wagendorp AA, Klijn N, Bindels JG, Welling GW. 2000. Analysis of intestinal flora development in breast-fed and formula-fed infants by using molecular identification and detection methods. J. Pediatr. Gastroenterol. Nutr. 30:61–67. 10.1097/00005176-200001000-00019 - DOI - PubMed
    1. Roger LC, Costabile A, Holland DT, Hoyles L, McCartney AL. 2010. Examination of faecal Bifidobacterium populations in breast- and formula-fed infants during the first 18 months of life. Microbiology 156:3329–3341. 10.1099/mic.0.043224-0 - DOI - PubMed

Publication types