

SAHA Suppresses Peritoneal Fibrosis in Mice
- PMID: 24584598
- PMCID: PMC4443984
- DOI: 10.3747/pdi.2013.00089
SAHA Suppresses Peritoneal Fibrosis in Mice
Abstract
Objective: Long-term peritoneal dialysis causes peritoneal fibrosis in submesothelial areas. However, the mechanism of peritoneal fibrosis is unclear. Epigenetics is the mechanism to induce heritable changes without any changes in DNA sequences. Among epigenetic modifications, histone acetylation leads to the transcriptional activation of genes. Recent studies indicate that histone acetylation is involved in the progression of fibrosis. Therefore, we examined the effect of suberoylanilide hydroxamic acid (SAHA), a histone deacetylase inhibitor, on the progression of peritoneal fibrosis in mice.
Methods: Peritoneal fibrosis was induced by the injection of chlorhexidine gluconate (CG) into the peritoneal cavity of mice every other day for 3 weeks. SAHA, or a dimethylsulfoxide and saline vehicle, was administered subcutaneously every day from the start of the CG injections for 3 weeks. Morphologic peritoneal changes were assessed by Masson's trichrome staining, and fibrosis-associated factors were assessed by immunohistochemistry.
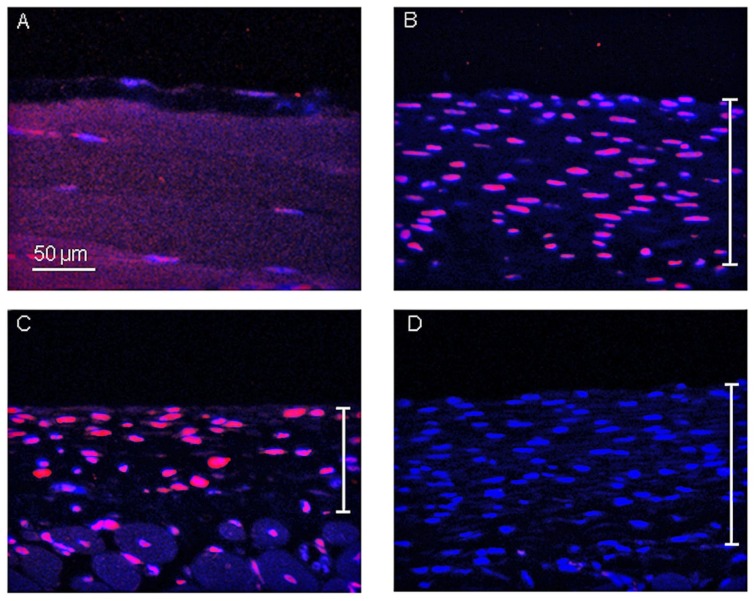
Results: In CG-injected mice, a marked thickening of the submesothelial compact zone was observed. In contrast, the administration of SAHA suppressed the progression of submesothelial thickening and type III collagen accumulation in CG-injected mice. The numbers of fibroblast-specific protein-1-positive cells and α-smooth muscle actin α-positive cells were significantly decreased in the CG + SAHA group compared to that of the CG group. The level of histone acetylation was reduced in the peritoneum of the CG group, whereas it was increased in the CG + SAHA group.
Conclusions: Our results indicate that SAHA can suppress peritoneal thickening and fibrosis in mice through up-regulation of histone acetylation. These results suggest that SAHA may have therapeutic potential for treating peritoneal fibrosis.
Keywords: SAHA; Suberoylanilide hydroxamic acid; chlorhexidine gluconate; histone deacetylase inhibitor; peritoneal fibrosis.
Copyright © 2015 International Society for Peritoneal Dialysis.
Figures


Similar articles
-
22-Oxacalcitriol prevents progression of peritoneal fibrosis in a mouse model.Perit Dial Int. 2013 Mar-Apr;33(2):132-42. doi: 10.3747/pdi.2011.00234. Epub 2012 Oct 2. Perit Dial Int. 2013. PMID: 23032084 Free PMC article.
-
Chondroitin sulfate prevents peritoneal fibrosis in mice by suppressing NF-κB activation.Med Mol Morphol. 2016 Sep;49(3):144-53. doi: 10.1007/s00795-016-0133-8. Epub 2016 Feb 15. Med Mol Morphol. 2016. PMID: 26880269
-
An inhibitor of Krüppel-like factor 5 suppresses peritoneal fibrosis in mice.Perit Dial Int. 2021 Jul;41(4):394-403. doi: 10.1177/0896860820981322. Epub 2021 Feb 1. Perit Dial Int. 2021. PMID: 33522431
-
Peritoneal fibrosis and epigenetic modulation.Perit Dial Int. 2021 Mar;41(2):168-178. doi: 10.1177/0896860820938239. Epub 2020 Jul 14. Perit Dial Int. 2021. PMID: 32662737 Review.
-
Suberoylanilide Hydroxamic Acid (SAHA) Is a Driver Molecule of Neuroplasticity: Implication for Neurological Diseases.Biomolecules. 2023 Aug 24;13(9):1301. doi: 10.3390/biom13091301. Biomolecules. 2023. PMID: 37759701 Free PMC article. Review.
Cited by
-
Genetic or pharmacologic blockade of enhancer of zeste homolog 2 inhibits the progression of peritoneal fibrosis.J Pathol. 2020 Jan;250(1):79-94. doi: 10.1002/path.5352. Epub 2019 Nov 14. J Pathol. 2020. PMID: 31579944 Free PMC article.
-
Anti-fibrotic effects of valproic acid in experimental peritoneal fibrosis.PLoS One. 2017 Sep 5;12(9):e0184302. doi: 10.1371/journal.pone.0184302. eCollection 2017. PLoS One. 2017. PMID: 28873458 Free PMC article.
-
Novel Aspects of the Immune Response Involved in the Peritoneal Damage in Chronic Kidney Disease Patients under Dialysis.Int J Mol Sci. 2023 Mar 17;24(6):5763. doi: 10.3390/ijms24065763. Int J Mol Sci. 2023. PMID: 36982834 Free PMC article. Review.
-
Histone acetyltransferase inhibitor C646 reverses epithelial to mesenchymal transition of human peritoneal mesothelial cells via blocking TGF-β1/Smad3 signaling pathway in vitro.Int J Clin Exp Pathol. 2015 Mar 1;8(3):2746-54. eCollection 2015. Int J Clin Exp Pathol. 2015. PMID: 26045780 Free PMC article.
-
The tumor-associated fibrotic reactions in microenvironment aggravate glioma chemoresistance.Front Oncol. 2024 May 28;14:1388700. doi: 10.3389/fonc.2024.1388700. eCollection 2024. Front Oncol. 2024. PMID: 38863628 Free PMC article. Review.
References
-
- Afthentopoulos IE, Passadakis P, Oreopoulos DG, Bargman J. Sclerosing peritonitis in continuous ambulatory peritoneal dialysis patients: One center’s experience and review of the literature. Adv Ren Replace Ther 1998; 5:157–67. - PubMed
-
- Gandhi VC, Humayun HM, Ing TS, Daugirdas JT, Jablokow VR, Iwatsuki S, et al. Sclerotic thickening of the peritoneal membrane in maintenance peritoneal dialysis patients. Arch Intern Med 1980; 140:1201–3. - PubMed
-
- Williams JD, Craig KJ, Topley N, Von Ruhland C, Fallon M, Newman GR, et al. Morphologic changes in the peritoneal membrane of patients with renal disease. J Am Soc Nephrol 2002; 13:470–9. - PubMed
-
- Park SH, Kim YL, Lindholm B. Experimental encapsulating peritoneal sclerosis models: Pathogenesis and treatment. Perit Dial Int 2008; 28(Suppl 5):S21–8. - PubMed
-
- Sekiguchi Y, Hamada C, Ro Y, Nakamoto H, Inaba M, Shimaoka T, et al. Differentiation of bone marrow-derived cells into regenerated mesothelial cells in peritoneal remodeling using a peritoneal fibrosis mouse model. J Artif Organs 2012. September; 15:272–82. - PubMed
Publication types
MeSH terms
Substances
LinkOut - more resources
Full Text Sources
Other Literature Sources
Research Materials
